

Analys
SIP Nordic – Råvaruguiden – januari 2013
 Timing viktigare än någonsin
Tiden går som vanligt alldeles för fort och det känns som igår jag skrev den första råvaruguiden (jan-12). Samtidigt som det är dags att summera ett ljummet råvaruår är det hög tid att rikta blickarna mot 2013 års spåkula. Fortsätter guldet mot ett positivt år för 14:e året i rad, fortsätter jordbruksråvarornas kräftgång och kommer vi att se olja klättra upp mot höga nivåer? Oavsett vad har vi ett spännande år framför oss där börserna under 2012 presterade bra trots oron för en Eurokris. 2013 blir spännande där mycket fokus kommer ligga kring USAs budgetstup och evigt växande budgetunderskott. Något som på alla vis kommer påverka råvarorna. Men var beredda på en tur i berg- och dalbanan. 2013 kan för råvaror bli mycket lik 2012 där timing är A och O.
Jag skrev i min första råvaruguide att jag inför 2012 trodde på platina och guld. Guld och platina ökade under 2013 med 5 respektive 9 %. En bra avkastning under rådande marknadsförhållanden men faktum är att man med rätt timing och aktiv börshandel hade kunna mångdubblat dessa siffror.
De flesta råvaror pendlade kraftigt under 2012 där vi såg en bred uppgång i början av året vilket snabbt byttes mot en negativ trend fram till slutet av sommaren. Då var det återigen dags för FED att sätta igång sedelpressarna vilket drev råvarupriserna uppåt igen. Guld var inget undantag. Faktum är att den aktive handlaren hade kunnat ha en avkastning på över 80 % om denna köpt och sålt guld vid rätt tillfälle.
Nu är det ju alltid enkelt i efterhand att säga hur man borde ha gjort men jag tror faktiskt att vi får se ett liknande scenario under 2013.
Mycket av nyhetsflödet kommer i år att vara kring USAs budgetstup och det växande budgetunderskottet. Nu verkar det som att den kortsiktiga krisen är bortblåst. Något som får råvaror att rusa. Problemet kvarstår dock och om två månader måste frågorna kring USA budgetunderskott lösas. Något som hotar USAs kreditbetyg och som på många sätt kan påverka priset på råvaror. Framförallt guld, silver och olja.
2013 kommer således bli ett spännande råvaruår där bra avkastning finns att hämta. Det är dock viktigare än någonsin att ha rätt timing.
Personligen tror jag att guld kommer att fortsätta upp under 2013. USA kan mycket väl tvingas sätta igång fler stimulanspaket vilket är positivt för guldet. För den aktive med rätt timing kan guld bli en riktig vinnare under 2013.
Alexander Frick
Råvaror – Energi
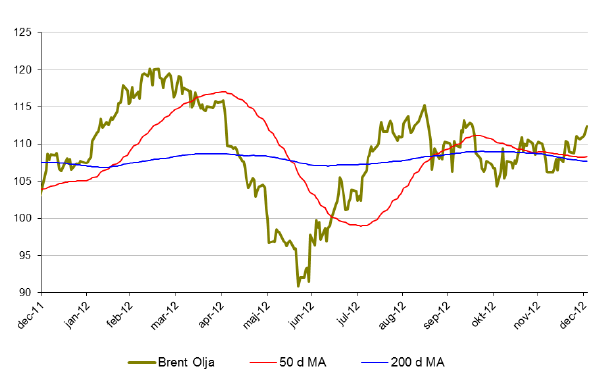
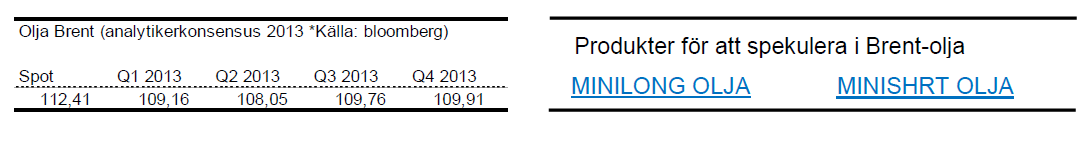
Brent olja
- Brentoljan åkte under 2012 berg och dalbana. Brent gick under 2012 upp dryga 2 %.
- Under december månad ökade priset på brent med cirka 1,6 %.
- Brent påverkades mycket av de ekonomiska oroligheterna under 2012. Något som mycket väl kan fortsätta under 2013. Stora svängningar är alltså att vänta.
- Monetära stimulanser sätter dollarn under press vilket hjälper oljan att stanna på höga nivåer.
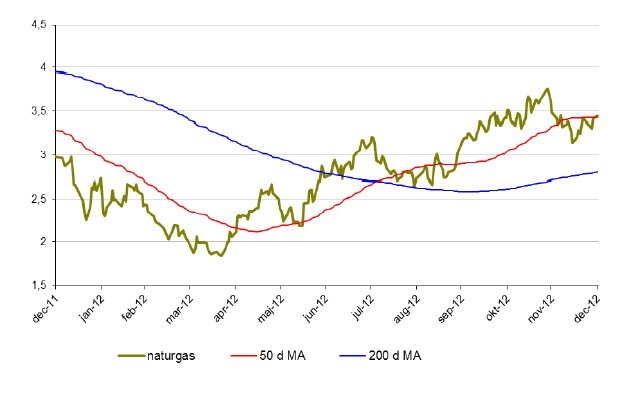
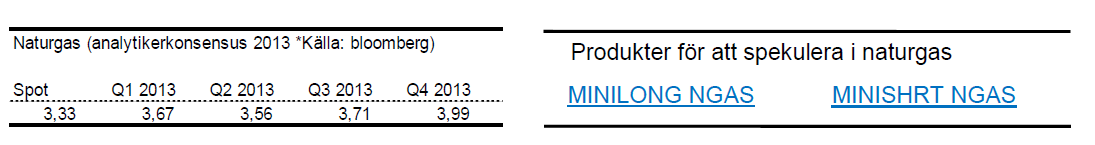
Naturgas
- Från i mitten av april hade Naturgas en mycket stark period under 2012. Sedan botten i april klättrade priset på naturgas med nästan 80 % och avslutade året på cirka 10 % upp.
- Under december föll priset på naturgas med 10 %
- Efter den starka trenden är det inte osannolikt att naturgas börjar tappa i fart. Naturgas handlas nu strax under 50-dagars medelvärde.
Råvaror – Metaller
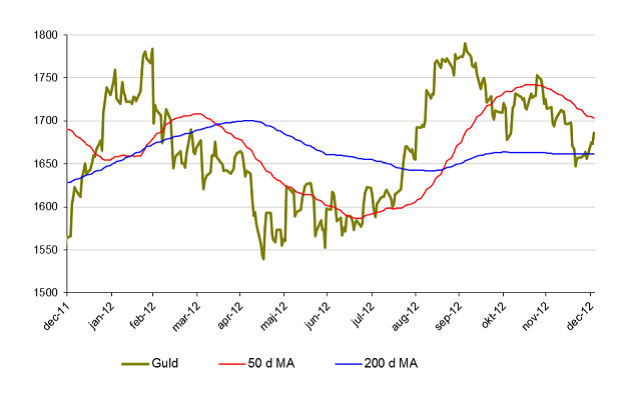
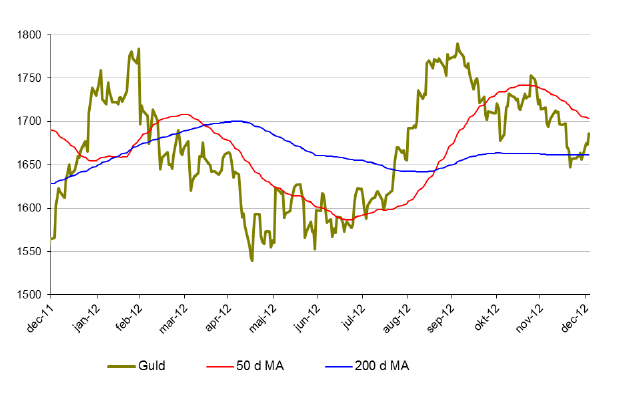
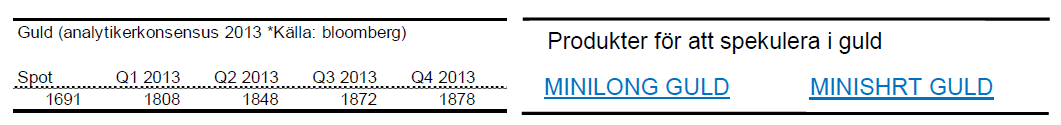
Guld
- Guld stängde på en positiv siffra 2012 vilket var det 13:e året i rad med positiv utveckling!
- Guld pendlade likt olja kraftigt av samma anledningar. Ekonomiska oroligheter och stimulanspaket satte guldet i pendling.
- Under 2012 ökade priset på guld med ca 5 %.
- I december tappade guld dock nästan 4 %.
- För den aktive börshandlaren finns stora pengar att tjäna då guldpriset med stor sannolikhet kommer att pendla en del under 2013.
- Den amerikanska penningpolitiken styr till stor del det mesta.
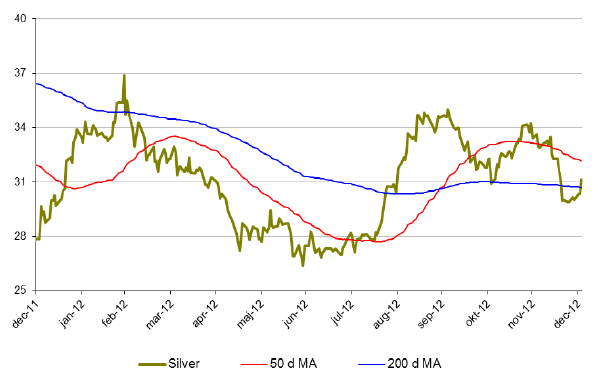
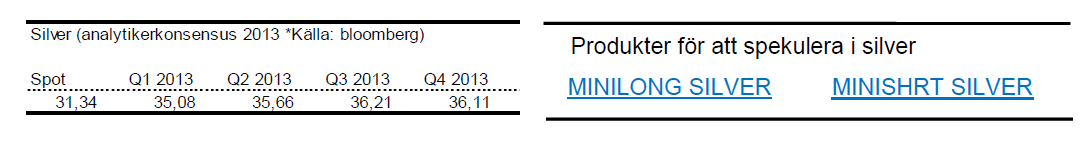
Silver
- Silver hade även ett positivt år 2012. Än dock med kraftiga svängningar. För året var silver upp dryga 6 %.
- December månad var dock lite mer mörk då silver föll nästan 12 %.
- Silver handlas strax ovanför 200 dagars medelvärde men befinner sig i en kortsiktigt negativ trend.
- Viktiga nivåer hittar vi kring 27 dollar där vi har en viktig motståndszon.
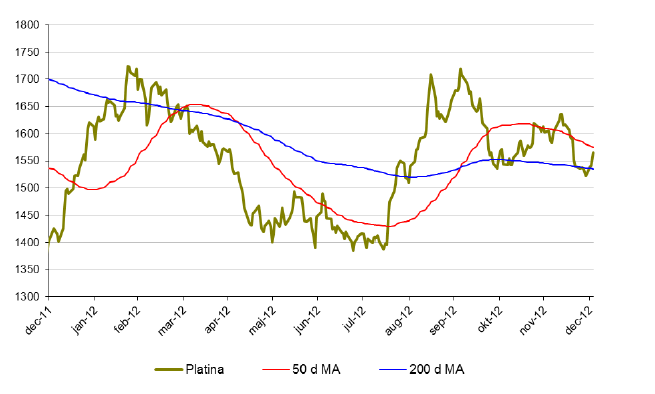
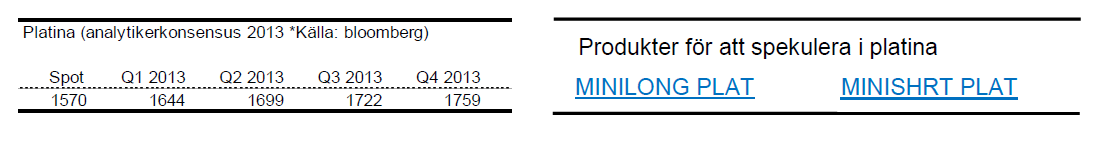
Platina
- Platina var inget undantag under 2012. Platina ökade med cirka 9 % under 2012.
- Platina handlas dock till ett lägre pris än guld. Något som historiskt sett varit det motsatta.
- Under december föll priset på platina med 4 %.
- Platina befinner sig i en negativ trend där 50 dagars glidande medelvärde på 1650 blir intressant att observera under januari.
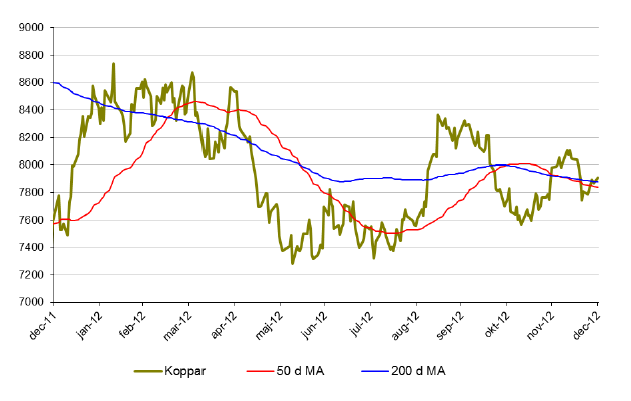
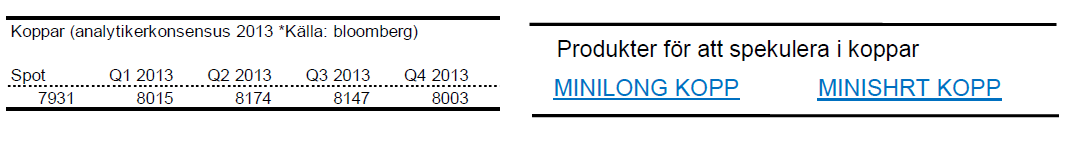
Koppar
- Metallerna svingade rejält under 2012 och koppar är inget undantag. Trots att koppar avslutade året på cirka 2,7 % upp är det ändå nästan 10 % under årets högstanivå.
- Under december föll priset på koppar med 0,6 %
- Koppar handlas just nu över både 50 och 200 dagars medelvärde men i en negativ trend. 50 dagars medelvärde korsade även 200 dagars medelvärde ovanifrån början av december.
- Tillväxtländernas förbrukning kommer styra mycket under 2013.
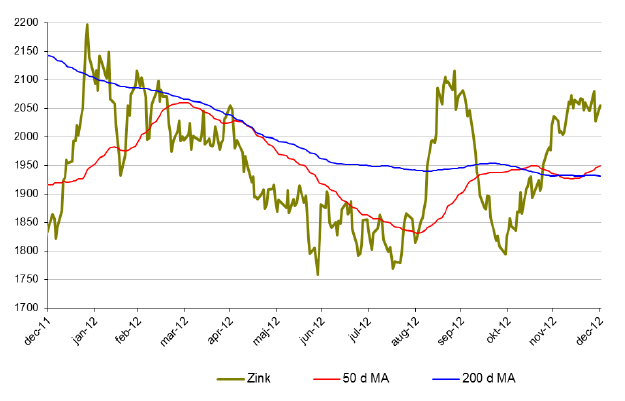
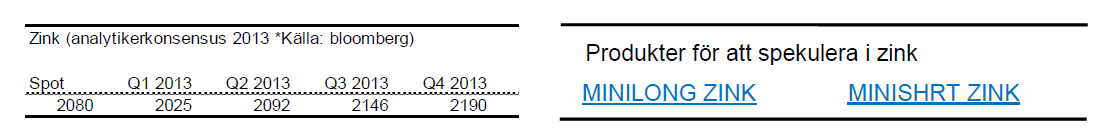
Zink
- Zink hade ett bra 2012. Upp drygt 12 %.
- Under december månad ökade priset något.
- Zink närmar sig nu viktiga nivåer kring 2100-2150 där vi har en rad motståndsnivåer. Blir intressant att följa under 2013.
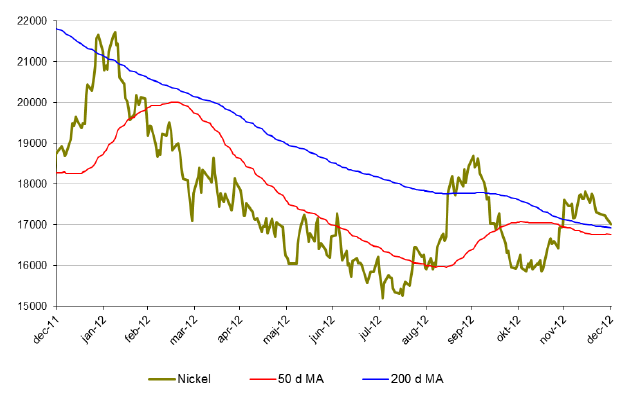
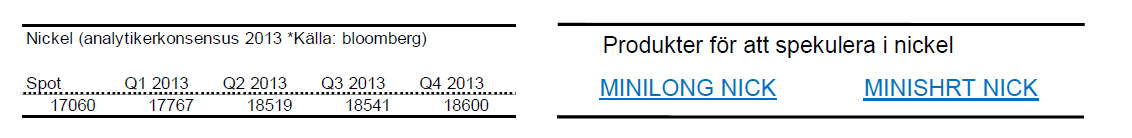
Nickel
- Nickel presterade sämst av alla basmetaller under 2011. 2012 blev inte bättre. Slutsiffran blev -8 % för 2012.
- Under december var priset på zink oförändrat.
- Nickelmarknaden är fortsatt mättad med ökande lager.
- Många stora projekt inom nickelproduktion är redan finansierade och irreversibla vilket kommer att öka tillgången av nickel ytterligare.
Råvaror – Jordbruk
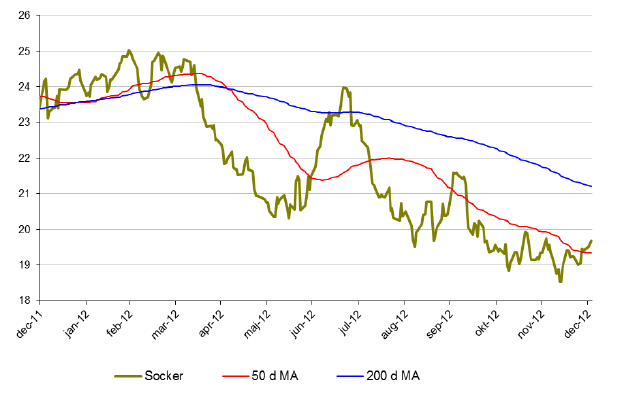
Socker
- Socker hade inget roligt 2012 med en slutsiffra på nästa -20 %.
- Under december månad är dock socker upp drygt 2 %. Kanske vänder den negativa trenden här.
- Socker föll under december igenom ett viktigt motståndsområde kring 19 cents. Nu har denna nivå brutits och det ser lite mer positivt ut.

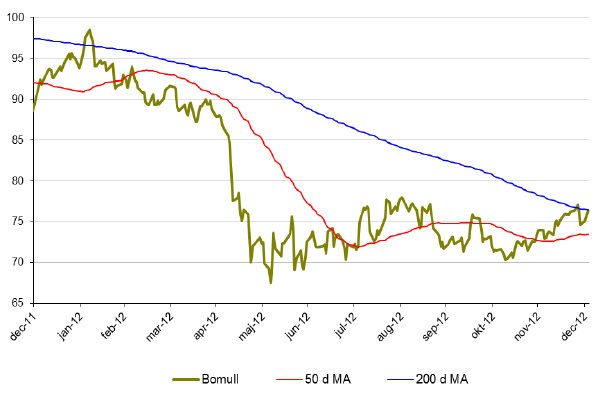
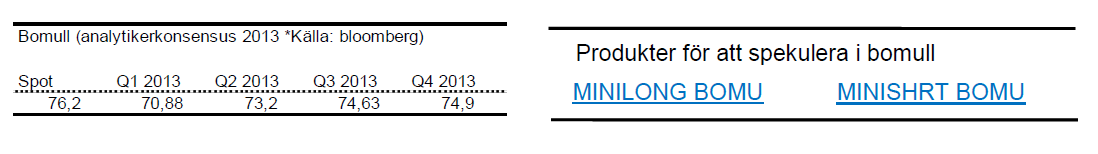
Bomull
- Bomull och socker gick hand i hand under 2012. Bomullspriset föll med cirka 20 % under 2012.
- Under december månad ökade priset på bomull dryga 4 %.
- Svag kinesisk och indisk efterfrågan samt lägre ekonomisk tillväxt i Europa har lett till ökade lager. Monetära stimulanspaket kan ge en uppsving för konjunkturen och därmed öka bomullskonsumtionen.
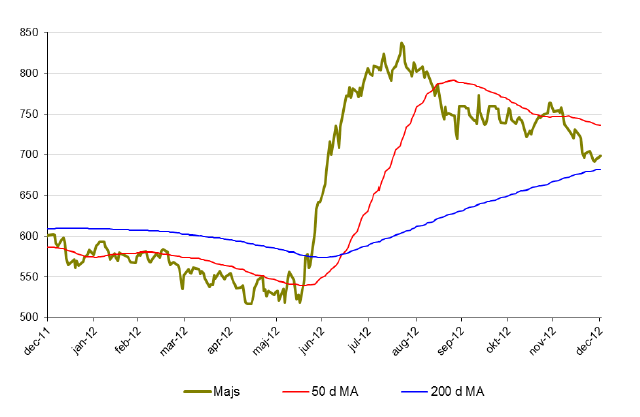
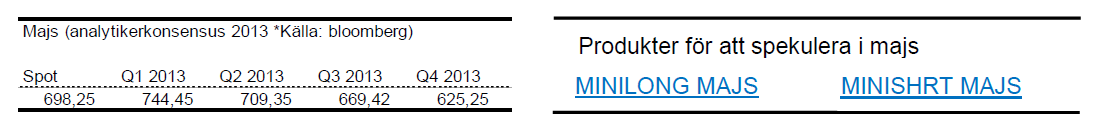
Majs
- Efter den kraftiga uppgången under sommaren 2012 föll priset på majs tillbaka men året avlutades på knappa 8 % upp.
- Under sommaren rådde extrem torka i USA vilket fick priset på majs att skjuta i höjden. Endast 40 % av skörden var av god kvalitet. Att jämföra med 70 % i normala fall.
- Under december månad föll priset på majs med 8 %.
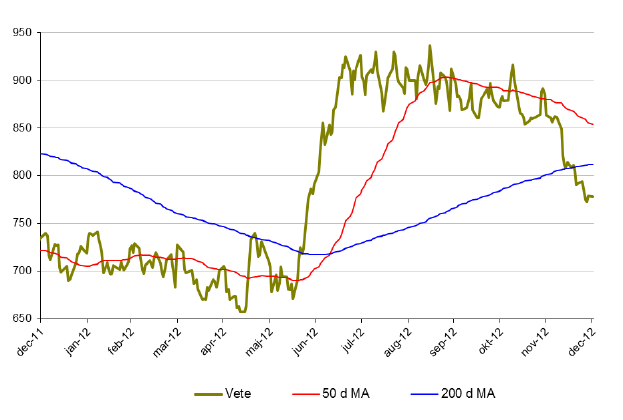
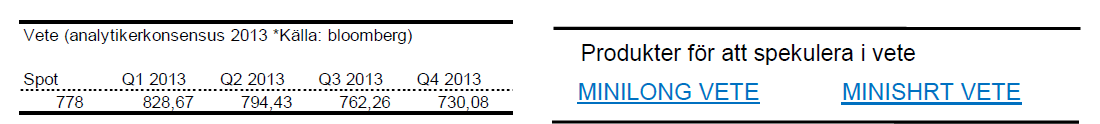
Vete
- Då majsproduktionen drabbades av den värsta torkan på många år gick fler producenter över till produktion av vete vilket fick priset att skjuta i höjden under mitten av 2012. Likt majs föll vete tillbaka under andra halvan av året. Slutligen hamnade vete på +6 % för året.
- Under december föll vete med drygt 8 %.
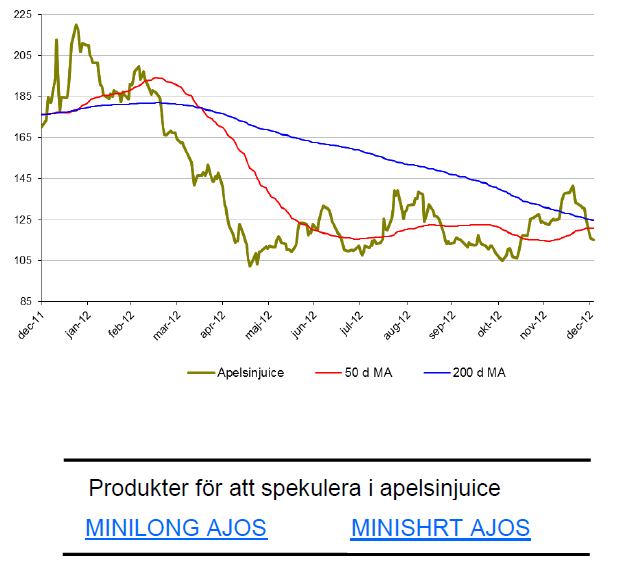
Apelsinjuice
- Den som låg kort apelsinjuice under 2012 har gjort en mycket bra affär. För året föll apelsinjuice drygt 28 %.
- Under december föll apelsinjuice med ytterligare 6 %.
- Priset på apelsinjuice är fortfarande 70 % högre än botten 2009. Fallhöjden är således hög. Mycket hög.
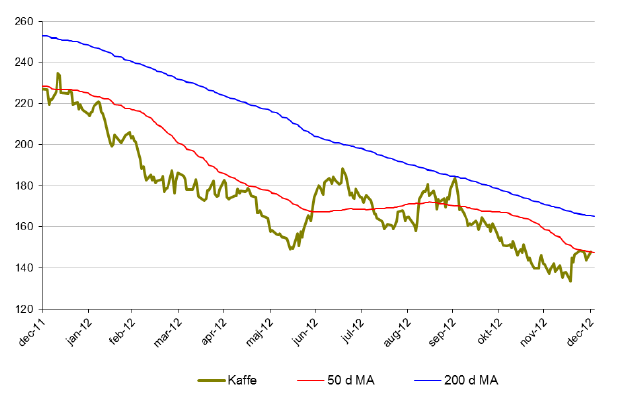
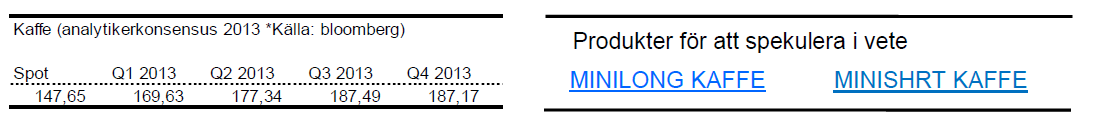
Kaffe
- För första gången är kaffe med i Råvaruguiden. Kaffe hade likt de andra jordbruksmetallerna ett svagt 2012. För året tappade kaffe 35 %.
- Kaffe gick under december upp 3,6 % vilket kan vara början på ett trendbrott.
- Om kaffe lyckas bryta upp över 50 dagars glidande medelvärde kan vi få ett trendskifte.
- Kaffe ligger dock fortfarande i en långsiktigt nedåtgående trend.
[box]Denna uppdatering är producerat av SIP Nordic och publiceras i samarbete och med tillstånd på Råvarumarknaden.se[/box]
Ansvarsbegränsning
Detta produktblad utgör endast marknadsföring och har sammanställts av SIP Nordic Fondkommission AB.
Innehållet ger inte fullständig information avseende det finansiella instrumentet. Investerare uppmanas att del av prospekt och slutliga villkor, vilka finns tillgängliga på: www.rbsbank.se/markets, innan ett investeringsbeslut tas.
Förekommande exempel är simulerade och baseras på SIP Nordics egna beräkningar och antaganden, en person som använder andra data eller antaganden kan nå andra resultat. Administrativa avgifter och transaktionsavgifter påverkar den faktiska avkastningen.


Selling down on a ”deal”. Brent crude fell 6.2% last week with accelerated weakness towards the end of the week. Close of the week at $87.33/b and low of the week (and on Friday) of $85.8/b. Brent is falling another 4% this morning to $83.7/b on confirmation by Iran that a MoU text has been reached and that it will be signed on Friday this week.

So what is this ”deal” worth? Talk on the desk here this morning is that it is much like ”putting lipstick on a pig” where Trump has to sell this at home as a victory where ”the SoH has reopened”, the nuclear issue will be ironed out over the coming 60 days (or maybe 600 days?) and US consumers are getting a lower gasoline price and maybe US republicans survives the midterm elections.
The importance for Iran is that it emerges as the defacto winner of this war in the eyes of the non-US public world. That Iran now onwards is the ”ruler of the SoH” (combo of geography and new weapons systems like drones) or more softer: ”the guarantor of safe passage through the SoH”.
Iran doesn’t need nuclear weapons any more. Nuclear deterrence doesn’t work any more. Ukraine has made many attacks deep into Russia without being nuked in return. Plenty of Iranian ballistic rockets blasts over Israel but Iran wasn’t nuked in return.
There is no trust between the US and Iran. We don’t know all the details yet of the MoU. But what we do know is that there is no trust between the US and Iran what so ever. This is probably more like a descriptive text on how they can cooperate in a way where both sides keeps tactical leverage. Neither side makes irreversible concessions. Violations can be punished quickly. Cooperation produces immediate benefits.
This is a fragile structure. It can easily break down. There may be details which cannot be overcome. To be seen on Friday. The US has to show that it is willing put enough force behind managing and restraining Israel versus Hezbollah in Lebanon. We have seen that Netanyahu hasn’t listened all that much to Trump’s directives and wishes. This could be a major obstacle.
A gradual reopening is tactically preferable for Iran. A tactical leverage for Iran right now is that global oil stocks have been drawn down towards painful and increasingly dangerous levels with increasing risks for oil price spikes in mid-July to August. This together with US midterm elections on 3 November gives tactical leverage to Iran. Iran probably doesn’t want to fully give up on that leverage. A rapid, full reopening where global stocks are able to refill over the coming 60 days will significantly erode that leverage. If Iran reinstates a closure of the SoH after 60 days (if talks break down again), then the effect won’t be that impactful in terms of prices and the US midterm elections.
So a gradual and partial reopening where global markets gets the oil they need while they are unable to rebuild stocks could be a practical middle way for both parties. Trump can sell it as ”the SoH has reopened” and get affordable gasoline for US consumers. Iran can sell it as ”the SoH has fully reopened, but there is some friction” so flow is only 60-80% of normal.
Not much real demand destruction below $100/b. What we do know is that there is not much real price pain demand destruction for oil globally at an oil price below $100/b. A lot of demand-shock destruction. Fear. But demand should now come roaring back towards normal with fear for exceptionally high prices now is rapidly receding.
Sudden China demand destruction due to EVs? Bullocks. EV share of total Chinese carpool now around 13%. Share of new sales of EVs has reached 50%. This is a very gradual process. It doesn’t make oil demand fall like a rock over night. When EV new sales share reaches 100%, then the gasoline car pool will contract by some 5-10% per year. But that is only gasoline. Sudden reduction in Chinese oil demand is more about shock and risk.
Chinese crude oil imports will come roaring back. At what price? Today’s ”neutral” oil price is $70/b. That is the five year price which has steadily traded around the $70/b mark over the past 3-4 years. With still a risky picture one would think that China and the rest of the world will be big buyers of oil in the range of $70-85/b.
Global demand will likely snap back towards normal, forecasted demand and growth at such prices.
Physical reopening is a gradual process. The physical and practical reopening of the SoH will likely be gradual rather than sudden. And that probably suites Iran tactically as well.
Brent M1 price versus the Brent 5-yr (today’s ”normal” price)

Market is starting to take US/Iran headlines with a pinch of salt. Brent crude rose $2.8/b yesterday to an official close of $112.1/b. But after that it traded as low as $108.05/b before ending late night at around $109.7/b. Through the day it traded in a range of $106.87 – 112.72/b amid a flurry of news or rumors from Iran and the US. ”US temporary sanctions during negotiations” (falls alarm). ”We will bomb Iran” (not anyhow),… etc. While the market is still fluctuating to this kind of news flow, it is starting to take such headlines with a pinch of salt.
We’ll see. Maybe, maybe not. The Brent M1 contract is trading at $110.2/b this morning which very close to the average ticks through yesterday of $110.4/b.
Trump with bearish, verbal intervention whenever Brent trades above $110/b it seems. What seems to be a pattern is that Trump states something like ”very good negotiations going on with Iran”, ”New leaders in Iran are great,..”, ”Great progress in negotiations,…”, ”Deal in sight,..” etc whenever the Brent M1 contract trades above $110/b. An effort to cool the market. These hot air verbal interventions from Trump used to have a heavy bearish impact on prices, but they now seems to have less and less effect unless they are backed by reality.
As far as we can see there has been no real progress in the negotiations between the US and Iran with both sides still standing by their previous demands.
Iran is getting stronger while the cease fire lasts making a return to war for Trump yet harder. Iran is naturally in constant preparation for a return to war given Trump’s steady threats of bombing Iran again. Iran is naturally doing what ever is possible to prepare for a return to war. And every day the cease fire lasts it is better prepared. This naturally makes it more and more difficult and dangerous for the US to return to warring activity versus Iran as the consequences for energy infrastructure in the Persian Gulf will be more and more severe the longer the cease fire lasts. Israel seems to see it this way as well. That the war is not won and that current frozen state of a cease fire gives Iran opportunity to rebuild military and politically.
Global inventories are drawing down day by day. How much? In the meantime the Strait of Hormuz stays closed. There is varying measures and estimates of how much global inventories are drawing down. Our rough estimate, back of the envelope, is that global inventories are drawing down by at least some 10 mb/d or about 300 mb/d in a balance between loss of supply versus demand destruction. Other estimates we see are a monthly draw of 250-270 mb/d. The IEA only ’measured’ a draw in global observable stocks of 117 mb in April with oil on water rising 53 mb while on shore stocks fell 170 mb. But global stocks are hard to measure with large invisible, unmeasured stocks. As such a back of the envelope approach may be better.
Oil products is what the world is consuming. Oil product prices likely to rise while product stocks fall. Strategic Petroleum Reserves (SPR) are predominantly crude oil. Discharging oil from OECD SPR stocks, a sharp reduction in Chinese crude imports and a reduction in global refinery throughput of 6-7 mb/d has helped to keep crude oil markets satisfactorily supplied. But global inventories are drawing down none the less. And oil products is really what the world is consuming. So if global refinery throughput stays subdued, then demand will eventually have to match the supply of oil products. The likely path forward this summer is a steady draw down in jet fuel, diesel and gasoline. Higher prices for these. Then, if possible, higher refinery throughput and higher usage of crude in response to very profitable refinery margins. And lastly sharper draw in crude stocks and higher prices for these. But some 6 mb/d of oil products used to be exported through the Strait of Hormuz. And it may not be so easy to ramp up refinery activity across the world to compensate. Especially as Ukraine continues to damage Russian refineries as well as Russian crude production and export facilities.
Watch oil product stocks and prices as well as Brent calendar 2027. What to watch for this summer is thus oil product inventories falling and oil product premiums to crude rising. Another measure to watch is the Brent crude 2027 contract as it rises steadily day by day as the Strait of Hormuz stays closed and global oil inventories decline. The latter is close to the highest level since the start of the war and keeps rising.
The Brent M1 contract and the Brent 2027 prices and current price of jet fuel in Europe (ARA). All in USD/b

Our back of the envelope calculation of the global shortage created by the closure of the Strait of Hormuz. Note that 3.5 mb/d of discharge from SPR is also a draw. Note also that ’Forced demand loss’ of 2.5 mb/d is probably temporary and will fall back towards zero as logistics are sorted out leaving ’Price demand loss’ to do the job of balancing the market. Thus a shortfall of at least 9 mb/d created by the closure. More if SPR discharge is included and more if Forced demand loss recedes.

Brent is climbing higher. Front-month is at USD 106.3/bl this morning, close to a weekly high and a USD 9/bl jump from Mondays open. This is the move we flagged as a risk earlier in the week: the market shifting from ”a deal is around the corner” to ”this is going to take longer than we thought”.

Analyst Commodities, SEB
During April, rest-of-year Brent remained remarkably stable around USD 90/bl. A stability which rested on one single assumption: the SoH reopens around 1 May. That assumption is now slowly falling apart.
As we highlighted yesterday: every week of delay beyond 1 May adds (theoretically) ish USD 5/bl to the rest-of-year average, as global inventories draw 100 million barrels per week. i.e., a mid-May reopening implies rest-of-year Brent closer to USD 100/bl, and anything pushing into June or July takes us meaningfully higher.
What’s changed in the last 48 hours:
#1: The US military has formally warned that clearing suspected sea mines from SoH could take up to six months. That is a completely different timescale from what the financial market is pricing. Even a political deal tomorrow does not immediately reopen the strait.
#2: Trump has shifted his tone from urgency to ”strategic patience”. In yesterday’s press conference: ”Don’t rush me… I want a great deal.” The market is reading this as a president no longer feeling pressured by timelines, with the naval blockade running in the background.
#3: So far, the military activity is escalating, not de-escalating. Axios reports Iran is laying more mines in SoH. The US 3rd carrier strike group (USS George H.W. Bush) is arriving with two countermine vessels. Trump yesterday ordered the US Navy to destroy any Iranian boats caught laying mines. While CNN reports that the Pentagon is actively drawing up plans to strike Iranian SoH capabilities and individual Iranian military leaders if the ceasefire collapses. i.e., NOT a attitude consistent with an imminent deal!
Spot crude and product prices eased off the early-April highs on a combination of system rerouting and deal optimism. Both now weakening. Goldman estimates April Gulf output is reduced by 14.5 mbl/d, or 57% of pre-war supply, a number that keeps getting worse the longer this drags on.
Demand-side adaptation is ongoing: S. Korea has cut its Middle East crude dependence from 69% to 56% by pulling more from the Americas and Africa, and Japan is kicking off a second round of SPR releases from 1 May. But SPRs are finite.
Ref. to the negotiations, we should not bet on speed. The current Iranian leadership is dominated by genuine hardliners willing to absorb economic pain and run the clock to extract concessions. That is not a setup for a rapid resolution. US/Israeli media briefings keep framing the delay as ”internal Iranian divisions”, the reality is more complicated and points toward weeks and months, not days.
Our point is that the complexity is large, and higher prices have only just started (given a scenario where the negotiations drag out in time). The market spent April leaning on the USD 90/bl rest-of-year assumption; that case is diminishing by the hour. If ”early May reopening” is replaced by ”June, July or later” over the next week or two, both crude and products have meaningful room to reprice higher from here. There is a high risk being short energy and betting on any immediate political resolution(!).


Vattenfalls och Industrikrafts kärnkraftsbolag Videberg Kraft har valt Rolls-Royce SMR
Selling down on a ”deal”

Sommarväder skapar prisrally på elbörsen
Oil product price pain is set to rise as the Strait of Hormuz stays closed into summer

Solkraften pressar elpriserna dagtid
Oil product price pain is set to rise as the Strait of Hormuz stays closed into summer
Sommarväder skapar prisrally på elbörsen
Vattenfalls och Industrikrafts kärnkraftsbolag Videberg Kraft har valt Rolls-Royce SMR
Selling down on a ”deal”
-
Analys4 veckor sedan
Oil product price pain is set to rise as the Strait of Hormuz stays closed into summer
-
Nyheter2 veckor sedan
Sommarväder skapar prisrally på elbörsen
-
 Nyheter2 dagar sedan
Vattenfalls och Industrikrafts kärnkraftsbolag Videberg Kraft har valt Rolls-Royce SMR
-
Analys3 dagar sedan
Selling down on a ”deal”