

Analys
SIP Nordic – Råvaruguiden – juni 2013

 Silver – gulds vilda lillebror
Silver är med största sannolikhet en av de mest volatila av världens populära marknader. När silver rör sig, rör sig silver snabbt. Både stora vinster och förluster kan ske under loppet av några veckor, vilket kan vara spännande eller skräckinjagande beroende på vilken sida du sitter på.
Silver har haft en tuff start på året med en nedgång på drygt 25 %. Samtidigt har guld tappat runt 17 %. En skillnad på 8 procentenheter. Silver en guldprodukt med hävstång
Att silver tappat mer än guld är ingen slump. Silver omnämns inte så ofta i medier. Däremot skrivs det och analyseras det kring gulds vara och inte vara och här finns det gott om information att hämta. För att följa silvers utveckling räcker det att kolla på guld.
Silver kan beskrivas som gulds vilda lillebror som gärna gör som storebror men lite yvigare. Med andra ord brukar silver följa guldets dagliga utveckling men med större rörelser.
Om man kollar på hur den dagliga utvecklingen för guld och silver varit sedan januari 2012 styrks ovanstående teori.
Av de totalt 369 handelsdagarna rörde sig guld och silver åt samma håll i 289 dagar av dessa. Nästan 80 % av dagarna.
Kollar man sedan vidare på de dagar då guld och silver rörde sig åt samma håll överpresterade silver guld 222 dagar av dessa eller 80 % av dagarna.
Värt att notera är att de dagar som guld och silver rör sig åt samma håll rör sig silver 3,3 gånger kraftigare i snitt. Således är silver en guldprodukt med hävstång.
Egentligen är det inte så konstigt att detta fenomen finns. I vår Tradingklubb på tisdagar pratar vi ofta om att man inte ska gå emot marknadsklimatet. Med det menas att man inte ska ta en position i en aktie i motsatt riktning som OMXS30 trendar. Så gäller nog även silver och guld. Frågan är hur många stora investerare som vågar gå lång i silver samtidigt som guld går ned och vice versa.
Alexander Frick
Råvaror – Energi
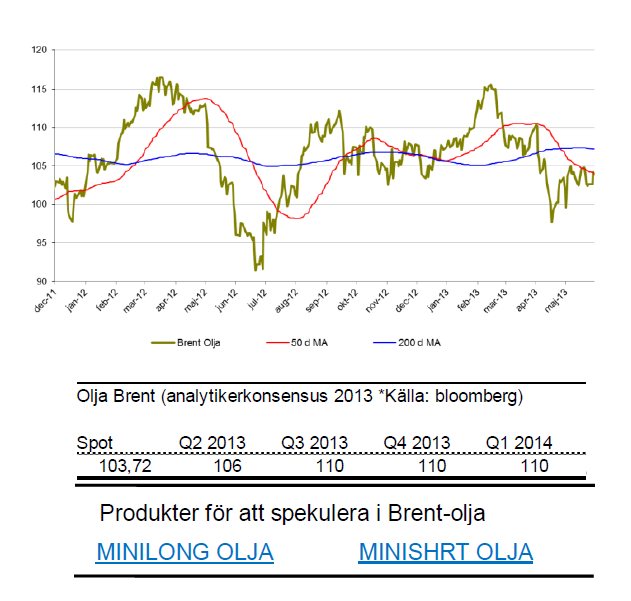
Brent olja
- Berg och dalbanan fortsätter. Under maj har brent ökat med 2,2 %. För året är dock brent ned knappa 6 %.
- Oljan kämpar mot rapporter från OECD och IMF om att Kinas tillväxt ser sämre ut.
- Vidare så håller ökade lager priset nere.
- Ökad oro för åtstramningar på tillgångssidan till följd av oroligheter i mellanöstern motarbetar de negativa nyheterna.
- Utvecklingen för USD och huruvida FED kommer fortsätta med sitt QE kommer styra mycket för oljans fortsatta utveckling.
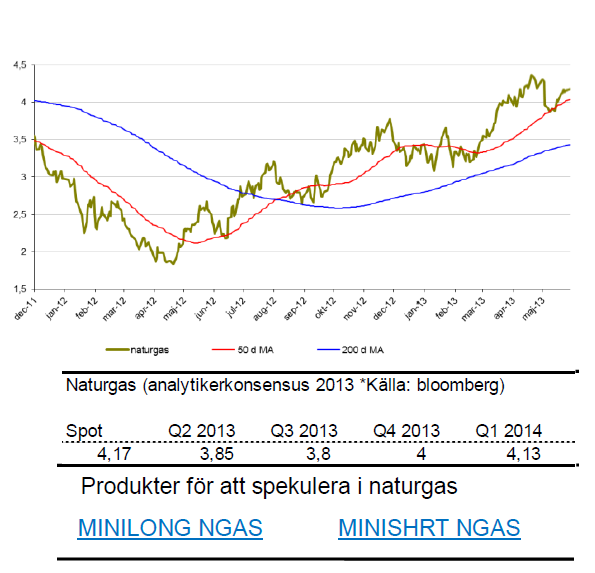
Naturgas
- Naturgas starka trend fortsätter. Trots en rekyl under maj månad är trenden fortsatt uppåt.
- Naturgas tappade ca 3.5 % under maj men är för året ändå upp nästan 30 %.
- Rekylen under maj månad kan mycket väl ha varit hälsosam och skapat en ny högre botten.
- Ökningen av lagrad naturgas är nu på mycket låga nivåer. De lägsta på fem år.
- Återigen är det vädret i USA som till stor del driver uppgången. En vinter som var kallare än normalt har nu skiftet till en varmare vår vilket gör att bränsle krävs för kylsystem.
Råvaror – Metaller
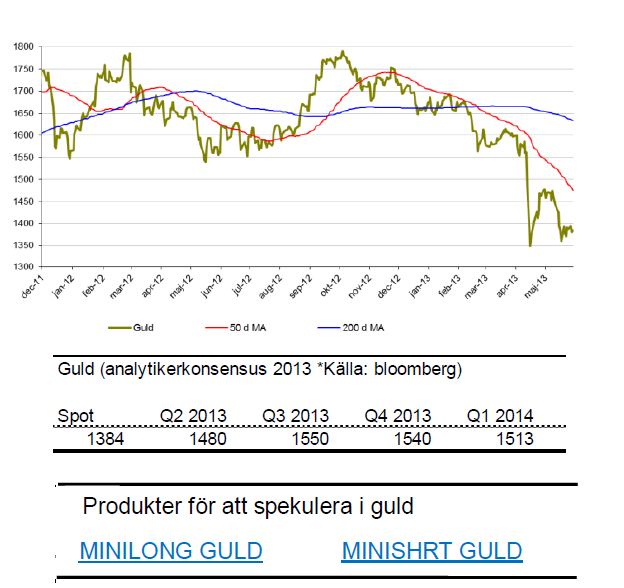
Guld
- Dödskorset (50D- korsar 200D-medelvärde uppifrån) i februari visade sig ge ordentligt med bränsle åt nedgången.
- Under maj fortsatte nedgången och guld gick ned 4,7 %. För året är guld ned 15 %.
- Viktig nivå kring $1350. Återstår att se om denna nivå skapat en dubbelbotten.
- Medierapportering om att FED skulle ge upp sitt stödköpsprogram har inte hjälpt guldkursen. FED fortsätter att pumpa in smått otroliga $85 miljarder USD och håller räntan låg.
- Riskaptiten är fortsatt hög varför mycket guld säljs av för inslussning i aktiemarknaden.
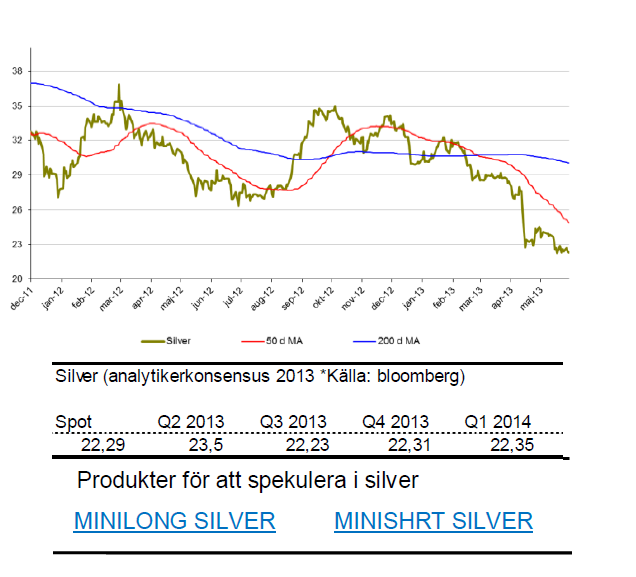
Silver
- Som jag skrev i min krönika följer silver guld slaviskt.
- För maj månad är silver ned dryga 8 % och för året är silver ned 25 %.
- Likt guld tar silver stryk av att riskaptiten fortsatt är hög och behovet av en ”säker hamn” är svalt.
- Silver har den senaste tiden testat stödet vid $22. Intressant nivå att bevaka den närmsta tiden.
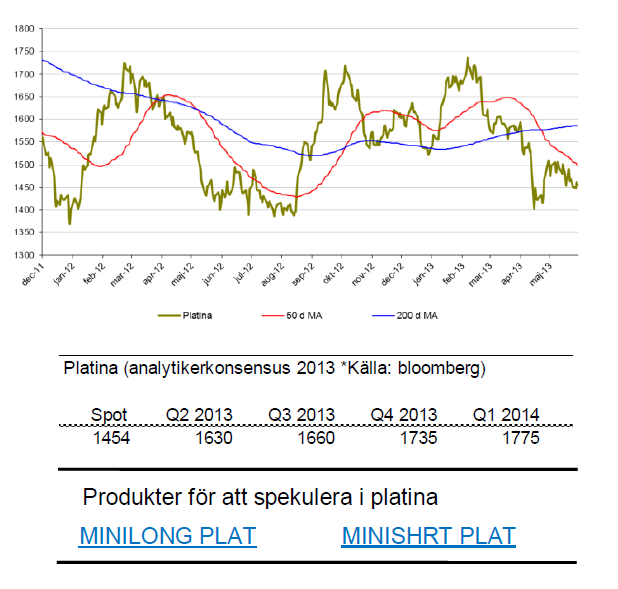
Platina
- Platina fortsätter att prisa högre än guld. Under maj är priset på platina ned knappa 3 %.
- För året är platina ned knappa 4 %.
- Till skillnad från guld och silver drivs platina till största del av industriell efterfrågan. Bilindustrin (autokatalysatorer) går knackigt vilket trycker ner platina.
- Spekulanter ligger i övervikt i korta positioner vilket kan tala för en fortsatt nedgång.
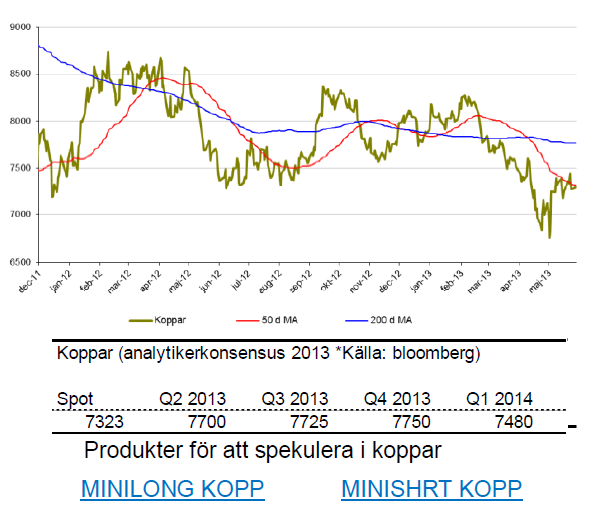
Koppar
- Under maj ökade koppar med 4 %. För året är dock koppar ned dryga 8 %.
- Rapporter om sämre kinesisk tillväxt pressar priset nedåt.
- Under maj månad kan vi dock ha sett ett trendskifte.
- FED flaggar för att ekonomin återhämtar sig vilket kan hjälpa kopparn. Dessutom har två ras i stora gruvor skapat ett litet stopp i produktionsledet vilket drar ned tillgången.
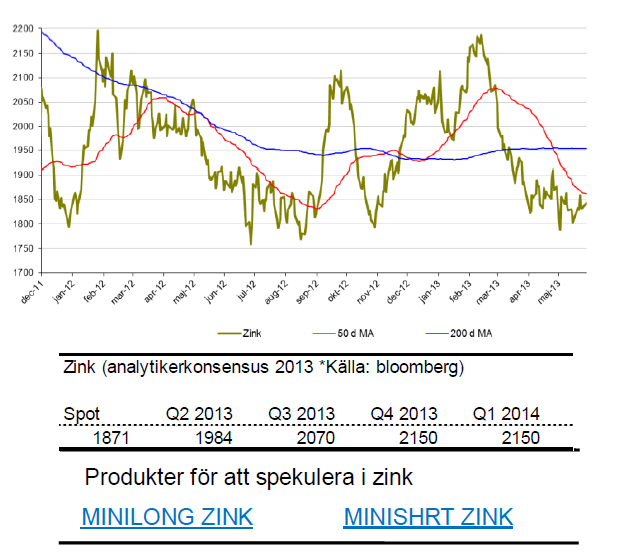
Zink
- Utsikten för basmetaller har ljusnat något. Under maj är zink oförändrat vilket är bra med tanke på att zink tappat 9 %.
- Motståndet kring $1800 har visat sig hålla och likt koppar kan ett trendskifte var på gång. Rekyler värda att bevaka.
- Ytterligare fakta som talar för en vändning är att lagren av zink nu är de lägsta på tre år.
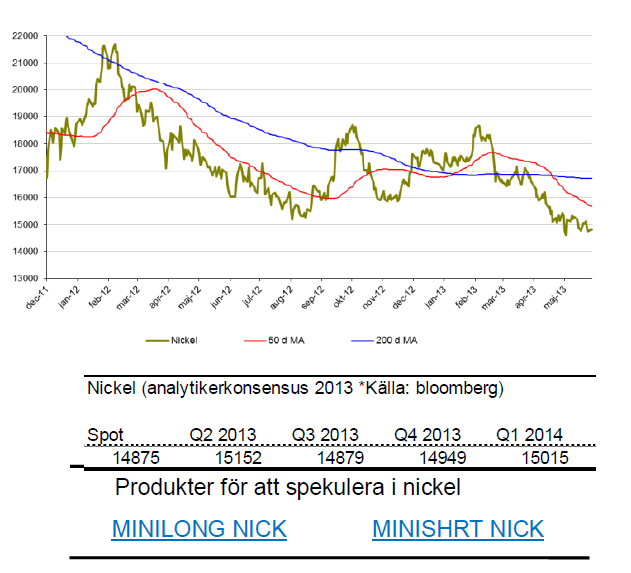
Nickel
- För nickel går det tyngre. Ett dödskors i april kan mycket väl vara starten på fortsatt nedgång.
- Nickel är för året ned drygt 14 %.
- Under maj tappade nickel nästan 3 %.
- Nickel presterade sämst av alla basmetaller under 2012. Slutsiffran blev -8 % för 2012.
- Nickelmarknaden är fortsatt mättad med ökande lager.
- Många stora projekt inom nickelproduktion är redan finansierade och irreversibla vilket kommer att öka tillgången av nickel ytterligare.
Råvaror – Jordbruk
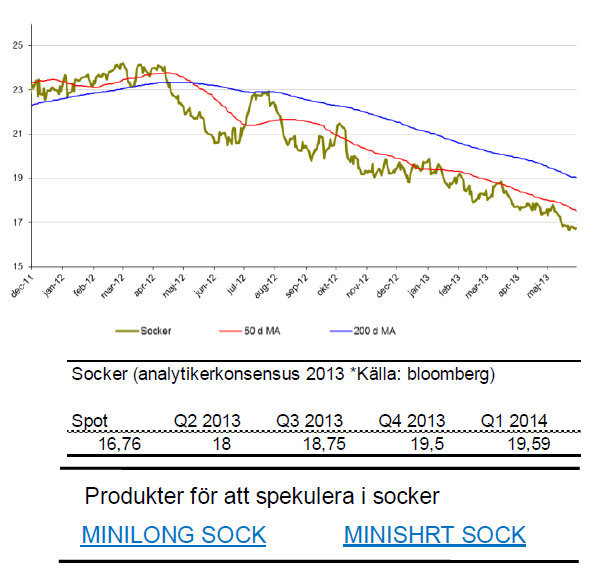
Socker
- Sockers kräftgång fortsätter. Sedan oktober förra året är sockerpriset ned 23 %.
- För året är sockerpriset ned drygt 14 % och maj var inte bättre. Ned 5 %.
- En anledning till det fortsatta prisfallet är att nuvarande nivåer inte motiverar sockerproduktion. Andra grödor eller etanol ses som mer attraktiva.
- Socker har befunnit sig i en negativ trend i snart 2 år. Det är fortfarande långt ned till bottennivåerna där det återigen blir attraktivt för ett köp.
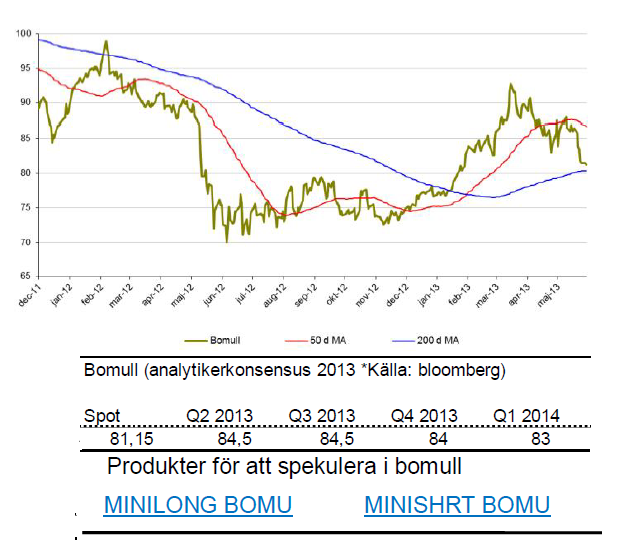
Bomull
- Bomullspriset utvecklades starkt under början av 2013. Nu har dock priset fallit sedan i mars och trenden börjar så smått peka nedåt.
- För året är priset på bomull upp 7,8 %.
- Sedan toppen i mars är dock bomull ned med 12 % vilket visar att säljarna återigen kopplat greppet. Även i maj har de haft kontrollen. Bomull tappade i maj 5 %.
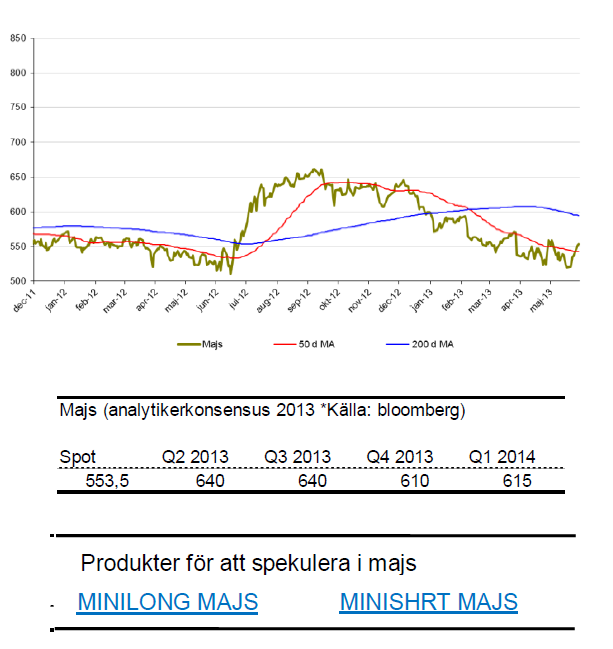
Majs
- Sedan förra sommarens kraftiga uppgång till följd av dålig skörd har majs befunnit sig i en negativ trend.
- För året har majs tappat 4 %.
- Under maj månad tappade majs knappa 3 %.
- För många spannmål väntas goda eller mycket goda skördar vilket kan trycka ned priset ytterligare.
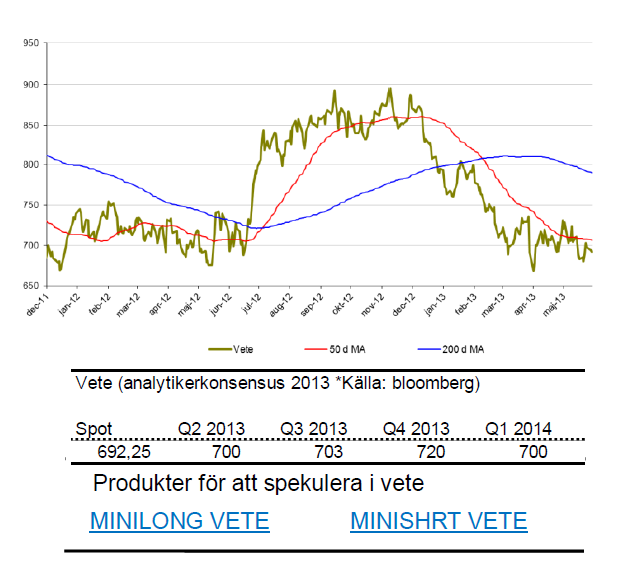
Vete
- För vete gäller samma sak. Sedan förra sommarens topp är trenden negativ.
- God skörd väntas även här så försiktighet gäller.
- För året är vete ned 11 %.
- Under maj är priset på vete ned något.
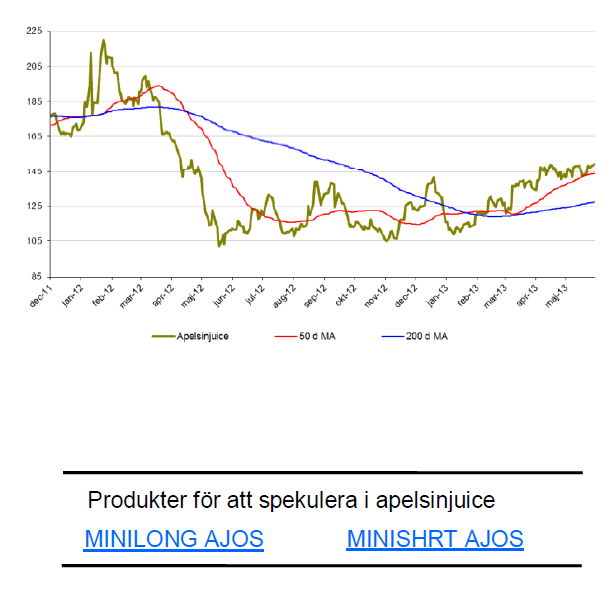
Apelsinjuice
- Vi har länge bevakat apelsinjuice i Tradingklubben.
- För året är apelsinjuice upp 20 %.
- I maj är priset upp 5 %.
- Floridas citrusodlare brottas just nu med det allvarligaste hotet det någonsin stått inför, en bakteriell sjukdom utan botemedel som har smittat samtliga de 31 länen i vilka det odlas apelsiner och citroner.
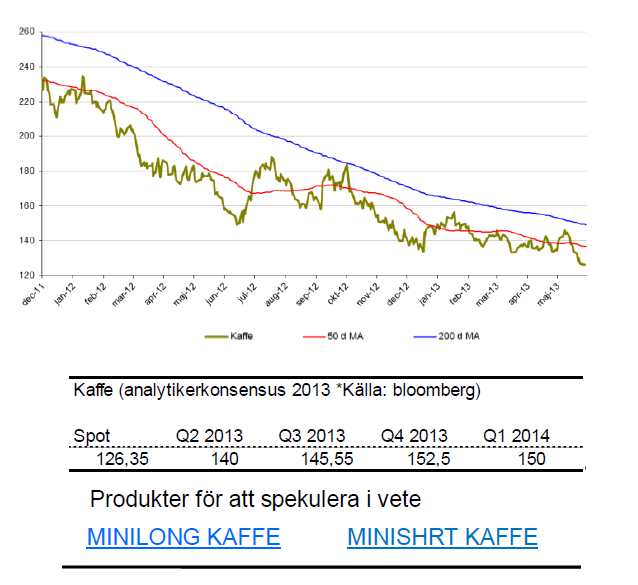
Kaffe
- Kaffe ligger fortfarande i en långsiktigt nedåtgående trend.
- För året är kaffe ned 13 %. I maj stannade nedgången på hela 11 %
- Likt apelsinjuice kämpar dock odlare med sjukdomar. Något som kanske kan vända trenden.
- Växtsjukdomen Roya, också känt som kafferost eller kaffebladssvamp, är en liten orangefärgad svamp som nu har nått Centralamerika.
[box]Denna uppdatering är producerat av SIP Nordic och publiceras i samarbete och med tillstånd på Råvarumarknaden.se[/box]
Ansvarsbegränsning
Detta produktblad utgör endast marknadsföring och har sammanställts av SIP Nordic Fondkommission AB.
Innehållet ger inte fullständig information avseende det finansiella instrumentet. Investerare uppmanas att del av prospekt och slutliga villkor, vilka finns tillgängliga på: www.rbsbank.se/markets, innan ett investeringsbeslut tas.
Förekommande exempel är simulerade och baseras på SIP Nordics egna beräkningar och antaganden, en person som använder andra data eller antaganden kan nå andra resultat. Administrativa avgifter och transaktionsavgifter påverkar den faktiska avkastningen.

Selling down on a ”deal”. Brent crude fell 6.2% last week with accelerated weakness towards the end of the week. Close of the week at $87.33/b and low of the week (and on Friday) of $85.8/b. Brent is falling another 4% this morning to $83.7/b on confirmation by Iran that a MoU text has been reached and that it will be signed on Friday this week.

So what is this ”deal” worth? Talk on the desk here this morning is that it is much like ”putting lipstick on a pig” where Trump has to sell this at home as a victory where ”the SoH has reopened”, the nuclear issue will be ironed out over the coming 60 days (or maybe 600 days?) and US consumers are getting a lower gasoline price and maybe US republicans survives the midterm elections.
The importance for Iran is that it emerges as the defacto winner of this war in the eyes of the non-US public world. That Iran now onwards is the ”ruler of the SoH” (combo of geography and new weapons systems like drones) or more softer: ”the guarantor of safe passage through the SoH”.
Iran doesn’t need nuclear weapons any more. Nuclear deterrence doesn’t work any more. Ukraine has made many attacks deep into Russia without being nuked in return. Plenty of Iranian ballistic rockets blasts over Israel but Iran wasn’t nuked in return.
There is no trust between the US and Iran. We don’t know all the details yet of the MoU. But what we do know is that there is no trust between the US and Iran what so ever. This is probably more like a descriptive text on how they can cooperate in a way where both sides keeps tactical leverage. Neither side makes irreversible concessions. Violations can be punished quickly. Cooperation produces immediate benefits.
This is a fragile structure. It can easily break down. There may be details which cannot be overcome. To be seen on Friday. The US has to show that it is willing put enough force behind managing and restraining Israel versus Hezbollah in Lebanon. We have seen that Netanyahu hasn’t listened all that much to Trump’s directives and wishes. This could be a major obstacle.
A gradual reopening is tactically preferable for Iran. A tactical leverage for Iran right now is that global oil stocks have been drawn down towards painful and increasingly dangerous levels with increasing risks for oil price spikes in mid-July to August. This together with US midterm elections on 3 November gives tactical leverage to Iran. Iran probably doesn’t want to fully give up on that leverage. A rapid, full reopening where global stocks are able to refill over the coming 60 days will significantly erode that leverage. If Iran reinstates a closure of the SoH after 60 days (if talks break down again), then the effect won’t be that impactful in terms of prices and the US midterm elections.
So a gradual and partial reopening where global markets gets the oil they need while they are unable to rebuild stocks could be a practical middle way for both parties. Trump can sell it as ”the SoH has reopened” and get affordable gasoline for US consumers. Iran can sell it as ”the SoH has fully reopened, but there is some friction” so flow is only 60-80% of normal.
Not much real demand destruction below $100/b. What we do know is that there is not much real price pain demand destruction for oil globally at an oil price below $100/b. A lot of demand-shock destruction. Fear. But demand should now come roaring back towards normal with fear for exceptionally high prices now is rapidly receding.
Sudden China demand destruction due to EVs? Bullocks. EV share of total Chinese carpool now around 13%. Share of new sales of EVs has reached 50%. This is a very gradual process. It doesn’t make oil demand fall like a rock over night. When EV new sales share reaches 100%, then the gasoline car pool will contract by some 5-10% per year. But that is only gasoline. Sudden reduction in Chinese oil demand is more about shock and risk.
Chinese crude oil imports will come roaring back. At what price? Today’s ”neutral” oil price is $70/b. That is the five year price which has steadily traded around the $70/b mark over the past 3-4 years. With still a risky picture one would think that China and the rest of the world will be big buyers of oil in the range of $70-85/b.
Global demand will likely snap back towards normal, forecasted demand and growth at such prices.
Physical reopening is a gradual process. The physical and practical reopening of the SoH will likely be gradual rather than sudden. And that probably suites Iran tactically as well.
Brent M1 price versus the Brent 5-yr (today’s ”normal” price)

Market is starting to take US/Iran headlines with a pinch of salt. Brent crude rose $2.8/b yesterday to an official close of $112.1/b. But after that it traded as low as $108.05/b before ending late night at around $109.7/b. Through the day it traded in a range of $106.87 – 112.72/b amid a flurry of news or rumors from Iran and the US. ”US temporary sanctions during negotiations” (falls alarm). ”We will bomb Iran” (not anyhow),… etc. While the market is still fluctuating to this kind of news flow, it is starting to take such headlines with a pinch of salt.
We’ll see. Maybe, maybe not. The Brent M1 contract is trading at $110.2/b this morning which very close to the average ticks through yesterday of $110.4/b.
Trump with bearish, verbal intervention whenever Brent trades above $110/b it seems. What seems to be a pattern is that Trump states something like ”very good negotiations going on with Iran”, ”New leaders in Iran are great,..”, ”Great progress in negotiations,…”, ”Deal in sight,..” etc whenever the Brent M1 contract trades above $110/b. An effort to cool the market. These hot air verbal interventions from Trump used to have a heavy bearish impact on prices, but they now seems to have less and less effect unless they are backed by reality.
As far as we can see there has been no real progress in the negotiations between the US and Iran with both sides still standing by their previous demands.
Iran is getting stronger while the cease fire lasts making a return to war for Trump yet harder. Iran is naturally in constant preparation for a return to war given Trump’s steady threats of bombing Iran again. Iran is naturally doing what ever is possible to prepare for a return to war. And every day the cease fire lasts it is better prepared. This naturally makes it more and more difficult and dangerous for the US to return to warring activity versus Iran as the consequences for energy infrastructure in the Persian Gulf will be more and more severe the longer the cease fire lasts. Israel seems to see it this way as well. That the war is not won and that current frozen state of a cease fire gives Iran opportunity to rebuild military and politically.
Global inventories are drawing down day by day. How much? In the meantime the Strait of Hormuz stays closed. There is varying measures and estimates of how much global inventories are drawing down. Our rough estimate, back of the envelope, is that global inventories are drawing down by at least some 10 mb/d or about 300 mb/d in a balance between loss of supply versus demand destruction. Other estimates we see are a monthly draw of 250-270 mb/d. The IEA only ’measured’ a draw in global observable stocks of 117 mb in April with oil on water rising 53 mb while on shore stocks fell 170 mb. But global stocks are hard to measure with large invisible, unmeasured stocks. As such a back of the envelope approach may be better.
Oil products is what the world is consuming. Oil product prices likely to rise while product stocks fall. Strategic Petroleum Reserves (SPR) are predominantly crude oil. Discharging oil from OECD SPR stocks, a sharp reduction in Chinese crude imports and a reduction in global refinery throughput of 6-7 mb/d has helped to keep crude oil markets satisfactorily supplied. But global inventories are drawing down none the less. And oil products is really what the world is consuming. So if global refinery throughput stays subdued, then demand will eventually have to match the supply of oil products. The likely path forward this summer is a steady draw down in jet fuel, diesel and gasoline. Higher prices for these. Then, if possible, higher refinery throughput and higher usage of crude in response to very profitable refinery margins. And lastly sharper draw in crude stocks and higher prices for these. But some 6 mb/d of oil products used to be exported through the Strait of Hormuz. And it may not be so easy to ramp up refinery activity across the world to compensate. Especially as Ukraine continues to damage Russian refineries as well as Russian crude production and export facilities.
Watch oil product stocks and prices as well as Brent calendar 2027. What to watch for this summer is thus oil product inventories falling and oil product premiums to crude rising. Another measure to watch is the Brent crude 2027 contract as it rises steadily day by day as the Strait of Hormuz stays closed and global oil inventories decline. The latter is close to the highest level since the start of the war and keeps rising.
The Brent M1 contract and the Brent 2027 prices and current price of jet fuel in Europe (ARA). All in USD/b

Our back of the envelope calculation of the global shortage created by the closure of the Strait of Hormuz. Note that 3.5 mb/d of discharge from SPR is also a draw. Note also that ’Forced demand loss’ of 2.5 mb/d is probably temporary and will fall back towards zero as logistics are sorted out leaving ’Price demand loss’ to do the job of balancing the market. Thus a shortfall of at least 9 mb/d created by the closure. More if SPR discharge is included and more if Forced demand loss recedes.

Brent is climbing higher. Front-month is at USD 106.3/bl this morning, close to a weekly high and a USD 9/bl jump from Mondays open. This is the move we flagged as a risk earlier in the week: the market shifting from ”a deal is around the corner” to ”this is going to take longer than we thought”.

Analyst Commodities, SEB
During April, rest-of-year Brent remained remarkably stable around USD 90/bl. A stability which rested on one single assumption: the SoH reopens around 1 May. That assumption is now slowly falling apart.
As we highlighted yesterday: every week of delay beyond 1 May adds (theoretically) ish USD 5/bl to the rest-of-year average, as global inventories draw 100 million barrels per week. i.e., a mid-May reopening implies rest-of-year Brent closer to USD 100/bl, and anything pushing into June or July takes us meaningfully higher.
What’s changed in the last 48 hours:
#1: The US military has formally warned that clearing suspected sea mines from SoH could take up to six months. That is a completely different timescale from what the financial market is pricing. Even a political deal tomorrow does not immediately reopen the strait.
#2: Trump has shifted his tone from urgency to ”strategic patience”. In yesterday’s press conference: ”Don’t rush me… I want a great deal.” The market is reading this as a president no longer feeling pressured by timelines, with the naval blockade running in the background.
#3: So far, the military activity is escalating, not de-escalating. Axios reports Iran is laying more mines in SoH. The US 3rd carrier strike group (USS George H.W. Bush) is arriving with two countermine vessels. Trump yesterday ordered the US Navy to destroy any Iranian boats caught laying mines. While CNN reports that the Pentagon is actively drawing up plans to strike Iranian SoH capabilities and individual Iranian military leaders if the ceasefire collapses. i.e., NOT a attitude consistent with an imminent deal!
Spot crude and product prices eased off the early-April highs on a combination of system rerouting and deal optimism. Both now weakening. Goldman estimates April Gulf output is reduced by 14.5 mbl/d, or 57% of pre-war supply, a number that keeps getting worse the longer this drags on.
Demand-side adaptation is ongoing: S. Korea has cut its Middle East crude dependence from 69% to 56% by pulling more from the Americas and Africa, and Japan is kicking off a second round of SPR releases from 1 May. But SPRs are finite.
Ref. to the negotiations, we should not bet on speed. The current Iranian leadership is dominated by genuine hardliners willing to absorb economic pain and run the clock to extract concessions. That is not a setup for a rapid resolution. US/Israeli media briefings keep framing the delay as ”internal Iranian divisions”, the reality is more complicated and points toward weeks and months, not days.
Our point is that the complexity is large, and higher prices have only just started (given a scenario where the negotiations drag out in time). The market spent April leaning on the USD 90/bl rest-of-year assumption; that case is diminishing by the hour. If ”early May reopening” is replaced by ”June, July or later” over the next week or two, both crude and products have meaningful room to reprice higher from here. There is a high risk being short energy and betting on any immediate political resolution(!).


Vattenfalls och Industrikrafts kärnkraftsbolag Videberg Kraft har valt Rolls-Royce SMR
Selling down on a ”deal”

Sommarväder skapar prisrally på elbörsen
Oil product price pain is set to rise as the Strait of Hormuz stays closed into summer

Solkraften pressar elpriserna dagtid
Oil product price pain is set to rise as the Strait of Hormuz stays closed into summer
Sommarväder skapar prisrally på elbörsen
Vattenfalls och Industrikrafts kärnkraftsbolag Videberg Kraft har valt Rolls-Royce SMR
Selling down on a ”deal”
-
Analys4 veckor sedan
Oil product price pain is set to rise as the Strait of Hormuz stays closed into summer
-
Nyheter2 veckor sedan
Sommarväder skapar prisrally på elbörsen
-
 Nyheter2 dagar sedan
Vattenfalls och Industrikrafts kärnkraftsbolag Videberg Kraft har valt Rolls-Royce SMR
-
Analys2 dagar sedan
Selling down on a ”deal”