

Analys
SIP Nordic – Råvaruguiden – januari 2013
 Timing viktigare än någonsin
Tiden går som vanligt alldeles för fort och det känns som igår jag skrev den första råvaruguiden (jan-12). Samtidigt som det är dags att summera ett ljummet råvaruår är det hög tid att rikta blickarna mot 2013 års spåkula. Fortsätter guldet mot ett positivt år för 14:e året i rad, fortsätter jordbruksråvarornas kräftgång och kommer vi att se olja klättra upp mot höga nivåer? Oavsett vad har vi ett spännande år framför oss där börserna under 2012 presterade bra trots oron för en Eurokris. 2013 blir spännande där mycket fokus kommer ligga kring USAs budgetstup och evigt växande budgetunderskott. Något som på alla vis kommer påverka råvarorna. Men var beredda på en tur i berg- och dalbanan. 2013 kan för råvaror bli mycket lik 2012 där timing är A och O.
Jag skrev i min första råvaruguide att jag inför 2012 trodde på platina och guld. Guld och platina ökade under 2013 med 5 respektive 9 %. En bra avkastning under rådande marknadsförhållanden men faktum är att man med rätt timing och aktiv börshandel hade kunna mångdubblat dessa siffror.
De flesta råvaror pendlade kraftigt under 2012 där vi såg en bred uppgång i början av året vilket snabbt byttes mot en negativ trend fram till slutet av sommaren. Då var det återigen dags för FED att sätta igång sedelpressarna vilket drev råvarupriserna uppåt igen. Guld var inget undantag. Faktum är att den aktive handlaren hade kunnat ha en avkastning på över 80 % om denna köpt och sålt guld vid rätt tillfälle.
Nu är det ju alltid enkelt i efterhand att säga hur man borde ha gjort men jag tror faktiskt att vi får se ett liknande scenario under 2013.
Mycket av nyhetsflödet kommer i år att vara kring USAs budgetstup och det växande budgetunderskottet. Nu verkar det som att den kortsiktiga krisen är bortblåst. Något som får råvaror att rusa. Problemet kvarstår dock och om två månader måste frågorna kring USA budgetunderskott lösas. Något som hotar USAs kreditbetyg och som på många sätt kan påverka priset på råvaror. Framförallt guld, silver och olja.
2013 kommer således bli ett spännande råvaruår där bra avkastning finns att hämta. Det är dock viktigare än någonsin att ha rätt timing.
Personligen tror jag att guld kommer att fortsätta upp under 2013. USA kan mycket väl tvingas sätta igång fler stimulanspaket vilket är positivt för guldet. För den aktive med rätt timing kan guld bli en riktig vinnare under 2013.
Alexander Frick
Råvaror – Energi
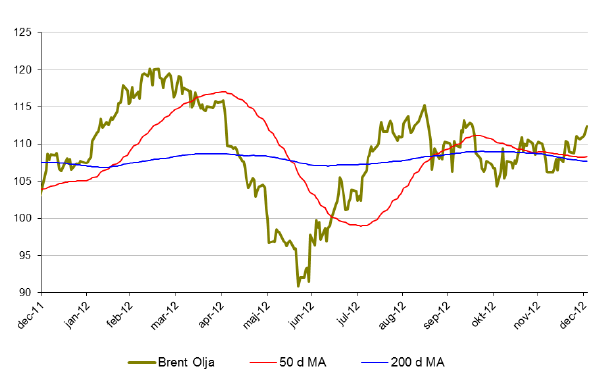
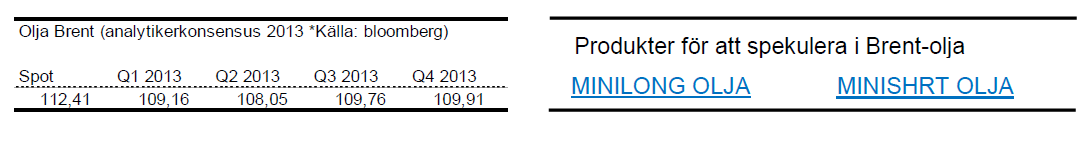
Brent olja
- Brentoljan åkte under 2012 berg och dalbana. Brent gick under 2012 upp dryga 2 %.
- Under december månad ökade priset på brent med cirka 1,6 %.
- Brent påverkades mycket av de ekonomiska oroligheterna under 2012. Något som mycket väl kan fortsätta under 2013. Stora svängningar är alltså att vänta.
- Monetära stimulanser sätter dollarn under press vilket hjälper oljan att stanna på höga nivåer.
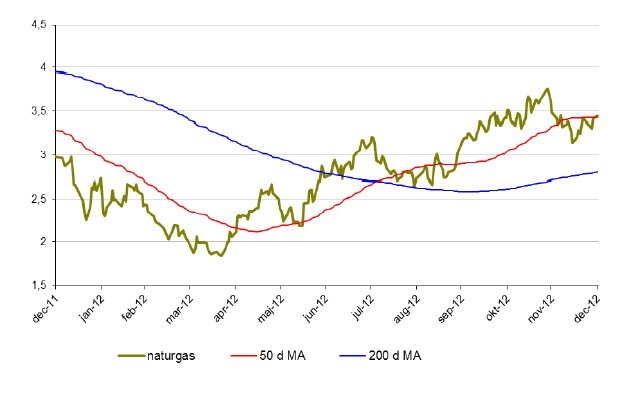
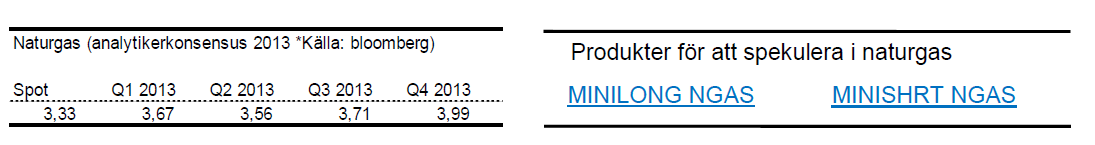
Naturgas
- Från i mitten av april hade Naturgas en mycket stark period under 2012. Sedan botten i april klättrade priset på naturgas med nästan 80 % och avslutade året på cirka 10 % upp.
- Under december föll priset på naturgas med 10 %
- Efter den starka trenden är det inte osannolikt att naturgas börjar tappa i fart. Naturgas handlas nu strax under 50-dagars medelvärde.
Råvaror – Metaller
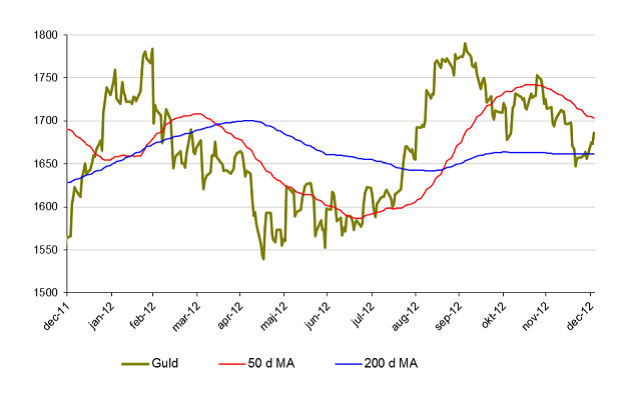
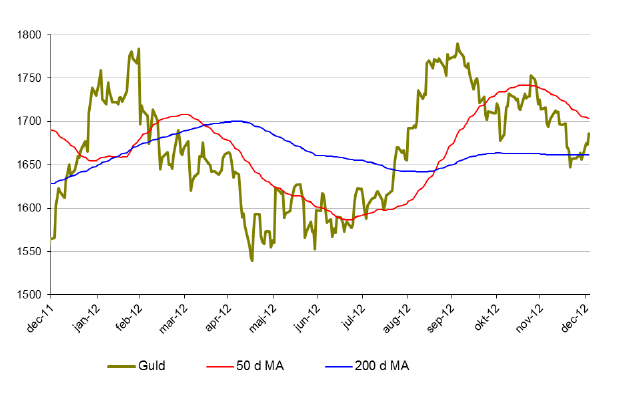
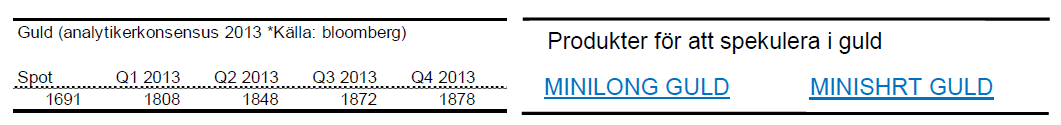
Guld
- Guld stängde på en positiv siffra 2012 vilket var det 13:e året i rad med positiv utveckling!
- Guld pendlade likt olja kraftigt av samma anledningar. Ekonomiska oroligheter och stimulanspaket satte guldet i pendling.
- Under 2012 ökade priset på guld med ca 5 %.
- I december tappade guld dock nästan 4 %.
- För den aktive börshandlaren finns stora pengar att tjäna då guldpriset med stor sannolikhet kommer att pendla en del under 2013.
- Den amerikanska penningpolitiken styr till stor del det mesta.
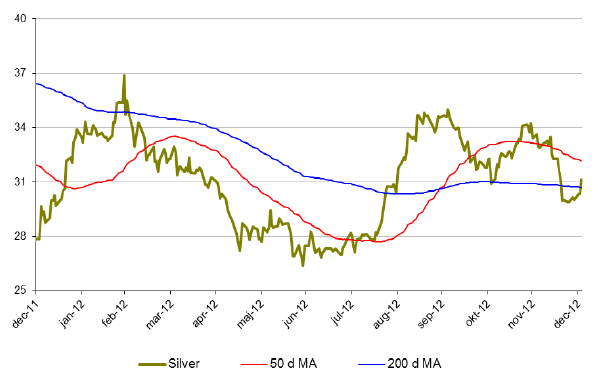
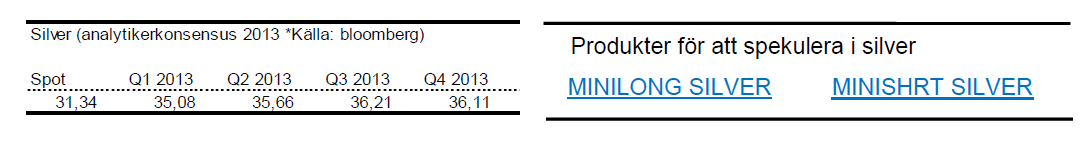
Silver
- Silver hade även ett positivt år 2012. Än dock med kraftiga svängningar. För året var silver upp dryga 6 %.
- December månad var dock lite mer mörk då silver föll nästan 12 %.
- Silver handlas strax ovanför 200 dagars medelvärde men befinner sig i en kortsiktigt negativ trend.
- Viktiga nivåer hittar vi kring 27 dollar där vi har en viktig motståndszon.
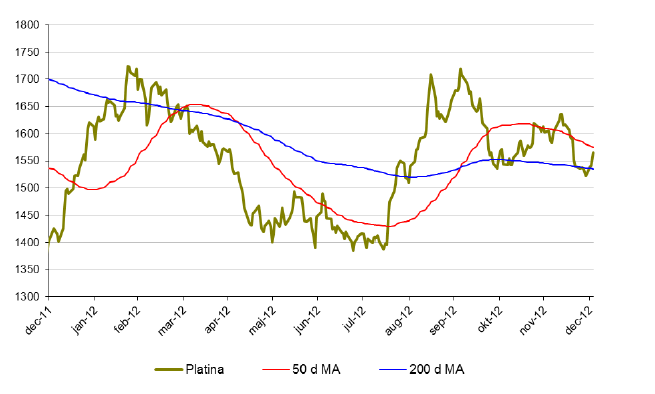
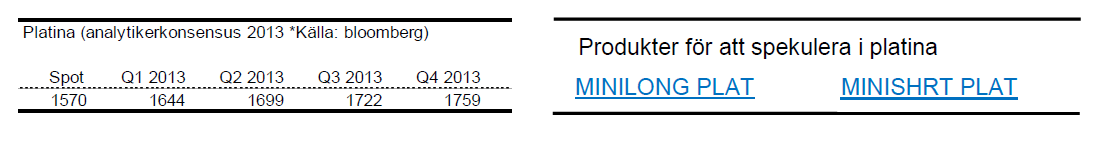
Platina
- Platina var inget undantag under 2012. Platina ökade med cirka 9 % under 2012.
- Platina handlas dock till ett lägre pris än guld. Något som historiskt sett varit det motsatta.
- Under december föll priset på platina med 4 %.
- Platina befinner sig i en negativ trend där 50 dagars glidande medelvärde på 1650 blir intressant att observera under januari.
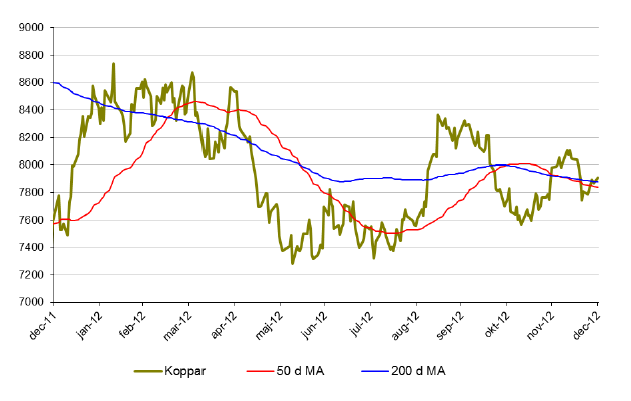
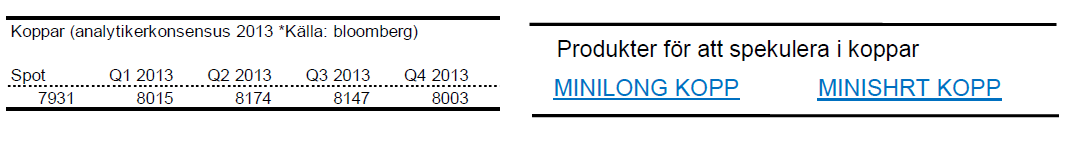
Koppar
- Metallerna svingade rejält under 2012 och koppar är inget undantag. Trots att koppar avslutade året på cirka 2,7 % upp är det ändå nästan 10 % under årets högstanivå.
- Under december föll priset på koppar med 0,6 %
- Koppar handlas just nu över både 50 och 200 dagars medelvärde men i en negativ trend. 50 dagars medelvärde korsade även 200 dagars medelvärde ovanifrån början av december.
- Tillväxtländernas förbrukning kommer styra mycket under 2013.
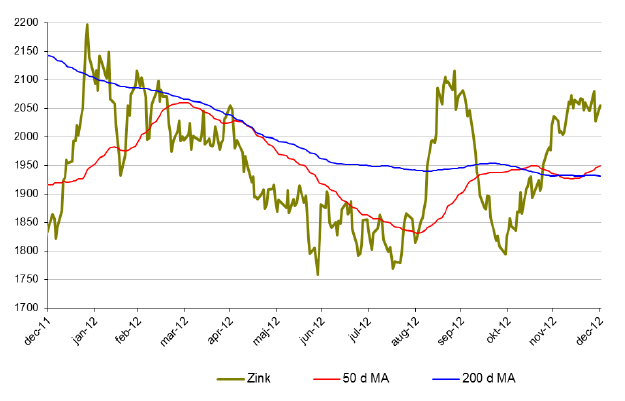
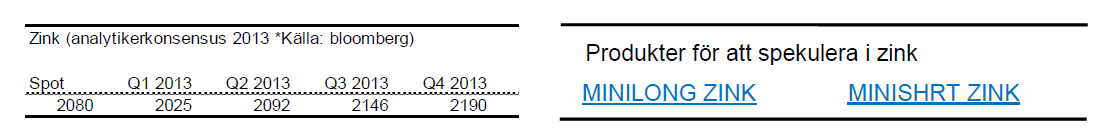
Zink
- Zink hade ett bra 2012. Upp drygt 12 %.
- Under december månad ökade priset något.
- Zink närmar sig nu viktiga nivåer kring 2100-2150 där vi har en rad motståndsnivåer. Blir intressant att följa under 2013.
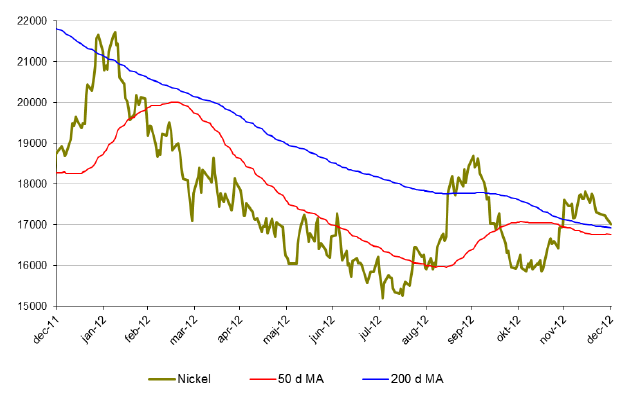
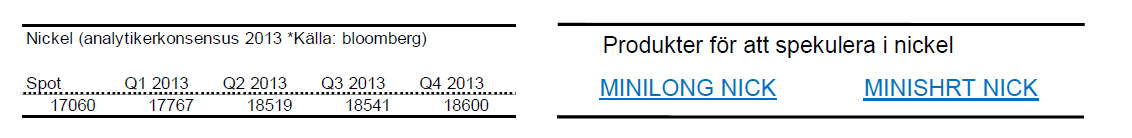
Nickel
- Nickel presterade sämst av alla basmetaller under 2011. 2012 blev inte bättre. Slutsiffran blev -8 % för 2012.
- Under december var priset på zink oförändrat.
- Nickelmarknaden är fortsatt mättad med ökande lager.
- Många stora projekt inom nickelproduktion är redan finansierade och irreversibla vilket kommer att öka tillgången av nickel ytterligare.
Råvaror – Jordbruk
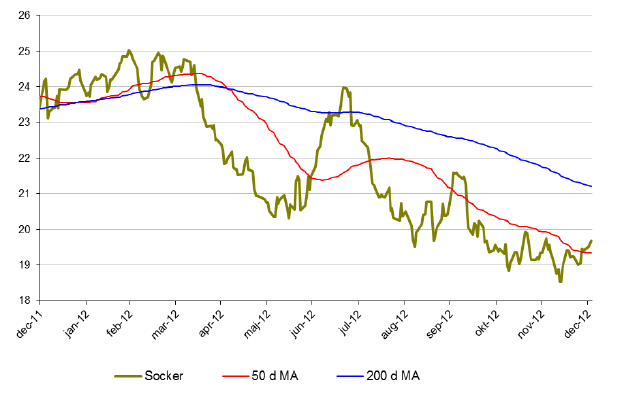
Socker
- Socker hade inget roligt 2012 med en slutsiffra på nästa -20 %.
- Under december månad är dock socker upp drygt 2 %. Kanske vänder den negativa trenden här.
- Socker föll under december igenom ett viktigt motståndsområde kring 19 cents. Nu har denna nivå brutits och det ser lite mer positivt ut.

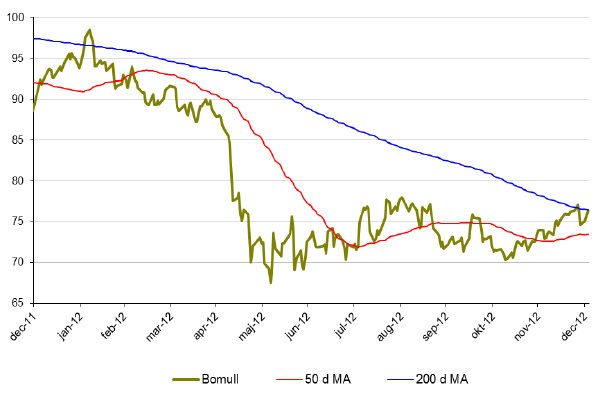
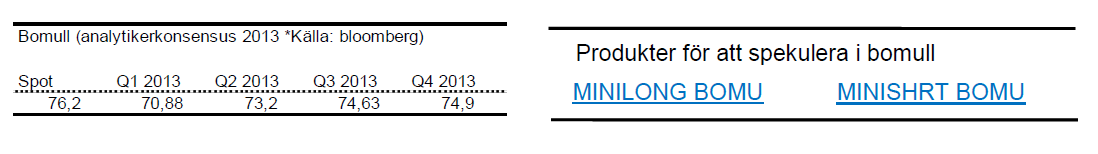
Bomull
- Bomull och socker gick hand i hand under 2012. Bomullspriset föll med cirka 20 % under 2012.
- Under december månad ökade priset på bomull dryga 4 %.
- Svag kinesisk och indisk efterfrågan samt lägre ekonomisk tillväxt i Europa har lett till ökade lager. Monetära stimulanspaket kan ge en uppsving för konjunkturen och därmed öka bomullskonsumtionen.
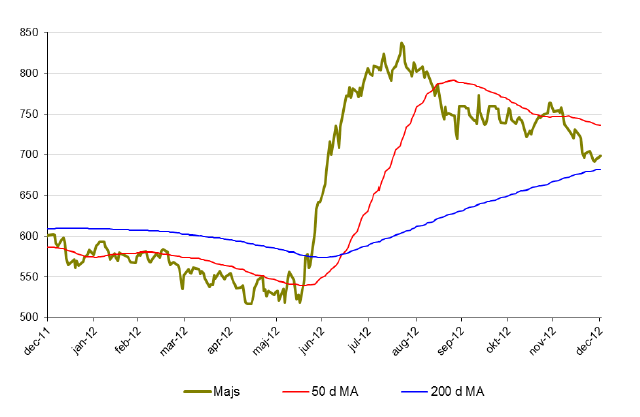
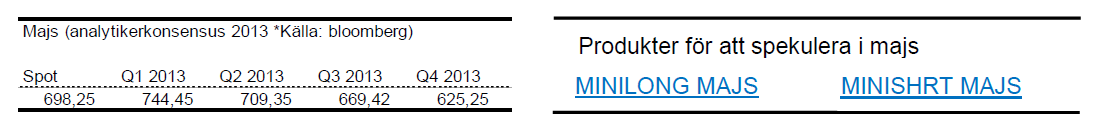
Majs
- Efter den kraftiga uppgången under sommaren 2012 föll priset på majs tillbaka men året avlutades på knappa 8 % upp.
- Under sommaren rådde extrem torka i USA vilket fick priset på majs att skjuta i höjden. Endast 40 % av skörden var av god kvalitet. Att jämföra med 70 % i normala fall.
- Under december månad föll priset på majs med 8 %.
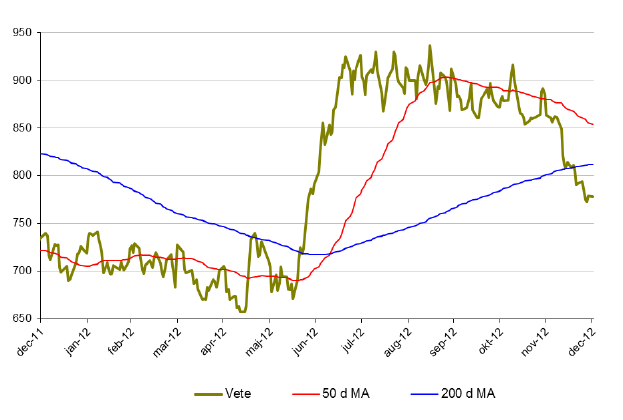
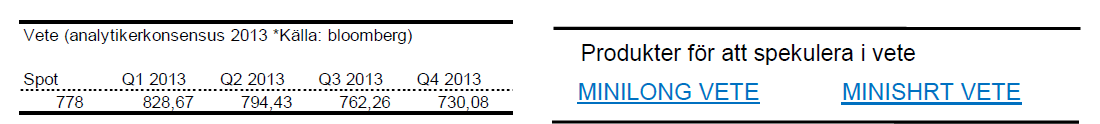
Vete
- Då majsproduktionen drabbades av den värsta torkan på många år gick fler producenter över till produktion av vete vilket fick priset att skjuta i höjden under mitten av 2012. Likt majs föll vete tillbaka under andra halvan av året. Slutligen hamnade vete på +6 % för året.
- Under december föll vete med drygt 8 %.
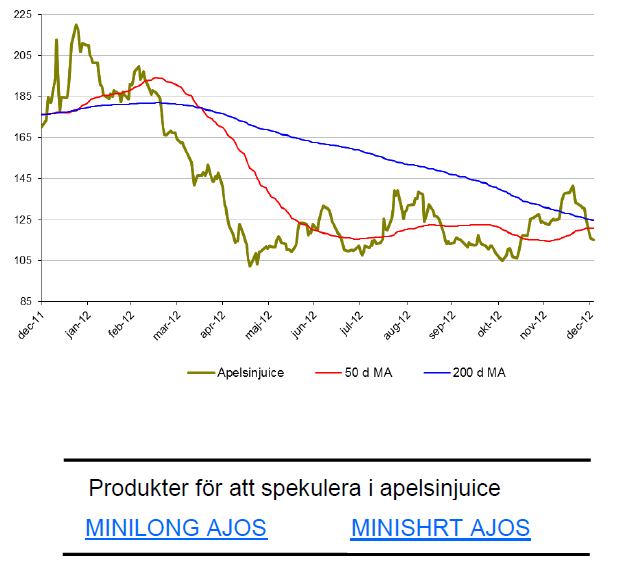
Apelsinjuice
- Den som låg kort apelsinjuice under 2012 har gjort en mycket bra affär. För året föll apelsinjuice drygt 28 %.
- Under december föll apelsinjuice med ytterligare 6 %.
- Priset på apelsinjuice är fortfarande 70 % högre än botten 2009. Fallhöjden är således hög. Mycket hög.
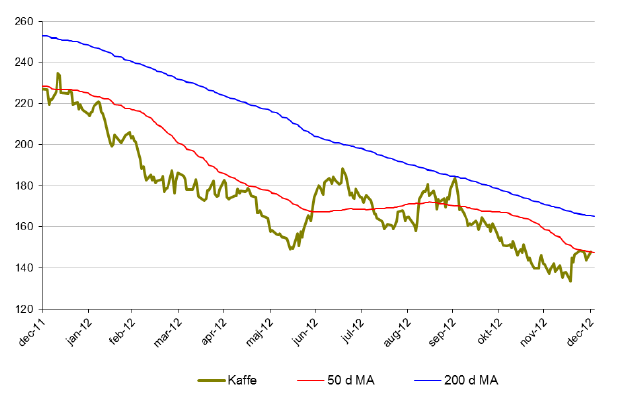
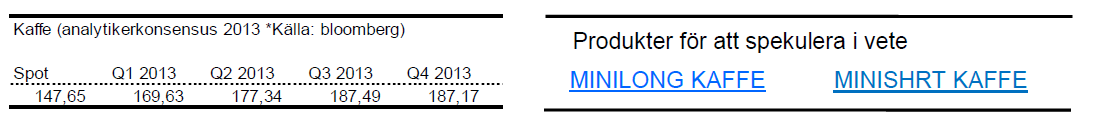
Kaffe
- För första gången är kaffe med i Råvaruguiden. Kaffe hade likt de andra jordbruksmetallerna ett svagt 2012. För året tappade kaffe 35 %.
- Kaffe gick under december upp 3,6 % vilket kan vara början på ett trendbrott.
- Om kaffe lyckas bryta upp över 50 dagars glidande medelvärde kan vi få ett trendskifte.
- Kaffe ligger dock fortfarande i en långsiktigt nedåtgående trend.
[box]Denna uppdatering är producerat av SIP Nordic och publiceras i samarbete och med tillstånd på Råvarumarknaden.se[/box]
Ansvarsbegränsning
Detta produktblad utgör endast marknadsföring och har sammanställts av SIP Nordic Fondkommission AB.
Innehållet ger inte fullständig information avseende det finansiella instrumentet. Investerare uppmanas att del av prospekt och slutliga villkor, vilka finns tillgängliga på: www.rbsbank.se/markets, innan ett investeringsbeslut tas.
Förekommande exempel är simulerade och baseras på SIP Nordics egna beräkningar och antaganden, en person som använder andra data eller antaganden kan nå andra resultat. Administrativa avgifter och transaktionsavgifter påverkar den faktiska avkastningen.


Brent crude is essentially flat on the week, but after a volatile ride. Prices started Monday near USD 65.5/bl, climbed steadily to a mid-week high of USD 67.8/bl on Wednesday evening, before falling sharply – losing about USD 2/bl during Thursday’s session.

Brent is currently trading around USD 65.8/bl, right back where it began. The volatility reflects the market’s ongoing struggle to balance growing surplus risks against persistent geopolitical uncertainty and resilient refined product margins. Thursday’s slide snapped a three-day rally and came largely in response to a string of bearish signals, most notably from the IEA’s updated short-term outlook.
The IEA now projects record global oversupply in 2026, reinforcing concerns flagged earlier by the U.S. EIA, which already sees inventories building this quarter. The forecast comes just days after OPEC+ confirmed it will continue returning idle barrels to the market in October – albeit at a slower pace of +137,000 bl/d. While modest, the move underscores a steady push to reclaim market share and adds to supply-side pressure into year-end.
Thursday’s price drop also followed geopolitical incidences: Israeli airstrikes reportedly targeted Hamas leadership in Doha, while Russian drones crossed into Polish airspace – events that initially sent crude higher as traders covered short positions.
Yet, sentiment remains broadly cautious. Strong refining margins and low inventories at key pricing hubs like Europe continue to support the downside. Chinese stockpiling of discounted Russian barrels and tightness in refined product markets – especially diesel – are also lending support.
On the demand side, the IEA revised up its 2025 global demand growth forecast by 60,000 bl/d to 740,000 bl/d YoY, while leaving 2026 unchanged at 698,000 bl/d. Interestingly, the agency also signaled that its next long-term report could show global oil demand rising through 2050.
Meanwhile, OPEC offered a contrasting view in its latest Monthly Oil Market Report, maintaining expectations for a supply deficit both this year and next, even as its members raise output. The group kept its demand growth estimates for 2025 and 2026 unchanged at 1.29 million bl/d and 1.38 million bl/d, respectively.
We continue to watch whether the bearish supply outlook will outweigh geopolitical risk, and if Brent can continue to find support above USD 65/bl – a level increasingly seen as a soft floor for OPEC+ policy.
Brent crude makes some gains as Israel’s attack on Hamas in Qatar rattles markets. Brent crude spiked to a high of USD 67.38/b yesterday as Israel made a strike on Hamas in Qatar. But it wasn’t able to hold on to that level and only closed up 0.6% in the end at USD 66.39/b. This morning it is starting on the up with a gain of 0.9% at USD 67/b. Still rattled by Israel’s attack on Hamas in Qatar yesterday. Brent is getting some help on the margin this morning with Asian equities higher and copper gaining half a percent. But the dark cloud of surplus ahead is nonetheless hanging over the market with Brent trading two dollar lower than last Tuesday.

Geopolitical risk premiums in oil rarely lasts long unless actual supply disruption kicks in. While Israel’s attack on Hamas in Qatar is shocking, the geopolitical risk lifting crude oil yesterday and this morning is unlikely to last very long as such geopolitical risk premiums usually do not last long unless real disruption kicks in.
US API data yesterday indicated a US crude and product stock build last week of 3.1 mb. The US API last evening released partial US oil inventory data indicating that US crude stocks rose 1.3 mb and middle distillates rose 1.5 mb while gasoline rose 0.3 mb. In total a bit more than 3 mb increase. US crude and product stocks usually rise around 1 mb per week this time of year. So US commercial crude and product stock rose 2 mb over the past week adjusted for the seasonal norm. Official and complete data are due today at 16:30.
A 2 mb/week seasonally adj. US stock build implies a 1 – 1.4 mb/d global surplus if it is persistent. Assume that if the global oil market is running a surplus then some 20% to 30% of that surplus ends up in US commercial inventories. A 2 mb seasonally adjusted inventory build equals 286 kb/d. Divide by 0.2 to 0.3 and we get an implied global surplus of 950 kb/d to 1430 kb/d. A 2 mb/week seasonally adjusted build in US oil inventories is close to noise unless it is a persistent pattern every week.
US IEA STEO oil report: Robust surplus ahead and Brent averaging USD 51/b in 2026. The US EIA yesterday released its monthly STEO oil report. It projected a large and persistent surplus ahead. It estimates a global surplus of 2.2 m/d from September to December this year. A 2.4 mb/d surplus in Q1-26 and an average surplus for 2026 of 1.6 mb/d resulting in an average Brent crude oil price of USD 51/b next year. And that includes an assumption where OPEC crude oil production only averages 27.8 mb/d in 2026 versus 27.0 mb/d in 2024 and 28.6 mb/d in August.
Brent will feel the bear-pressure once US/OECD stocks starts visible build. In the meanwhile the oil market sits waiting for this projected surplus to materialize in US and OECD inventories. Once they visibly starts to build on a consistent basis, then Brent crude will likely quickly lose altitude. And unless some unforeseen supply disruption kicks in, it is bound to happen.
US IEA STEO September report. In total not much different than it was in January

US IEA STEO September report. US crude oil production contracting in 2026, but NGLs still growing. Close to zero net liquids growth in total.

Brent crude touched a low of USD 65.07 per barrel on Friday evening before rebounding sharply by USD 2 to USD 67.04 by mid-day Monday. The rally came despite confirmation from OPEC+ of a measured production increase starting next month. Prices have since eased slightly, down USD 0.6 to around USD 66.50 this morning, as the market evaluates the group’s policy, evolving demand signals, and rising geopolitical tension.
On Sunday, OPEC+ approved a 137,000 barrels-per-day increase in collective output beginning in October – a cautious first step in unwinding the final tranche of 1.66 million barrels per day in voluntary cuts, originally set to remain off the market through end-2026. Further adjustments will depend on ”evolving market conditions.” While the pace is modest – especially relative to prior monthly hikes – the signal is clear: OPEC+ is methodically re-entering the market with a strategic intent to reclaim lost market share, rather than defend high prices.
This shift in tone comes as Saudi Aramco also trimmed its official selling prices for Asian buyers, further reinforcing the group’s tilt toward a volume-over-price strategy. We see this as a clear message: OPEC+ intends to expand market share through steady production increases, and a lower price point – potentially below USD 65/b – may be necessary to stimulate demand and crowd out higher-cost competitors, particularly U.S. shale, where average break-evens remain around WTI USD 50/b.
Despite the policy shift, oil prices have held firm. Brent is still hovering near USD 66.50/b, supported by low U.S. and OECD inventories, where crude and product stocks remain well below seasonal norms, keeping front-month backwardation intact. Also, the low inventory levels at key pricing hubs in Europe and continued stockpiling by Chinese refiners are also lending resilience to prices. Tightness in refined product markets, especially diesel, has further underpinned this.
Geopolitical developments are also injecting a slight risk premium. Over the weekend, Russia launched its most intense air assault on Kyiv since the war began, damaging central government infrastructure. This escalation comes as the EU weighs fresh sanctions on Russian oil trade and financial institutions. Several European leaders are expected in Washington this week to coordinate on Ukraine strategy – and the prospect of tighter restrictions on Russian crude could re-emerge as a price stabilizer.
In Asia, China’s crude oil imports rose to 49.5 million tons in August, up 0.8% YoY. The rise coincides with increased Chinese interest in Russian Urals, offered at a discount during falling Indian demand. Chinese refiners appear to be capitalizing on this arbitrage while avoiding direct exposure to U.S. trade penalties.
Going forward, our attention turns to the data calendar. The EIA’s STEO is due today (Tuesday), followed by the IEA and OPEC monthly oil market reports on Thursday. With a pending supply surplus projected during the fourth quarter and into 2026, markets will dissect these updates for any changes in demand assumptions and non-OPEC supply growth. Stay tuned!


Det stigande guldpriset en utmaning för smyckesköpare

Aktier i guldbolag laggar priset på guld
Volatile but going nowhere. Brent crude circles USD 66 as market weighs surplus vs risk

Guld når sin högsta nivå någonsin, nu även justerat för inflation

Mahvie Minerals i en guldtrend

Meta bygger ett AI-datacenter på 5 GW och 2,25 GW gaskraftverk
Aker BP gör ett av Norges största oljefynd på ett decennium, stärker resurserna i Yggdrasilområdet

Ett samtal om koppar, kaffe och spannmål
Brent sideways on sanctions and peace talks
Sommarens torka kan ge högre elpriser i höst
-
 Nyheter4 veckor sedan
Meta bygger ett AI-datacenter på 5 GW och 2,25 GW gaskraftverk
-
 Nyheter4 veckor sedan
Aker BP gör ett av Norges största oljefynd på ett decennium, stärker resurserna i Yggdrasilområdet
-
 Nyheter4 veckor sedan
Ett samtal om koppar, kaffe och spannmål
-
Analys4 veckor sedan
Brent sideways on sanctions and peace talks
-
 Nyheter4 veckor sedan
Sommarens torka kan ge högre elpriser i höst
-
Analys3 veckor sedan
Brent edges higher as India–Russia oil trade draws U.S. ire and Powell takes the stage at Jackson Hole
-

 Nyheter3 veckor sedan
Mahvie Minerals är verksamt i guldrikt område i Finland
-
Analys3 veckor sedan
Increasing risk that OPEC+ will unwind the last 1.65 mb/d of cuts when they meet on 7 September