

Analys
SIP Nordic – Råvaruguiden – april 2013

 Kopparstyrd tågtidtabell
Jag tillhör skaran av de hundratusentals människor som varje dag sätter sig på ett tåg för att ta mig in till jobbet. Den senaste tiden har dessa irriterande tågförseningarna blivit fler och fler. Det är dock inte ”oväntat” snöoväder som varit orsaken de flesta gångerna utan kopparstölder.
Koppar är en mycket använd industrimetall som används lite varstans i vårt samhälle, däribland ledningar som används i tågtrafiken. Om en kopparledning rivs av kan det leda till timslånga förseningar och i många fall inställda tåg.
Högre kopparpris tenderar att attrahera personer vars respekt för lag och ordning inte är jättehögt. Med ett högre kopparpris kommer ökade stölder och fler tågförseningar.
Studier visar att det faktiskt finns ett samband mellan världspriset på koppar och kopparstölder. Under sensommaren 2011 då kopparpriset föll nästan 20 % minskade även antal kopparstölder dramatiskt, med upp till 40 % färre stölder under denna period. Sedan dess står kopparpriset högre och jag står allt oftare på perrongen och lyssnar på meddelanden om inställda tåg. Ett ytterst irriterande samband.
Jag ser dock lite ljusare på min framtida pendlartid. Lagren av koppar är de största på nästan tio år och spekulanter radar nu upp sig för att köpa kontrakt för nedgång. Någon som kan tala för en nedgång i kopparpriset.
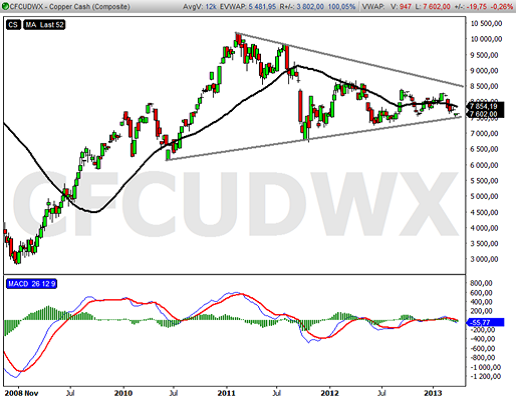
Jag frågade Tobbe Rosén om hans tekniska syn på koppar och han skrev
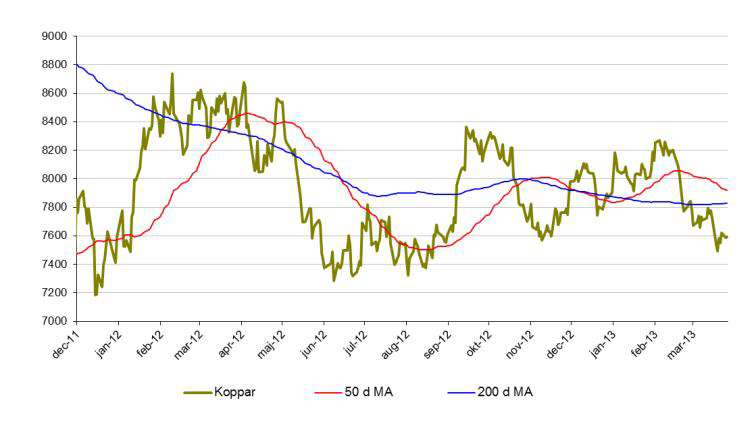
”Priset på koppar har fallit sedan toppen i början av 2011 och befinner sig i ett lågvollaläge som går mot sitt slut. Det mest troliga är att utbrottet sker på ovansidan men det avtagande momentumet indikerar en viss svaghet. Oavsett om utbrottet sker uppåt eller nedåt är det väl värt att följa.”
Fundamental analys talar alltså för att kopparpriset ska ned. Den tekniska analysen visar också på en viss svaghet.
För att jag ska slippa att bli stående på perrongen i framtiden så hoppas jag verkligen att analysen är rätt.
Alexander Frick
Råvaror – Energi
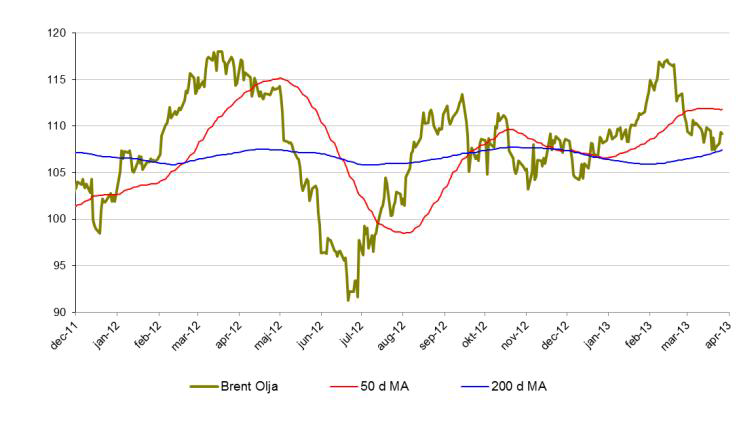
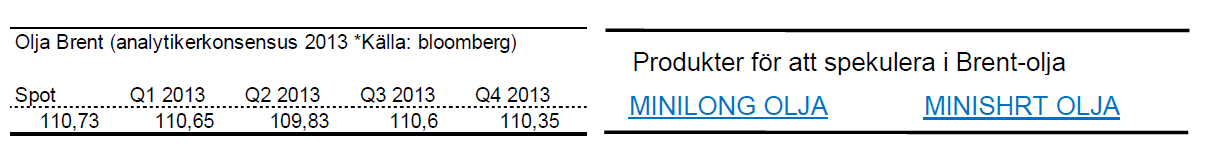
Brent olja
- Det har blivit dags att summera det första kvartalet för råvarorna och brent har åkt berg och dalbana.
- För året är brentoljan ned drygt 1 %.
- Sedan toppen i början av februari har brent tappat 8 %.
- Minskad import från USA samt ökade lager bidrar till brentoljans nedgång.
- Uttalande från Ben Bernanke (FED) om en paus i stimulanspaket påverkar även priset på olja negativt.
- Bland spekulanter (bland annat fonder) ökas de långa positionerna vilket kan indikera att en vändning uppåt är på väg.
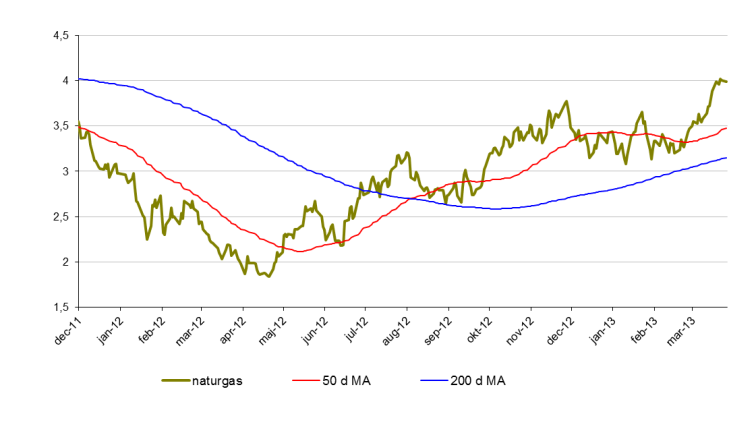
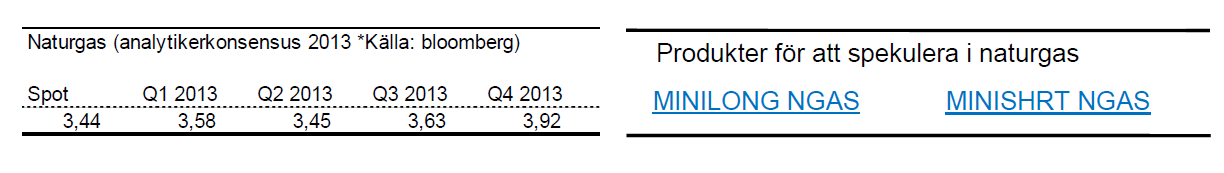
Naturgas
- Naturgas har startat året starkt. Upp nästan 17 % för året.
- I princip hela uppgången har skett under mars månad.
- Kallt väder i USA bidrar uppgången.
- Naturgas testar nu en viktig nivå kring 4$. Om Kursen etablerar sig över denna nivå kan vi mycket väl se högre kurser framöver.
Råvaror – Metaller
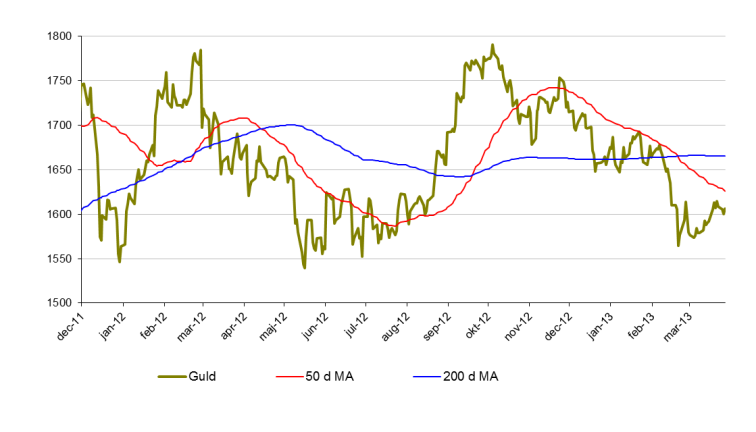
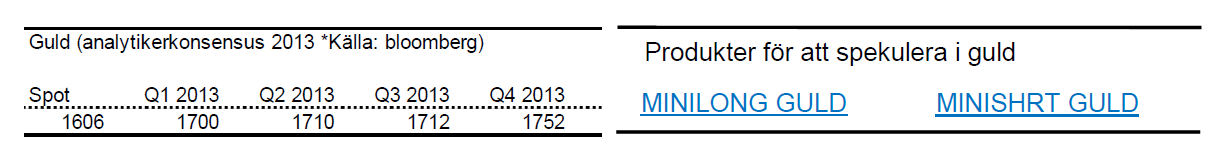
Guld
- Guld befinner sig i ett otroligt spännande läge. Sedan årets början är guld ned nära 3 %.
- Många väntade sig en större reaktion på krisen i Cypern.
- Under mars månad är guld dock endast upp 1,5 %.
- Riskaptiten är fortsatt hög varför guldet mycket väl kan fortsätta att falla.
- Vi såg även sett s.k. dödskors i guld i februari vilket betyder att 50 dagars medelvärde skär 200 dagars uppifrån. Detta brukar kunna tolkas som en signal om nedgång.
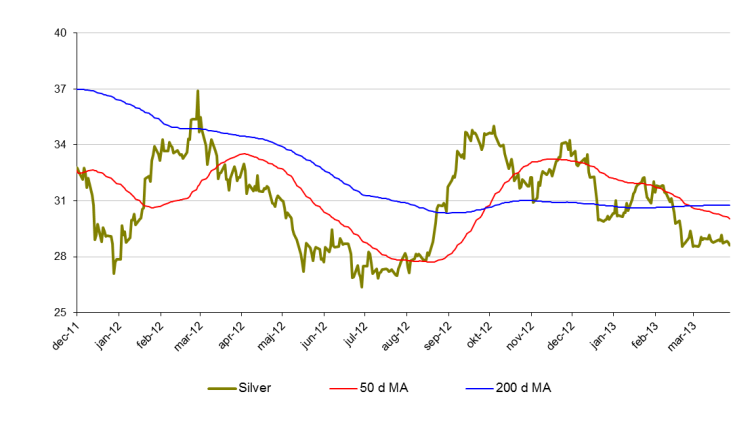
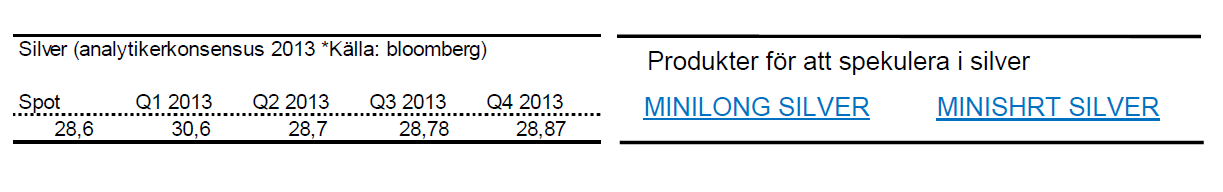
Silver
- Silver har den senaste månaden stabiliserats kring 28,5$ med mycket små rörelser.
- För året är silver ned 6,5 %.
- Likt guld tar silver stryk av att riskaptiten ökat och behovet av en ”säker hamn” är svalt.
- Tecken på framförallt en starkare amerikansk ekonomi driver priset på silver nedåt.
- Motståndsområde kring 29,5$ måste tas ut för att silver ska bli intressant för uppgång.
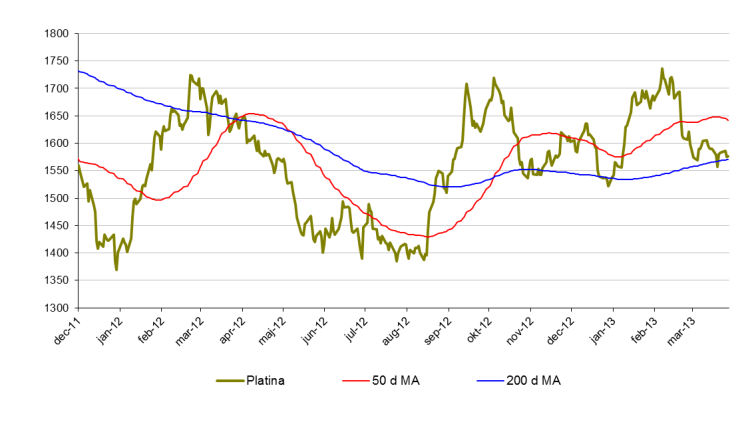
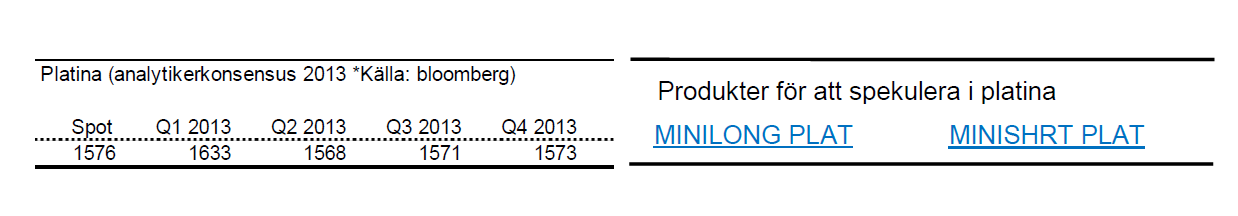
Platina
- Platina är fortsatt på plus för året. 3,5 % sedan sista december.
- Man bör dock komma ihåg att platina tappat nästan 10 % sedan i början av februari.
- Platina handlas återigen under guldet och en pairtrade likt den jag beskrev i februari kan åter vara intressant.
- Stödzon runt 1550$ är intressant att bevaka.
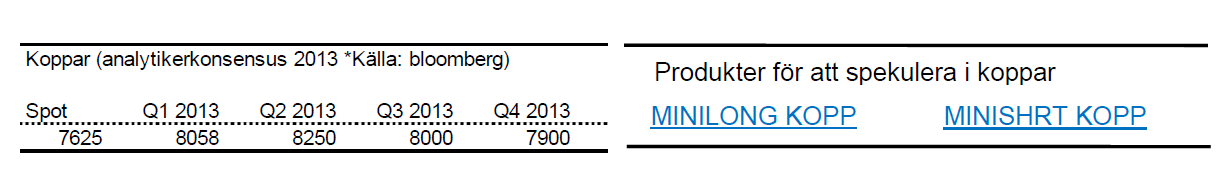
Koppar
- För året är koppar ned 4 % och det finns mycket som talar för att tappet ska fortsätta.
- Lagren av koppar är det största på nästan 10 år samtidigt som fler och fler spekulanter köper korta positioner.
- Debaclet i Cypern sätter även sina spår i kopparpriset.
- Positiv konsumtionsstatistik från Kina hjälper även föga eftersom lagren är så höga.
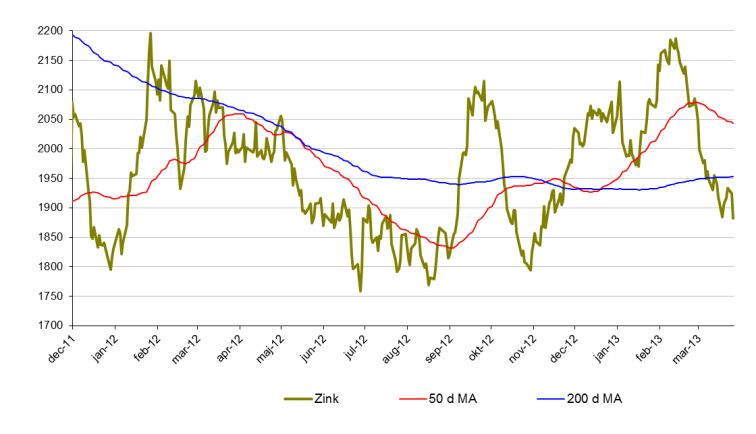
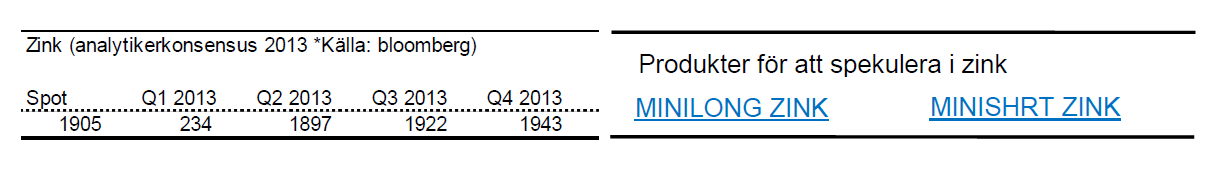
Zink
- Priset på zink dyker. För året är zinkpriset ned knappa 10 %.
- Likt koppar har Cypernkrisen satt sina spår.
- Zink handlas snart i regionen kring en rad stöd (1800$). Rekyler där kan vara intressanta att bevaka.
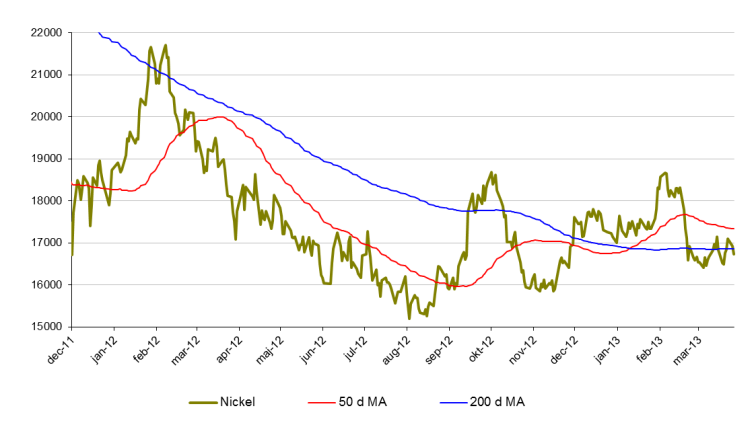
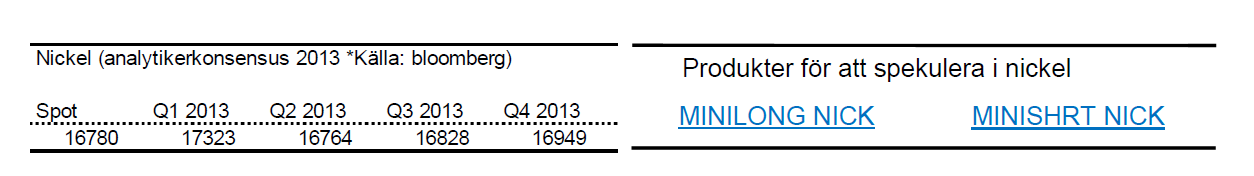
Nickel
- Nickel är för året ned drygt 2,5 %.
- Under februari tappade nickel nästan 11 %.
- Nickel presterade sämst av alla basmetaller under 2012. Slutsiffran blev -8 % för 2012.
- Nickelmarknaden är fortsatt mättad med ökande lager.
- Många stora projekt inom nickelproduktion är redan finansierade och irreversibla vilket kommer att öka tillgången av nickel ytterligare.
Råvaror – Jordbruk
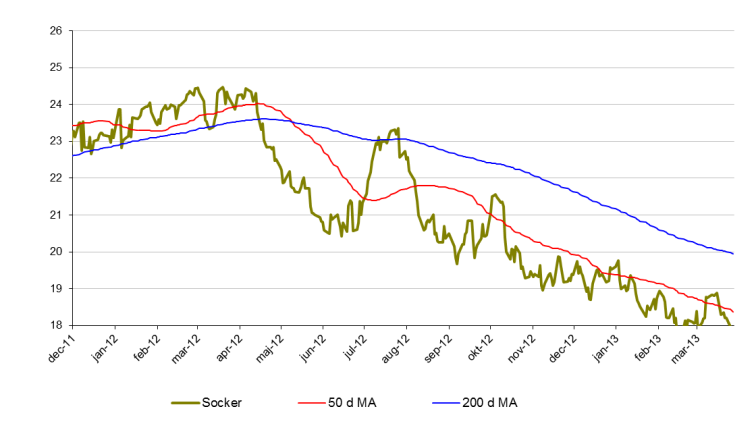
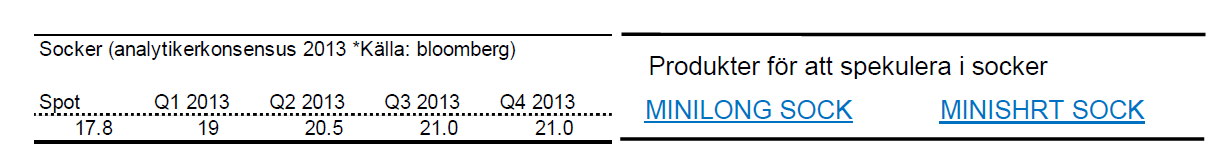
Socker
- Sockers kräftgång fortsätter. Sedan oktober förra året är sockerpriset ned 18 %.
- För året är sockerpriset ned drygt 8 %.
- En anledning till det fortsatta prisfallet är att nuvarande nivåer inte motiverar sockerproduktion. Andra grödor eller etanol ses som mer attraktiva.
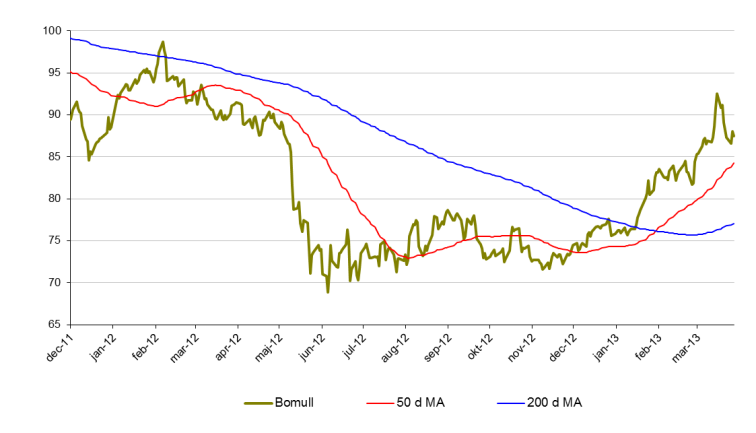
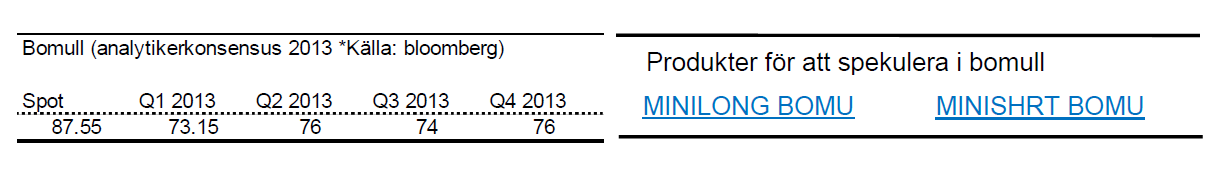
Bomull
- Bomullspriset utvecklas starkt under början av 2013.
- För året är priset på bomull upp 17,3 %.
- Under mars månad är bomull upp 5,2 %.
- Sedan november 2012 är priset på bomull upp 26 %.
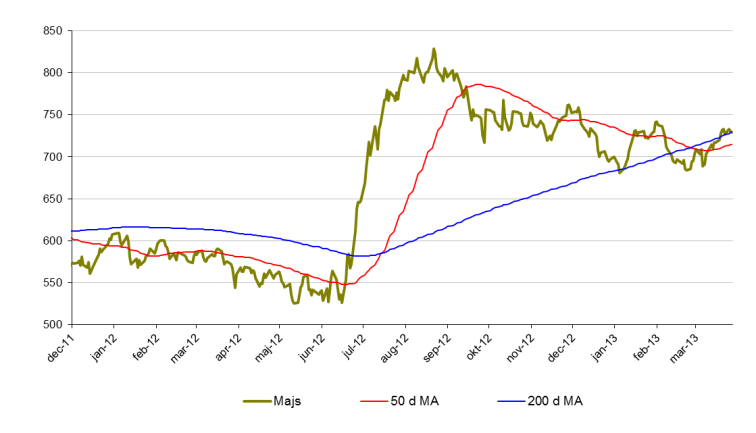
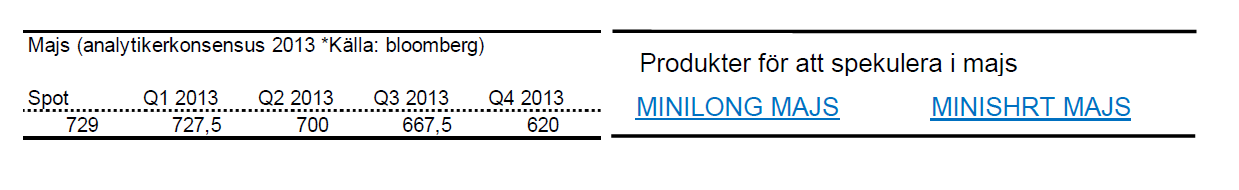
Majs
- Priset på majs har återigen vänt uppåt.
- För året är priset på majs upp nästan 6 %.
- Sedan förra årets extremtorka har majs legat i en negativ trend. Denna trend är nu bruten till följd av en period av torrare väder.
- Stora skördar väntas dock och vädret ser ut att bli bättre.
- Följ således majs med försiktighet.
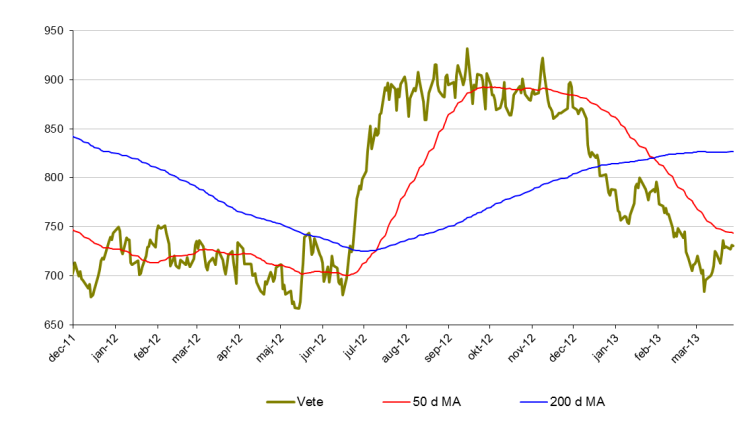
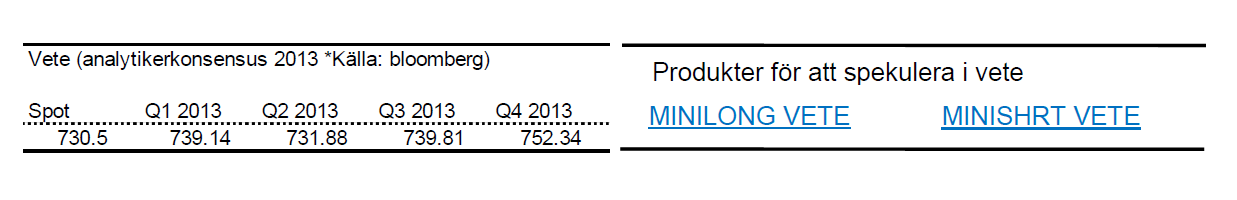
Vete
- Likt majs rekylerade vete upp över den negative trendlinje som funnits sedan förra sommaren.
- Försiktighet gäller även här.
- För året är vete ned 5 %.
- Under mars månad steg priset på vete med 3,5 %.
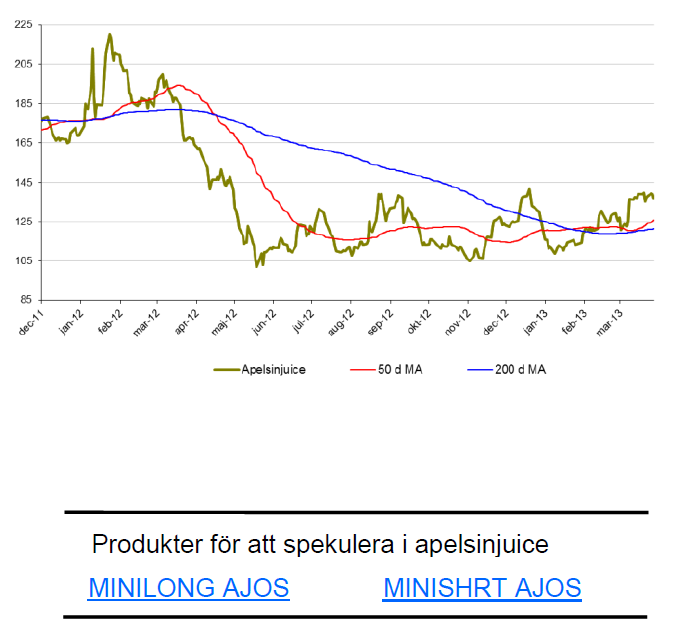
Apelsinjuice
- Vi har länge bevakat apelsinjuice i Tradingklubben.
- Apelsinjuice känns svårtippad och 143-nivån bör brytas innan vi intresserar oss för uppgång.
- För året är apelsinjuice upp 7 %.
- Priset på apelsinjuice är fortfarande 70-80 % högre än botten 2009. Fallhöjden är således hög. Mycket hög.
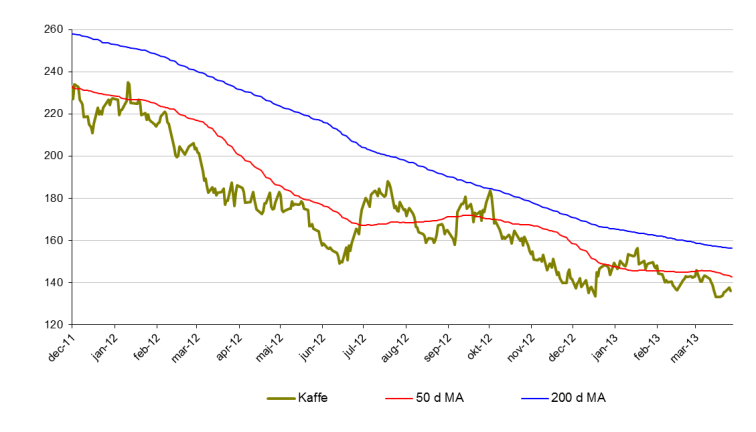
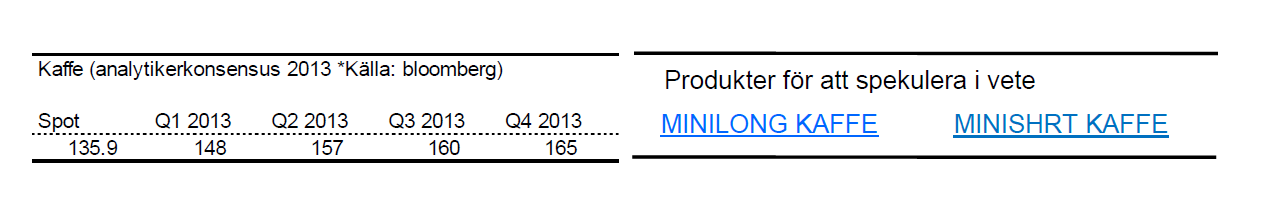
Kaffe
- Kaffe ligger fortfarande i en långsiktigt nedåtgående trend.
- För året är kaffe ned 7 %.
- Det är ökade lager som driver priset nedåt.
- Viktigt stödområde kring 135$.
[box]Denna uppdatering är producerat av SIP Nordic och publiceras i samarbete och med tillstånd på Råvarumarknaden.se[/box]
Ansvarsbegränsning
Detta produktblad utgör endast marknadsföring och har sammanställts av SIP Nordic Fondkommission AB.
Innehållet ger inte fullständig information avseende det finansiella instrumentet. Investerare uppmanas att del av prospekt och slutliga villkor, vilka finns tillgängliga på: www.rbsbank.se/markets, innan ett investeringsbeslut tas.
Förekommande exempel är simulerade och baseras på SIP Nordics egna beräkningar och antaganden, en person som använder andra data eller antaganden kan nå andra resultat. Administrativa avgifter och transaktionsavgifter påverkar den faktiska avkastningen.

Selling down on a ”deal”. Brent crude fell 6.2% last week with accelerated weakness towards the end of the week. Close of the week at $87.33/b and low of the week (and on Friday) of $85.8/b. Brent is falling another 4% this morning to $83.7/b on confirmation by Iran that a MoU text has been reached and that it will be signed on Friday this week.

So what is this ”deal” worth? Talk on the desk here this morning is that it is much like ”putting lipstick on a pig” where Trump has to sell this at home as a victory where ”the SoH has reopened”, the nuclear issue will be ironed out over the coming 60 days (or maybe 600 days?) and US consumers are getting a lower gasoline price and maybe US republicans survives the midterm elections.
The importance for Iran is that it emerges as the defacto winner of this war in the eyes of the non-US public world. That Iran now onwards is the ”ruler of the SoH” (combo of geography and new weapons systems like drones) or more softer: ”the guarantor of safe passage through the SoH”.
Iran doesn’t need nuclear weapons any more. Nuclear deterrence doesn’t work any more. Ukraine has made many attacks deep into Russia without being nuked in return. Plenty of Iranian ballistic rockets blasts over Israel but Iran wasn’t nuked in return.
There is no trust between the US and Iran. We don’t know all the details yet of the MoU. But what we do know is that there is no trust between the US and Iran what so ever. This is probably more like a descriptive text on how they can cooperate in a way where both sides keeps tactical leverage. Neither side makes irreversible concessions. Violations can be punished quickly. Cooperation produces immediate benefits.
This is a fragile structure. It can easily break down. There may be details which cannot be overcome. To be seen on Friday. The US has to show that it is willing put enough force behind managing and restraining Israel versus Hezbollah in Lebanon. We have seen that Netanyahu hasn’t listened all that much to Trump’s directives and wishes. This could be a major obstacle.
A gradual reopening is tactically preferable for Iran. A tactical leverage for Iran right now is that global oil stocks have been drawn down towards painful and increasingly dangerous levels with increasing risks for oil price spikes in mid-July to August. This together with US midterm elections on 3 November gives tactical leverage to Iran. Iran probably doesn’t want to fully give up on that leverage. A rapid, full reopening where global stocks are able to refill over the coming 60 days will significantly erode that leverage. If Iran reinstates a closure of the SoH after 60 days (if talks break down again), then the effect won’t be that impactful in terms of prices and the US midterm elections.
So a gradual and partial reopening where global markets gets the oil they need while they are unable to rebuild stocks could be a practical middle way for both parties. Trump can sell it as ”the SoH has reopened” and get affordable gasoline for US consumers. Iran can sell it as ”the SoH has fully reopened, but there is some friction” so flow is only 60-80% of normal.
Not much real demand destruction below $100/b. What we do know is that there is not much real price pain demand destruction for oil globally at an oil price below $100/b. A lot of demand-shock destruction. Fear. But demand should now come roaring back towards normal with fear for exceptionally high prices now is rapidly receding.
Sudden China demand destruction due to EVs? Bullocks. EV share of total Chinese carpool now around 13%. Share of new sales of EVs has reached 50%. This is a very gradual process. It doesn’t make oil demand fall like a rock over night. When EV new sales share reaches 100%, then the gasoline car pool will contract by some 5-10% per year. But that is only gasoline. Sudden reduction in Chinese oil demand is more about shock and risk.
Chinese crude oil imports will come roaring back. At what price? Today’s ”neutral” oil price is $70/b. That is the five year price which has steadily traded around the $70/b mark over the past 3-4 years. With still a risky picture one would think that China and the rest of the world will be big buyers of oil in the range of $70-85/b.
Global demand will likely snap back towards normal, forecasted demand and growth at such prices.
Physical reopening is a gradual process. The physical and practical reopening of the SoH will likely be gradual rather than sudden. And that probably suites Iran tactically as well.
Brent M1 price versus the Brent 5-yr (today’s ”normal” price)

Market is starting to take US/Iran headlines with a pinch of salt. Brent crude rose $2.8/b yesterday to an official close of $112.1/b. But after that it traded as low as $108.05/b before ending late night at around $109.7/b. Through the day it traded in a range of $106.87 – 112.72/b amid a flurry of news or rumors from Iran and the US. ”US temporary sanctions during negotiations” (falls alarm). ”We will bomb Iran” (not anyhow),… etc. While the market is still fluctuating to this kind of news flow, it is starting to take such headlines with a pinch of salt.
We’ll see. Maybe, maybe not. The Brent M1 contract is trading at $110.2/b this morning which very close to the average ticks through yesterday of $110.4/b.
Trump with bearish, verbal intervention whenever Brent trades above $110/b it seems. What seems to be a pattern is that Trump states something like ”very good negotiations going on with Iran”, ”New leaders in Iran are great,..”, ”Great progress in negotiations,…”, ”Deal in sight,..” etc whenever the Brent M1 contract trades above $110/b. An effort to cool the market. These hot air verbal interventions from Trump used to have a heavy bearish impact on prices, but they now seems to have less and less effect unless they are backed by reality.
As far as we can see there has been no real progress in the negotiations between the US and Iran with both sides still standing by their previous demands.
Iran is getting stronger while the cease fire lasts making a return to war for Trump yet harder. Iran is naturally in constant preparation for a return to war given Trump’s steady threats of bombing Iran again. Iran is naturally doing what ever is possible to prepare for a return to war. And every day the cease fire lasts it is better prepared. This naturally makes it more and more difficult and dangerous for the US to return to warring activity versus Iran as the consequences for energy infrastructure in the Persian Gulf will be more and more severe the longer the cease fire lasts. Israel seems to see it this way as well. That the war is not won and that current frozen state of a cease fire gives Iran opportunity to rebuild military and politically.
Global inventories are drawing down day by day. How much? In the meantime the Strait of Hormuz stays closed. There is varying measures and estimates of how much global inventories are drawing down. Our rough estimate, back of the envelope, is that global inventories are drawing down by at least some 10 mb/d or about 300 mb/d in a balance between loss of supply versus demand destruction. Other estimates we see are a monthly draw of 250-270 mb/d. The IEA only ’measured’ a draw in global observable stocks of 117 mb in April with oil on water rising 53 mb while on shore stocks fell 170 mb. But global stocks are hard to measure with large invisible, unmeasured stocks. As such a back of the envelope approach may be better.
Oil products is what the world is consuming. Oil product prices likely to rise while product stocks fall. Strategic Petroleum Reserves (SPR) are predominantly crude oil. Discharging oil from OECD SPR stocks, a sharp reduction in Chinese crude imports and a reduction in global refinery throughput of 6-7 mb/d has helped to keep crude oil markets satisfactorily supplied. But global inventories are drawing down none the less. And oil products is really what the world is consuming. So if global refinery throughput stays subdued, then demand will eventually have to match the supply of oil products. The likely path forward this summer is a steady draw down in jet fuel, diesel and gasoline. Higher prices for these. Then, if possible, higher refinery throughput and higher usage of crude in response to very profitable refinery margins. And lastly sharper draw in crude stocks and higher prices for these. But some 6 mb/d of oil products used to be exported through the Strait of Hormuz. And it may not be so easy to ramp up refinery activity across the world to compensate. Especially as Ukraine continues to damage Russian refineries as well as Russian crude production and export facilities.
Watch oil product stocks and prices as well as Brent calendar 2027. What to watch for this summer is thus oil product inventories falling and oil product premiums to crude rising. Another measure to watch is the Brent crude 2027 contract as it rises steadily day by day as the Strait of Hormuz stays closed and global oil inventories decline. The latter is close to the highest level since the start of the war and keeps rising.
The Brent M1 contract and the Brent 2027 prices and current price of jet fuel in Europe (ARA). All in USD/b

Our back of the envelope calculation of the global shortage created by the closure of the Strait of Hormuz. Note that 3.5 mb/d of discharge from SPR is also a draw. Note also that ’Forced demand loss’ of 2.5 mb/d is probably temporary and will fall back towards zero as logistics are sorted out leaving ’Price demand loss’ to do the job of balancing the market. Thus a shortfall of at least 9 mb/d created by the closure. More if SPR discharge is included and more if Forced demand loss recedes.

Brent is climbing higher. Front-month is at USD 106.3/bl this morning, close to a weekly high and a USD 9/bl jump from Mondays open. This is the move we flagged as a risk earlier in the week: the market shifting from ”a deal is around the corner” to ”this is going to take longer than we thought”.

Analyst Commodities, SEB
During April, rest-of-year Brent remained remarkably stable around USD 90/bl. A stability which rested on one single assumption: the SoH reopens around 1 May. That assumption is now slowly falling apart.
As we highlighted yesterday: every week of delay beyond 1 May adds (theoretically) ish USD 5/bl to the rest-of-year average, as global inventories draw 100 million barrels per week. i.e., a mid-May reopening implies rest-of-year Brent closer to USD 100/bl, and anything pushing into June or July takes us meaningfully higher.
What’s changed in the last 48 hours:
#1: The US military has formally warned that clearing suspected sea mines from SoH could take up to six months. That is a completely different timescale from what the financial market is pricing. Even a political deal tomorrow does not immediately reopen the strait.
#2: Trump has shifted his tone from urgency to ”strategic patience”. In yesterday’s press conference: ”Don’t rush me… I want a great deal.” The market is reading this as a president no longer feeling pressured by timelines, with the naval blockade running in the background.
#3: So far, the military activity is escalating, not de-escalating. Axios reports Iran is laying more mines in SoH. The US 3rd carrier strike group (USS George H.W. Bush) is arriving with two countermine vessels. Trump yesterday ordered the US Navy to destroy any Iranian boats caught laying mines. While CNN reports that the Pentagon is actively drawing up plans to strike Iranian SoH capabilities and individual Iranian military leaders if the ceasefire collapses. i.e., NOT a attitude consistent with an imminent deal!
Spot crude and product prices eased off the early-April highs on a combination of system rerouting and deal optimism. Both now weakening. Goldman estimates April Gulf output is reduced by 14.5 mbl/d, or 57% of pre-war supply, a number that keeps getting worse the longer this drags on.
Demand-side adaptation is ongoing: S. Korea has cut its Middle East crude dependence from 69% to 56% by pulling more from the Americas and Africa, and Japan is kicking off a second round of SPR releases from 1 May. But SPRs are finite.
Ref. to the negotiations, we should not bet on speed. The current Iranian leadership is dominated by genuine hardliners willing to absorb economic pain and run the clock to extract concessions. That is not a setup for a rapid resolution. US/Israeli media briefings keep framing the delay as ”internal Iranian divisions”, the reality is more complicated and points toward weeks and months, not days.
Our point is that the complexity is large, and higher prices have only just started (given a scenario where the negotiations drag out in time). The market spent April leaning on the USD 90/bl rest-of-year assumption; that case is diminishing by the hour. If ”early May reopening” is replaced by ”June, July or later” over the next week or two, both crude and products have meaningful room to reprice higher from here. There is a high risk being short energy and betting on any immediate political resolution(!).


Vattenfalls och Industrikrafts kärnkraftsbolag Videberg Kraft har valt Rolls-Royce SMR
Selling down on a ”deal”

Sommarväder skapar prisrally på elbörsen
Oil product price pain is set to rise as the Strait of Hormuz stays closed into summer

Solkraften pressar elpriserna dagtid
Oil product price pain is set to rise as the Strait of Hormuz stays closed into summer
Sommarväder skapar prisrally på elbörsen
Vattenfalls och Industrikrafts kärnkraftsbolag Videberg Kraft har valt Rolls-Royce SMR
Selling down on a ”deal”
-
Analys4 veckor sedan
Oil product price pain is set to rise as the Strait of Hormuz stays closed into summer
-
Nyheter2 veckor sedan
Sommarväder skapar prisrally på elbörsen
-
 Nyheter2 dagar sedan
Vattenfalls och Industrikrafts kärnkraftsbolag Videberg Kraft har valt Rolls-Royce SMR
-
Analys2 dagar sedan
Selling down on a ”deal”