

Analys
SIP Nordic – Råvaruguiden – januari 2013
 Timing viktigare än någonsin
Tiden går som vanligt alldeles för fort och det känns som igår jag skrev den första råvaruguiden (jan-12). Samtidigt som det är dags att summera ett ljummet råvaruår är det hög tid att rikta blickarna mot 2013 års spåkula. Fortsätter guldet mot ett positivt år för 14:e året i rad, fortsätter jordbruksråvarornas kräftgång och kommer vi att se olja klättra upp mot höga nivåer? Oavsett vad har vi ett spännande år framför oss där börserna under 2012 presterade bra trots oron för en Eurokris. 2013 blir spännande där mycket fokus kommer ligga kring USAs budgetstup och evigt växande budgetunderskott. Något som på alla vis kommer påverka råvarorna. Men var beredda på en tur i berg- och dalbanan. 2013 kan för råvaror bli mycket lik 2012 där timing är A och O.
Jag skrev i min första råvaruguide att jag inför 2012 trodde på platina och guld. Guld och platina ökade under 2013 med 5 respektive 9 %. En bra avkastning under rådande marknadsförhållanden men faktum är att man med rätt timing och aktiv börshandel hade kunna mångdubblat dessa siffror.
De flesta råvaror pendlade kraftigt under 2012 där vi såg en bred uppgång i början av året vilket snabbt byttes mot en negativ trend fram till slutet av sommaren. Då var det återigen dags för FED att sätta igång sedelpressarna vilket drev råvarupriserna uppåt igen. Guld var inget undantag. Faktum är att den aktive handlaren hade kunnat ha en avkastning på över 80 % om denna köpt och sålt guld vid rätt tillfälle.
Nu är det ju alltid enkelt i efterhand att säga hur man borde ha gjort men jag tror faktiskt att vi får se ett liknande scenario under 2013.
Mycket av nyhetsflödet kommer i år att vara kring USAs budgetstup och det växande budgetunderskottet. Nu verkar det som att den kortsiktiga krisen är bortblåst. Något som får råvaror att rusa. Problemet kvarstår dock och om två månader måste frågorna kring USA budgetunderskott lösas. Något som hotar USAs kreditbetyg och som på många sätt kan påverka priset på råvaror. Framförallt guld, silver och olja.
2013 kommer således bli ett spännande råvaruår där bra avkastning finns att hämta. Det är dock viktigare än någonsin att ha rätt timing.
Personligen tror jag att guld kommer att fortsätta upp under 2013. USA kan mycket väl tvingas sätta igång fler stimulanspaket vilket är positivt för guldet. För den aktive med rätt timing kan guld bli en riktig vinnare under 2013.
Alexander Frick
Råvaror – Energi
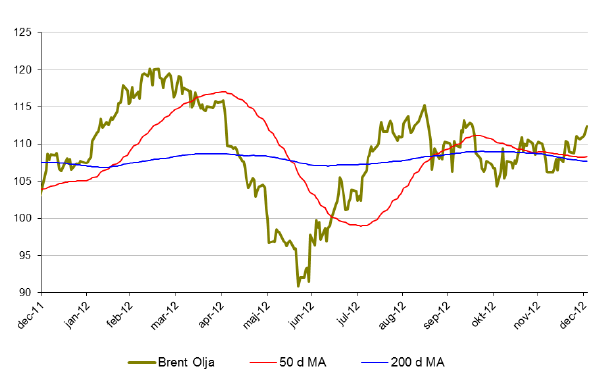
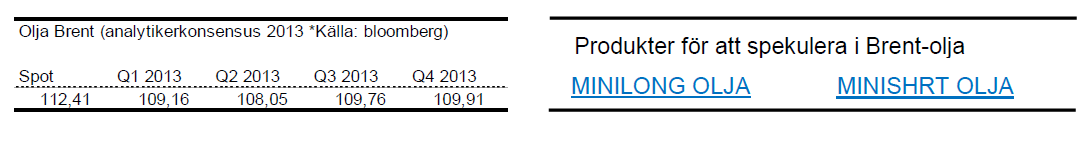
Brent olja
- Brentoljan åkte under 2012 berg och dalbana. Brent gick under 2012 upp dryga 2 %.
- Under december månad ökade priset på brent med cirka 1,6 %.
- Brent påverkades mycket av de ekonomiska oroligheterna under 2012. Något som mycket väl kan fortsätta under 2013. Stora svängningar är alltså att vänta.
- Monetära stimulanser sätter dollarn under press vilket hjälper oljan att stanna på höga nivåer.
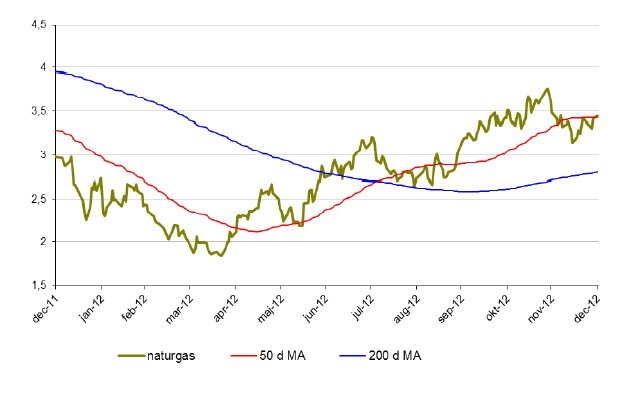
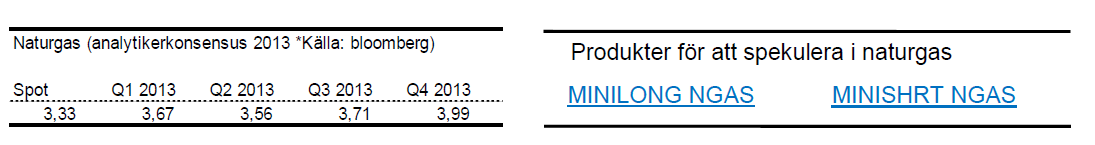
Naturgas
- Från i mitten av april hade Naturgas en mycket stark period under 2012. Sedan botten i april klättrade priset på naturgas med nästan 80 % och avslutade året på cirka 10 % upp.
- Under december föll priset på naturgas med 10 %
- Efter den starka trenden är det inte osannolikt att naturgas börjar tappa i fart. Naturgas handlas nu strax under 50-dagars medelvärde.
Råvaror – Metaller
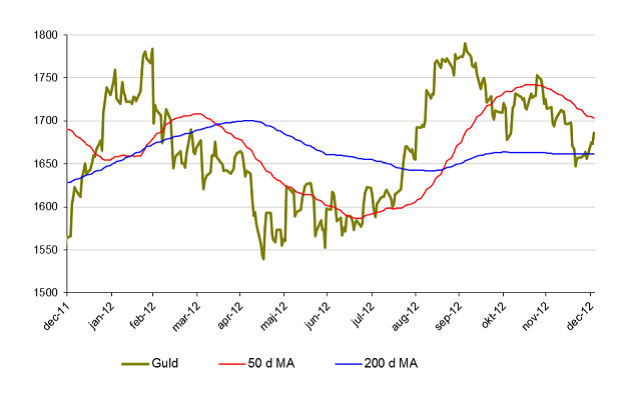
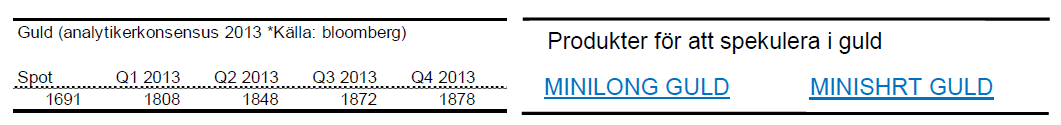
Guld
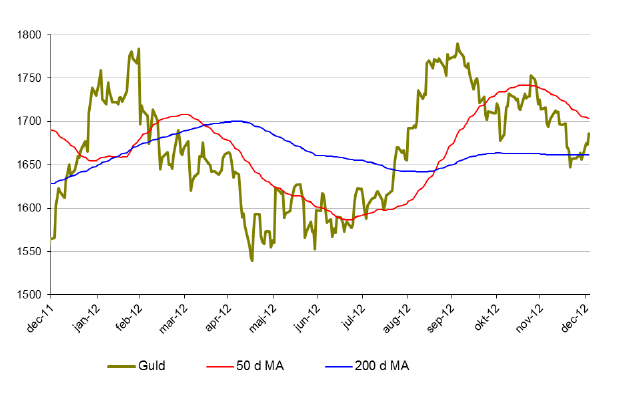
- Guld stängde på en positiv siffra 2012 vilket var det 13:e året i rad med positiv utveckling!
- Guld pendlade likt olja kraftigt av samma anledningar. Ekonomiska oroligheter och stimulanspaket satte guldet i pendling.
- Under 2012 ökade priset på guld med ca 5 %.
- I december tappade guld dock nästan 4 %.
- För den aktive börshandlaren finns stora pengar att tjäna då guldpriset med stor sannolikhet kommer att pendla en del under 2013.
- Den amerikanska penningpolitiken styr till stor del det mesta.
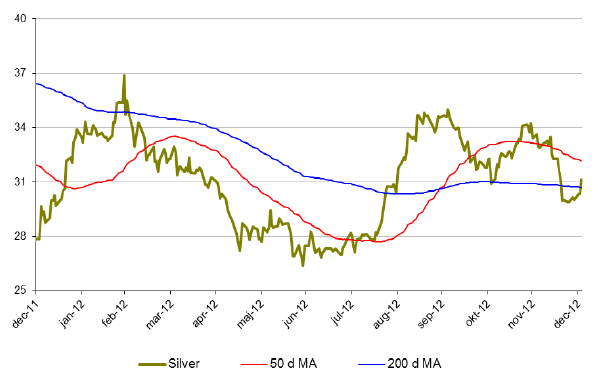
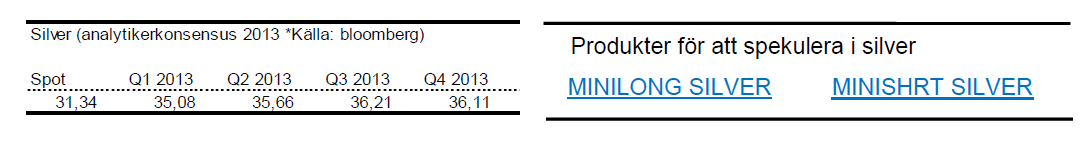
Silver
- Silver hade även ett positivt år 2012. Än dock med kraftiga svängningar. För året var silver upp dryga 6 %.
- December månad var dock lite mer mörk då silver föll nästan 12 %.
- Silver handlas strax ovanför 200 dagars medelvärde men befinner sig i en kortsiktigt negativ trend.
- Viktiga nivåer hittar vi kring 27 dollar där vi har en viktig motståndszon.
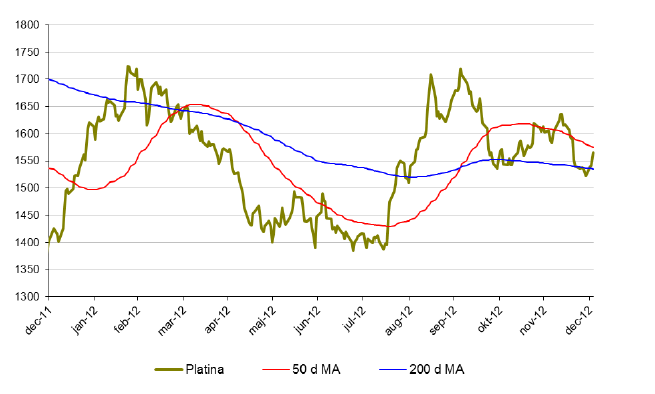
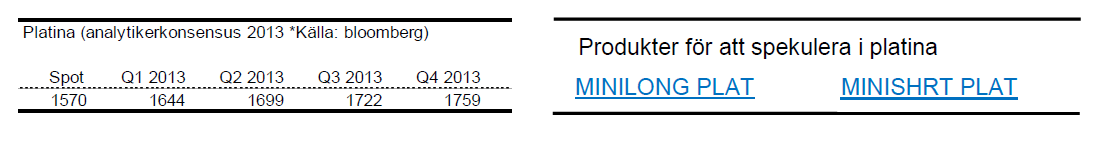
Platina
- Platina var inget undantag under 2012. Platina ökade med cirka 9 % under 2012.
- Platina handlas dock till ett lägre pris än guld. Något som historiskt sett varit det motsatta.
- Under december föll priset på platina med 4 %.
- Platina befinner sig i en negativ trend där 50 dagars glidande medelvärde på 1650 blir intressant att observera under januari.
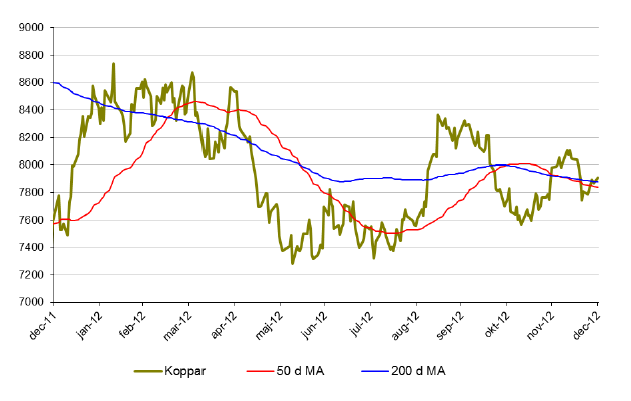
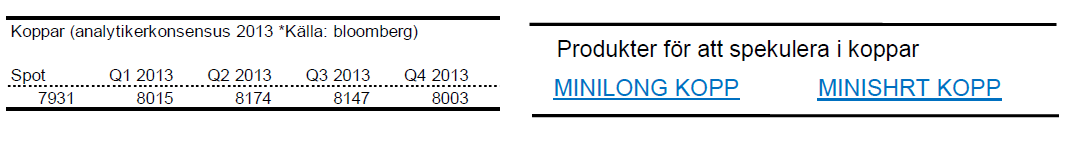
Koppar
- Metallerna svingade rejält under 2012 och koppar är inget undantag. Trots att koppar avslutade året på cirka 2,7 % upp är det ändå nästan 10 % under årets högstanivå.
- Under december föll priset på koppar med 0,6 %
- Koppar handlas just nu över både 50 och 200 dagars medelvärde men i en negativ trend. 50 dagars medelvärde korsade även 200 dagars medelvärde ovanifrån början av december.
- Tillväxtländernas förbrukning kommer styra mycket under 2013.
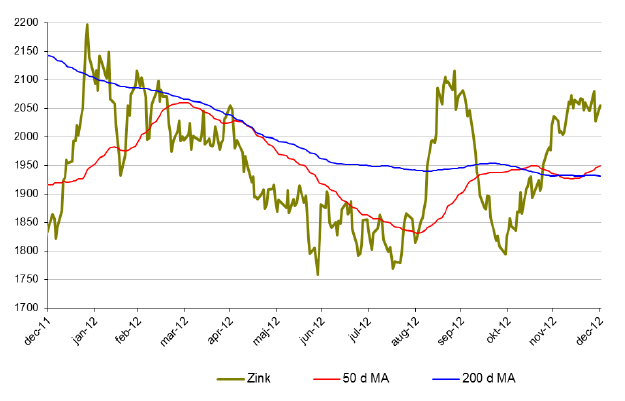
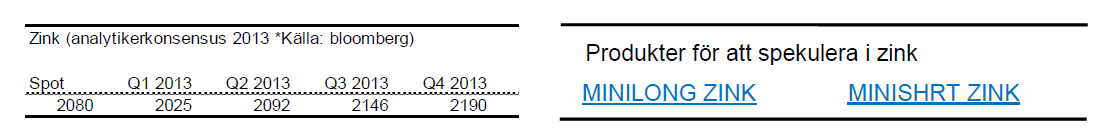
Zink
- Zink hade ett bra 2012. Upp drygt 12 %.
- Under december månad ökade priset något.
- Zink närmar sig nu viktiga nivåer kring 2100-2150 där vi har en rad motståndsnivåer. Blir intressant att följa under 2013.
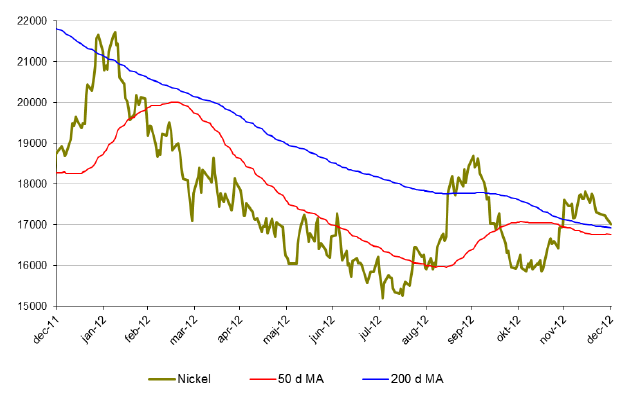
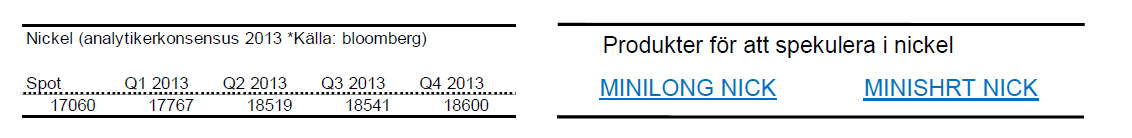
Nickel
- Nickel presterade sämst av alla basmetaller under 2011. 2012 blev inte bättre. Slutsiffran blev -8 % för 2012.
- Under december var priset på zink oförändrat.
- Nickelmarknaden är fortsatt mättad med ökande lager.
- Många stora projekt inom nickelproduktion är redan finansierade och irreversibla vilket kommer att öka tillgången av nickel ytterligare.
Råvaror – Jordbruk
Socker
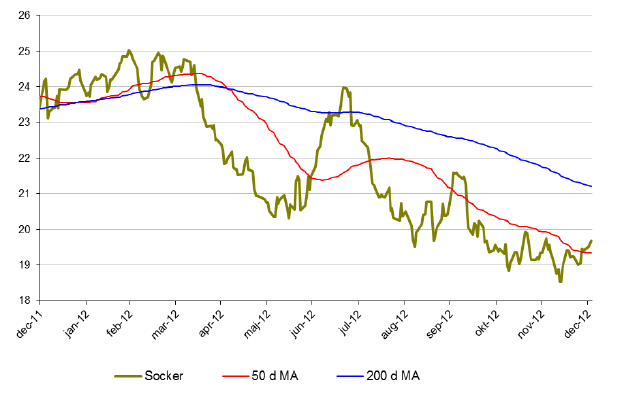
- Socker hade inget roligt 2012 med en slutsiffra på nästa -20 %.
- Under december månad är dock socker upp drygt 2 %. Kanske vänder den negativa trenden här.
- Socker föll under december igenom ett viktigt motståndsområde kring 19 cents. Nu har denna nivå brutits och det ser lite mer positivt ut.

Bomull
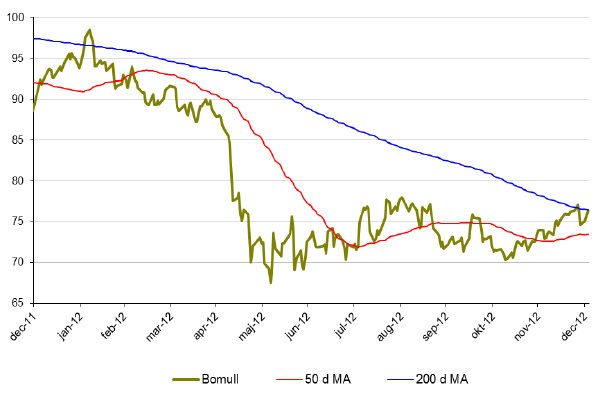
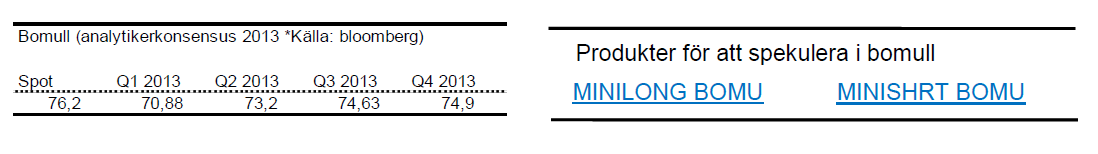
- Bomull och socker gick hand i hand under 2012. Bomullspriset föll med cirka 20 % under 2012.
- Under december månad ökade priset på bomull dryga 4 %.
- Svag kinesisk och indisk efterfrågan samt lägre ekonomisk tillväxt i Europa har lett till ökade lager. Monetära stimulanspaket kan ge en uppsving för konjunkturen och därmed öka bomullskonsumtionen.
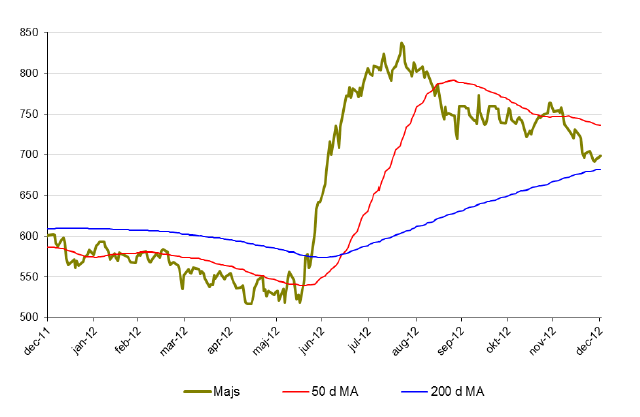
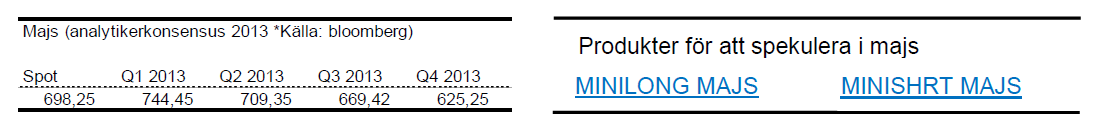
Majs
- Efter den kraftiga uppgången under sommaren 2012 föll priset på majs tillbaka men året avlutades på knappa 8 % upp.
- Under sommaren rådde extrem torka i USA vilket fick priset på majs att skjuta i höjden. Endast 40 % av skörden var av god kvalitet. Att jämföra med 70 % i normala fall.
- Under december månad föll priset på majs med 8 %.
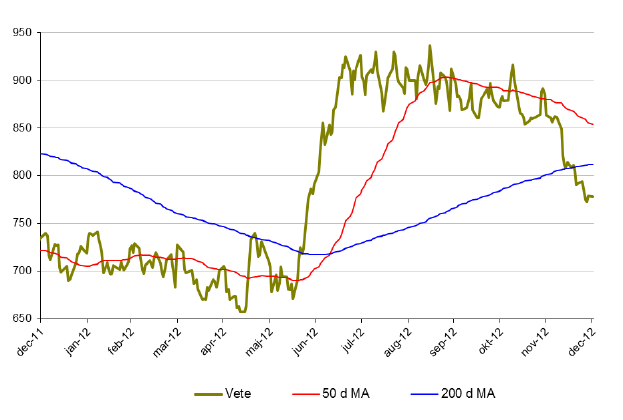
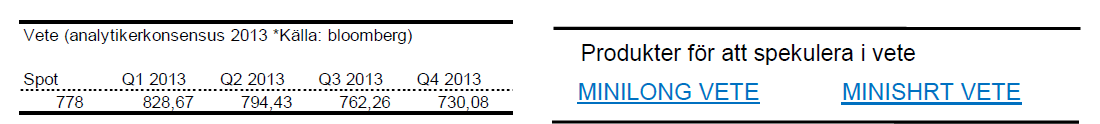
Vete
- Då majsproduktionen drabbades av den värsta torkan på många år gick fler producenter över till produktion av vete vilket fick priset att skjuta i höjden under mitten av 2012. Likt majs föll vete tillbaka under andra halvan av året. Slutligen hamnade vete på +6 % för året.
- Under december föll vete med drygt 8 %.
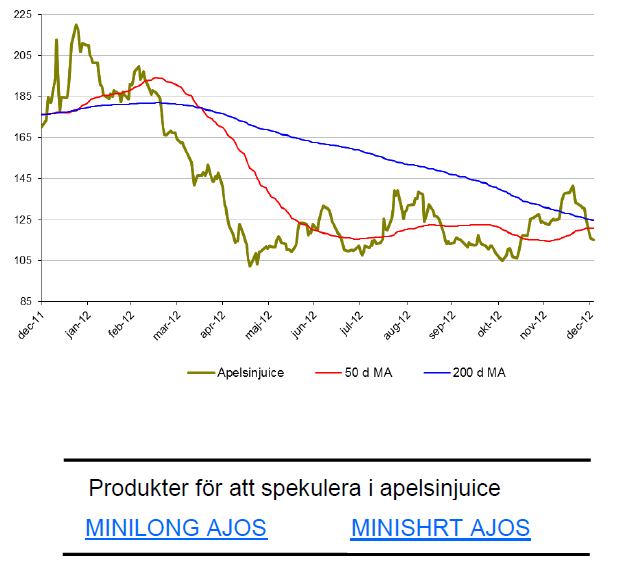
Apelsinjuice
- Den som låg kort apelsinjuice under 2012 har gjort en mycket bra affär. För året föll apelsinjuice drygt 28 %.
- Under december föll apelsinjuice med ytterligare 6 %.
- Priset på apelsinjuice är fortfarande 70 % högre än botten 2009. Fallhöjden är således hög. Mycket hög.
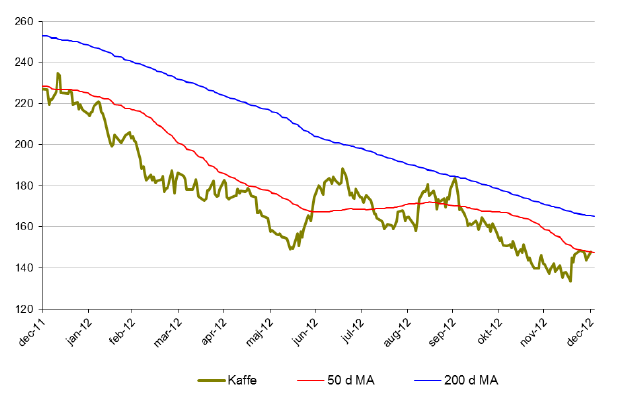
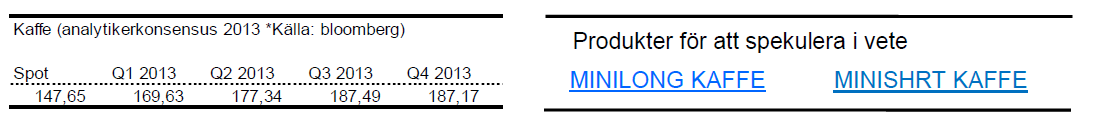
Kaffe
- För första gången är kaffe med i Råvaruguiden. Kaffe hade likt de andra jordbruksmetallerna ett svagt 2012. För året tappade kaffe 35 %.
- Kaffe gick under december upp 3,6 % vilket kan vara början på ett trendbrott.
- Om kaffe lyckas bryta upp över 50 dagars glidande medelvärde kan vi få ett trendskifte.
- Kaffe ligger dock fortfarande i en långsiktigt nedåtgående trend.
[box]Denna uppdatering är producerat av SIP Nordic och publiceras i samarbete och med tillstånd på Råvarumarknaden.se[/box]
Ansvarsbegränsning
Detta produktblad utgör endast marknadsföring och har sammanställts av SIP Nordic Fondkommission AB.
Innehållet ger inte fullständig information avseende det finansiella instrumentet. Investerare uppmanas att del av prospekt och slutliga villkor, vilka finns tillgängliga på: www.rbsbank.se/markets, innan ett investeringsbeslut tas.
Förekommande exempel är simulerade och baseras på SIP Nordics egna beräkningar och antaganden, en person som använder andra data eller antaganden kan nå andra resultat. Administrativa avgifter och transaktionsavgifter påverkar den faktiska avkastningen.


When it starts to move lower it moves rather quickly. Gaza, China, IEA. Brent crude is down 2.1% today to $62/b after having traded as high as $66.58/b last Thursday and above $70/b in late September. The sell-off follows the truce/peace in Gaze, a flareup in US-China trade and yet another bearish oil outlook from the IEA.

A lasting peace in Gaze could drive crude oil at sea to onshore stocks. A lasting peace in Gaza would probably calm down the Houthis and thus allow more normal shipments of crude oil to sail through the Suez Canal, the Red Sea and out through the Bab-el-Mandeb Strait. Crude oil at sea has risen from 48 mb in April to now 91 mb versus a pre-Covid normal of about 50-60 mb. The rise to 91 mb is probably the result of crude sailing around Africa to be shot to pieces by the Houthis. If sailings were to normalize through the Suez Canal, then it could free up some 40 mb in transit at sea moving onshore into stocks.
The US-China trade conflict is of course bearish for demand if it continues.
Bearish IEA yet again. Getting closer to 2026. Credibility rises. We expect OPEC to cut end of 2025. The bearish monthly report from the IEA is what it is, but the closer we get to 2026, the more likely the IEA is of being ball-park right in its outlook. In its monthly report today the IEA estimates that the need for crude oil from OPEC in 2026 will be 25.4 mb/d versus production by the group in September of 29.1 mb/d. The group thus needs to do some serious cutting at the end of 2025 if it wants to keep the market balanced and avoid inventories from skyrocketing. Given that IEA is correct that is. We do however expect OPEC to implement cuts to avoid a large increase in inventories in Q1-26. The group will probably revert to cuts either at its early December meeting when they discuss production for January or in early January when they discuss production for February. The oil price will likely head yet lower until the group reverts to cuts.
Dubai: The Mid-East anchor dragging crude oil lower. Surplus emerging in Mid-East pricing. Crude oil prices held surprisingly strong all through the summer. A sign and a key source of that strength came from the strength in the front-end backwardation of the Dubai crude oil curve. It held out strong from mid-June and all until late September with an average 1-3mth time-spread premium of $1.8/b from mid-June to end of September. The 1-3mth time-spreads for Brent and WTI however were in steady deterioration from late June while their flat prices probably were held up by the strength coming from the Persian Gulf. Then in late September the strength in the Dubai curve suddenly collapsed. Since the start of October it has been weaker than both the Brent and the WTI curves. The Dubai 1-3mth time-spread now only stands at $0.25/b. The Middle East is now exporting more as it is producing more and also consuming less following elevated summer crude burn for power (Aircon) etc.
The only bear-element missing is a sudden and solid rise in OECD stocks. The only thing that is missing for the bear-case everyone have been waiting for is a solid, visible rise in OECD stocks in general and US oil stocks specifically. So watch out for US API indications tomorrow and official US oil inventories on Thursday.
No sign of any kind of fire-sale of oil from Saudi Arabia yet. To what we can see, Saudi Arabia is not at all struggling to sell its oil. It only lowered its Official Selling Prices (OSPs) to Asia marginally for November. A surplus market + Saudi determination to sell its oil to the market would normally lead to a sharp lowering of Saudi OSPs to Asia. Not yet at least and not for November.
The 5yr contract close to fixed at $68/b. Of importance with respect to how far down oil can/will go. When the oil market moves into a surplus then the spot price starts to trade in a large discount to the 5yr contract. Typically $10-15/b below the 5yr contract on average in bear-years (2009, 2015, 2016, 2020). But the 5yr contract is usually pulled lower as well thus making this approach a moving target. But the 5yr contract price has now been rock solidly been pegged to $68/b since 2022. And in the 2022 bull-year (Brent spot average $99/b), the 5yr contract only went to $72/b on average. If we assume that the same goes for the downside and that 2026 is a bear-year then the 5yr goes to $64/b while the spot is trading at a $10-15/b discount to that. That would imply an average spot price next year of $49-54/b. But that is if OPEC doesn’t revert to cuts and instead keeps production flowing. We think OPEC(+) will trim/cut production as needed into 2026 to prevent a huge build-up in global oil stocks and a crash in prices. But for now we are still heading lower. Into the $50ies/b.
Some rebound but not much. Brent crude rebounded 1.5% yesterday to $65.47/b. This morning it is inching 0.2% up to $65.6/b. The lowest close last week was on Thursday at $64.11/b.
The curve structure is almost as week as it was before the weekend. The rebound we now have gotten post the message from OPEC+ over the weekend is to a large degree a rebound along the curve rather than much strengthening at the front-end of the curve. That part of the curve structure is almost as weak as it was last Thursday.
We are still on a weakening path. The message from OPEC+ over the weekend was we are still on a weakening path with rising supply from the group. It is just not as rapidly weakening as was feared ahead of the weekend when a quota hike of 500 kb/d/mth for November was discussed.
The Brent curve is on its way to full contango with Brent dipping into the $50ies/b. Thus the ongoing weakening we have had in the crude curve since the start of the year, and especially since early June, will continue until the Brent crude oil forward curve is in full contango along with visibly rising US and OECD oil inventories. The front-month Brent contract will then flip down towards the $60/b-line and below into the $50ies/b.
At what point will OPEC+ turn to cuts? The big question then becomes: When will OPEC+ turn around to make some cuts? At what (price) point will they choose to stabilize the market? Because for sure they will. Higher oil inventories, some more shedding of drilling rigs in US shale and Brent into the 50ies somewhere is probably where the group will step in.
There is nothing we have seen from the group so far which indicates that they will close their eyes, let the world drown in oil and the oil price crash to $40/b or below.
The message from OPEC+ is also about balance and stability. The world won’t drown in oil in 2026. The message from the group as far as we manage to interpret it is twofold: 1) Taking back market share which requires a lower price for non-OPEC+ to back off a bit, and 2) Oil market stability and balance. It is not just about 1. Thus fretting about how we are all going to drown in oil in 2026 is totally off the mark by just focusing on point 1.
When to buy cal 2026? Before Christmas when Brent hits $55/b and before OPEC+ holds its last meeting of the year which is likely to be in early December.
Brent crude oil prices have rebounded a bit along the forward curve. Not much strengthening in the structure of the curve. The front-end backwardation is not much stronger today than on its weakest level so far this year which was on Thursday last week.

The front-end backwardation fell to its weakest level so far this year on Thursday last week. A slight pickup yesterday and today, but still very close to the weakest year to date. More oil from OPEC+ in the coming months and softer demand and rising inventories. We are heading for yet softer levels.

Down to the lowest since early May. Brent crude has fallen sharply the latest four days. It closed at USD 64.11/b yesterday which is the lowest since early May. It is staging a 1.3% rebound this morning along with gains in both equities and industrial metals with an added touch of support from a softer USD on top.
What stands out the most to us this week is the collapse in the Dubai one to three months time-spread.
Dubai is medium sour crude. OPEC+ is in general medium sour crude production. Asian refineries are predominantly designed to process medium sour crude. So Dubai is the real measure of the balance between OPEC+ holding back or not versus Asian oil demand for consumption and stock building.
A sharp weakening of the front-end of the Dubai curve. The front-end of the Dubai crude curve has been holding out very solidly throughout this summer while the front-end of the Brent and WTI curves have been steadily softening. But the strength in the Dubai curve in our view was carrying the crude oil market in general. A source of strength in the crude oil market. The core of the strength.
The now finally sharp decline of the front-end of the Dubai crude curve is thus a strong shift. Weakness in the Dubai crude marker is weakness in the core of the oil market. The core which has helped to hold the oil market elevated.
Facts supports the weakening. Add in facts of Iraq lifting production from Kurdistan through Turkey. Saudi Arabia lifting production to 10 mb/d in September (normal production level) and lifting exports as well as domestic demand for oil for power for air con is fading along with summer heat. Add also in counter seasonal rise in US crude and product stocks last week. US oil stocks usually decline by 1.3 mb/week this time of year. Last week they instead rose 6.4 mb/week (+7.2 mb if including SPR). Total US commercial oil stocks are now only 2.1 mb below the 2015-19 seasonal average. US oil stocks normally decline from now to Christmas. If they instead continue to rise, then it will be strongly counter seasonal rise and will create a very strong bearish pressure on oil prices.
Will OPEC+ lift its voluntary quotas by zero, 137 kb/d, 500 kb/d or 1.5 mb/d? On Sunday of course OPEC+ will decide on how much to unwind of the remaining 1.5 mb/d of voluntary quotas for November. Will it be 137 kb/d yet again as for October? Will it be 500 kb/d as was talked about earlier this week? Or will it be a full unwind in one go of 1.5 mb/d? We think most likely now it will be at least 500 kb/d and possibly a full unwind. We discussed this in a not earlier this week: ”500 kb/d of voluntary quotas in October. But a full unwind of 1.5 mb/d”
The strength in the front-end of the Dubai curve held out through summer while Brent and WTI curve structures weakened steadily. That core strength helped to keep flat crude oil prices elevated close to the 70-line. Now also the Dubai curve has given in.

Brent crude oil forward curves

Total US commercial stocks now close to normal. Counter seasonal rise last week. Rest of year?

Total US crude and product stocks on a steady trend higher.


Guld och silver stiger hela tiden mot nya höjder
The Mid-East anchor dragging crude oil lower

Samtal om sällsynta jordartsmetaller, guld och silver

Brookfield köper bränsleceller för 5 miljarder USD av Bloom Energy för att driva AI-datacenter

Teck Resources kan förse Nordamerika och kanske hela G7 med all germanium som behövs

Tyskland har så höga elpriser att företag inte har råd att använda elektricitet

OPEC+ missar produktionsmål, stöder oljepriserna

Ett samtal om guld, olja, fjärrvärme och förnybar energi
Brent crude ticks higher on tension, but market structure stays soft

Guld nära 4000 USD och silver 50 USD, därför kan de fortsätta stiga
-
Nyheter4 veckor sedan
Tyskland har så höga elpriser att företag inte har råd att använda elektricitet
-
 Nyheter3 veckor sedan
OPEC+ missar produktionsmål, stöder oljepriserna
-
 Nyheter3 veckor sedan
Ett samtal om guld, olja, fjärrvärme och förnybar energi
-
Analys4 veckor sedan
Brent crude ticks higher on tension, but market structure stays soft
-
 Nyheter2 veckor sedan
Guld nära 4000 USD och silver 50 USD, därför kan de fortsätta stiga
-
Analys3 veckor sedan
Are Ukraine’s attacks on Russian energy infrastructure working?
-

 Nyheter3 veckor sedan
Guldpriset uppe på nya höjder, nu 3750 USD
-

 Nyheter2 veckor sedan
Blykalla och amerikanska Oklo inleder ett samarbete