

Analys
SIP Nordic – Råvaruguiden – februari 2013

 De flesta investerar i en enskild tillgång för att de tror på uppgång alternativt en nedgång i samma underliggande. Vad många ibland missar är att det finns goda möjligheter till avkastning om man investerar i en skillnad mellan två eller flera tillgångar. Ett sådant tillfälle finns nu i skillnaden i pris mellan guld och platina. Frågan är åt vilket håll det ska gå. Kanske dags för ett spread bet?
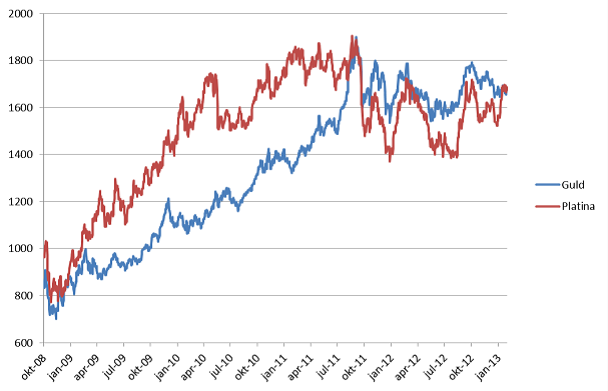
Platina och gulds utveckling sedan 2008. Guld har sedan september 2011 handlats till ett dyrare pris än platina. Något som nu kan ändras.
Historiskt har platina handlats på en högre nivå än guld men detta förändrades i september 2011. Detta till följd av att den dystra utsikten för den globala ekonomin drabbade industrimetaller, såsom platina, samtidigt som investerare sökte sig mot den säkra hamnen som guld ansågs vara. Skillnaden mellan priset var som mest drygt $200 i september 2012.
Trots att guld spås ha ännu ett år av positiv utveckling finns det mycket som talar för att platina kommer att utvecklas ännu bättre. (se text om guld och platina nedan)
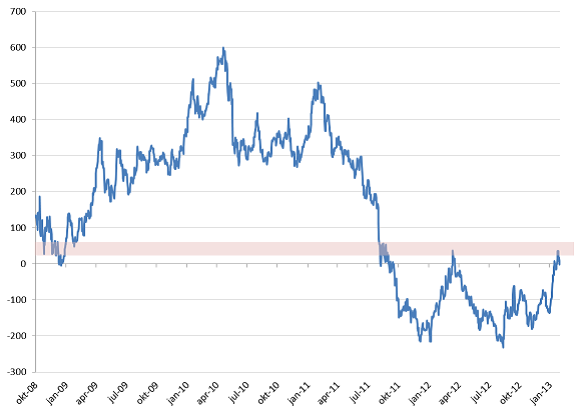
Skillnaden i pris mellan platina och guld (platina – guld) är återigen vid nollinjen. En nivå som tidigare testats.
Skillnaden i pris mellan guld och platina (spread) är nu åter vid nollinjen (se bild ovan). Om man tror att spreaden nu ska öka, till platinas fördel, kan man använda följande strategi.
Köp: MINILONG PLAT A
Köp: MINISHRT GULD P
Denna trade kan generera positiv avkastning om platinapriset ökar mer än vad guldpriset gör. Denna trade kan också vara fördelaktig även om både platina- och guldpriset tappar i värde. Så länge som guld tappar mer än platina.
Självklart fungerar det att spekulera i det motsatta. D.v.s. att skillnaden i pris mellan de två råvarorna kommer att öka till gulds fördel. Då kan man istället använda följande produkter.
Köp: MINILONG GULD G
Köp: MINISHRT PLAT B
Råvaror – Energi
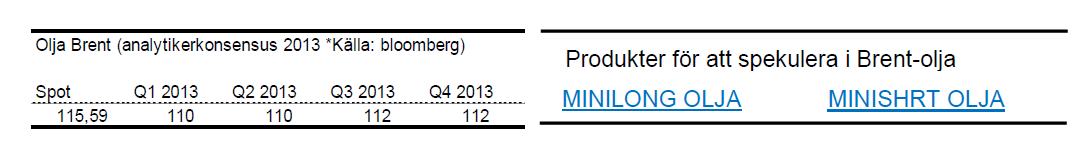
Brent olja
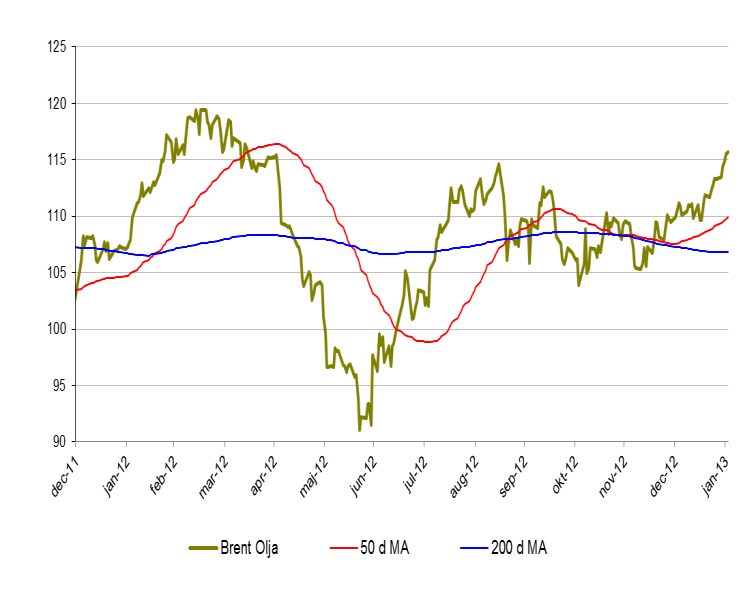
- Brentoljan har startat året mycket positivt. Upp dryga 5 % under januari månad.
- Brent närmar sig nu en viktig motståndsnivå kring $118 USD.
- Oljepriset steg under januari månad till följd av signaler på att den amerikanska ekonomin är på bättringsvägen. Något som spekulanter tror kan få fart på oljekonsumtionen igen.
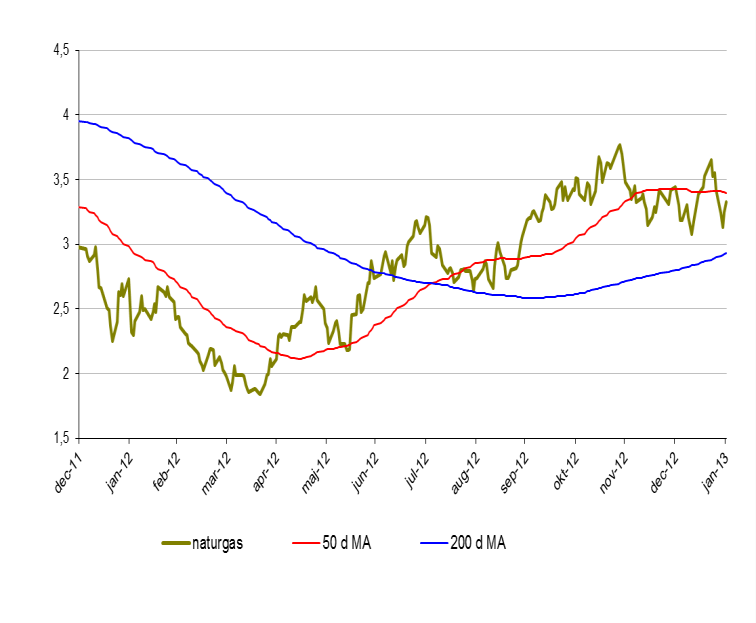
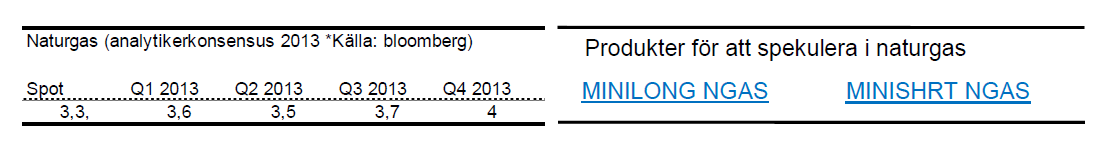
Naturgas
- Priset på naturgas föll under januari månad knappa 4 %.
- Lagren av naturgas är fortfarande höga. Ca 12 % över medelvärdet (5 år).
- Lagren är dock mindre jämfört med samma period förra året. Något som kan vända den negativa kortsiktiga trend som naturgas hade under januari.
Råvaror – Metaller
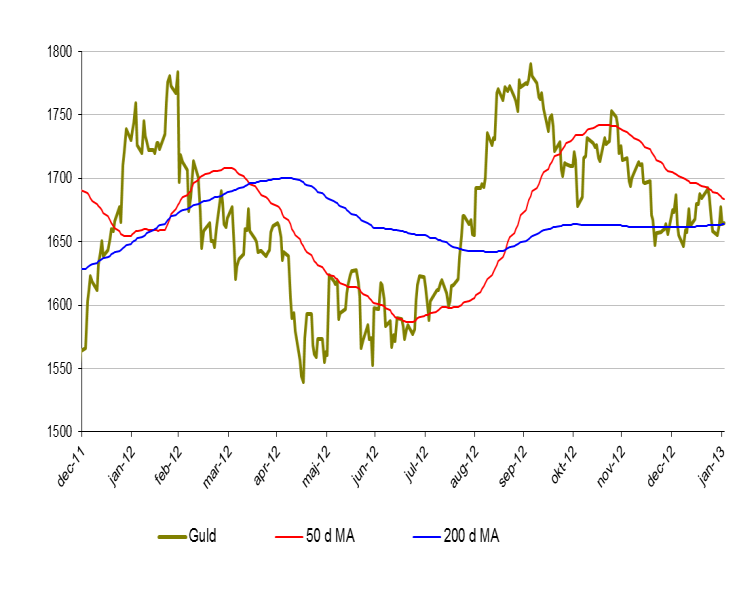
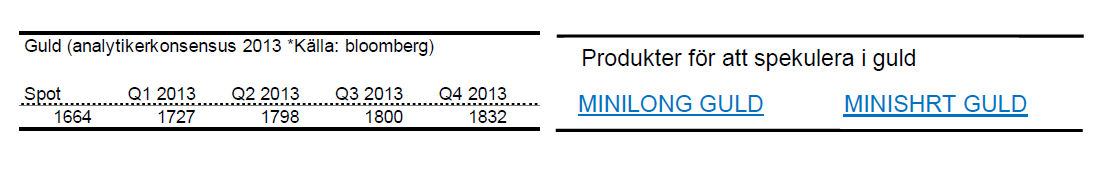
Guld
- Guldpriset ökade marginellt under januari. 0,4 % upp.
- Med signaler om en starkare global ekonomi i kombination med en större vilja att flytta pengar från ”säkra hamnar” till aktiemarknaden, kommer även en svagare guldutveckling.
- Rapporter om minskad handel av fysiskt guld i Asien jämfört med föregående år kan även påverka guldet negativt på kort sikt.
- Den amerikanska penningpolitiken kommer till stor del fortsatt styra utvecklingen av guldpriset.
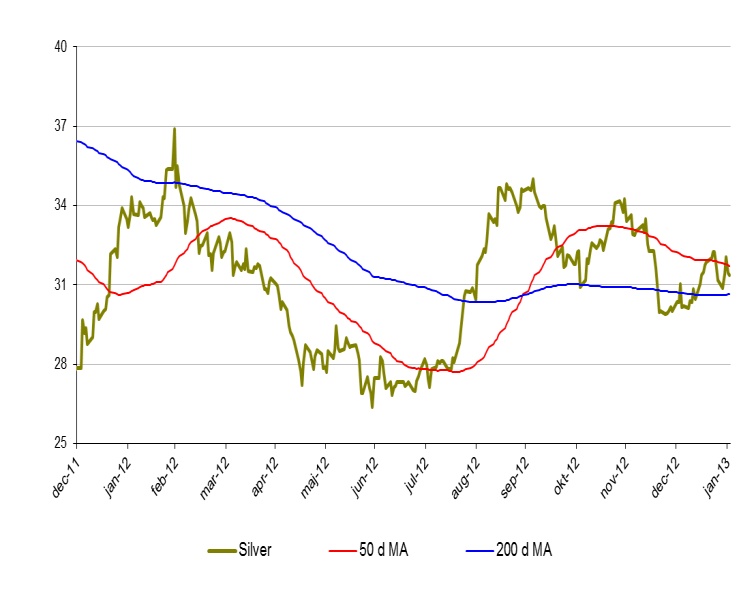
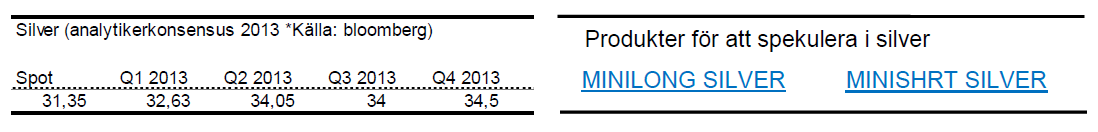
Silver
• Silver överpresterade guld under januari månad. Upp 4,7 %.
• Efterfrågan på fysiskt silver ökar.
• Indiens export av silver väntas öka med runt 30 % till följd av ökad efterfrågan.
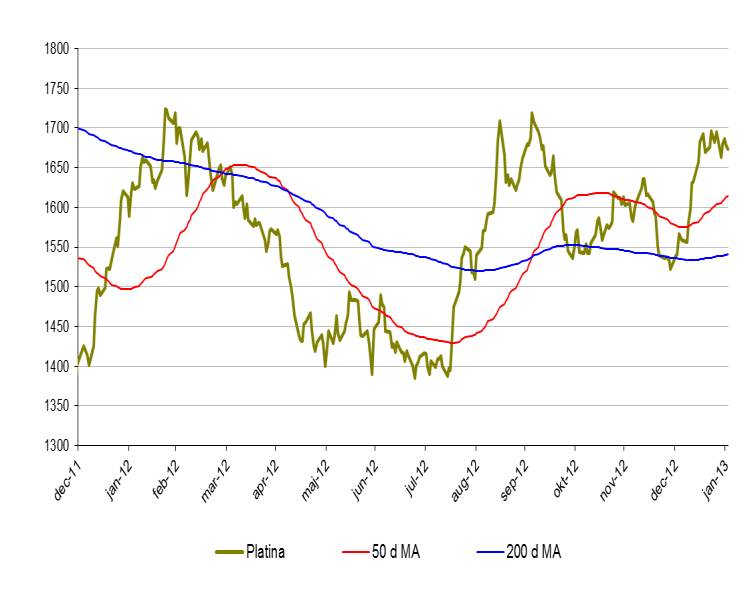
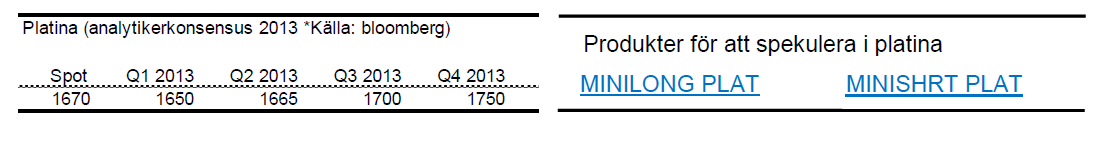
Platina
- Platinapriset steg kraftigt under januari. Upp nästan 10 % under januari månad.
- Detta gör att platina nu handlas till ett högre pris än guld. (Första gången sedan 2011)
- Nettopositionerna i platinaterminer är i stor övervikt för långa kontrakt.
- Efterfrågan på platina är hög samtidigt som produktionskostnaderna fortsatt är höga. Något som pressar priset uppåt.
- Sviterna efter de stora strejkerna i de Sydafrikanska gruvorna gör sig fortfarande påminda och gruvorna är inte än uppe i full produktionstakt.
- Sydafrika står för en mycket stor del av den globala platinaproduktionen.
Koppar
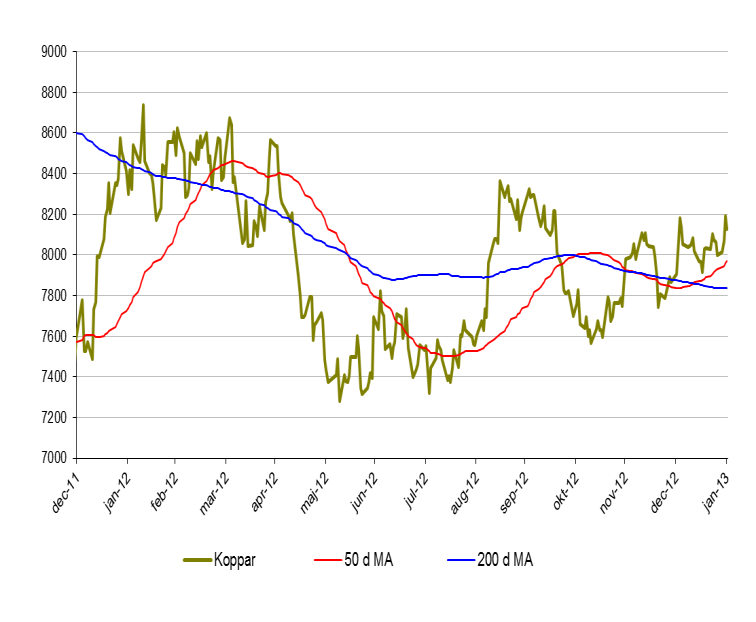
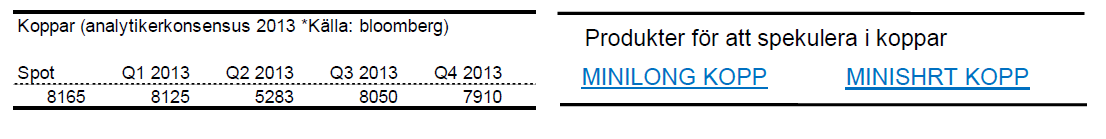
- Priset på koppar ökade 3,2 % under januari.
- Kopparproduktionen förväntas öka med cirka 3 % under 2013 till följd av ökad efterfrågan ibland annat Kina och Indien.
- Priset på industrimetallerna hjälps till stor del av en svagare USD.
Zink
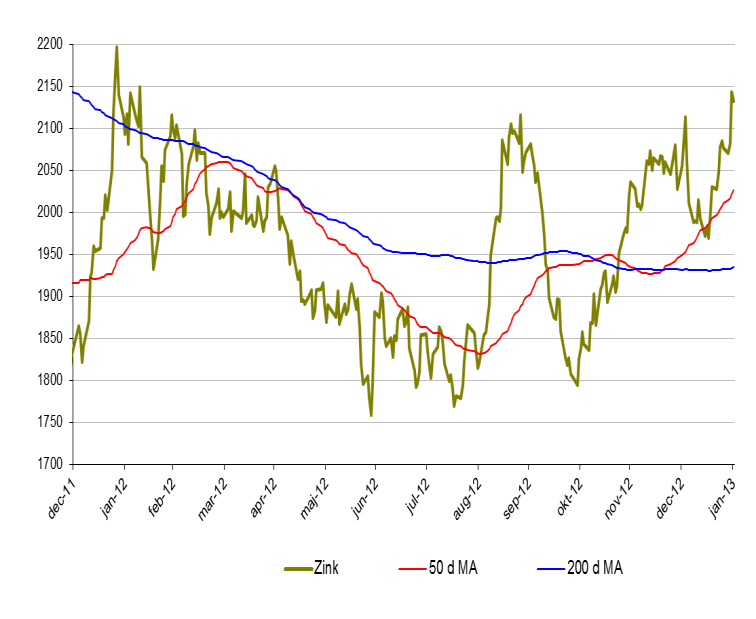
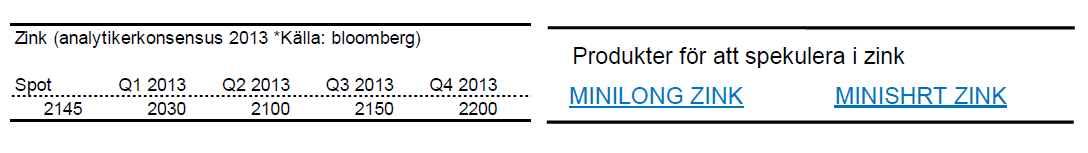
- Priset på zink åkte berg och dalbana under januari och stängde till slut 4,8 % upp.
- Likt andra basmetaller hjälper en svagare dollar kursen uppåt.
- Rapporter indikerar på en lägre produktionssiffra under 2013. Någon som kan få priset på zink att klättra ytterligare.
- Zink närmar sig nu viktiga nivåer kring 2150 där vi har en rad motståndsnivåer. Blir intressant att följa under 2013.
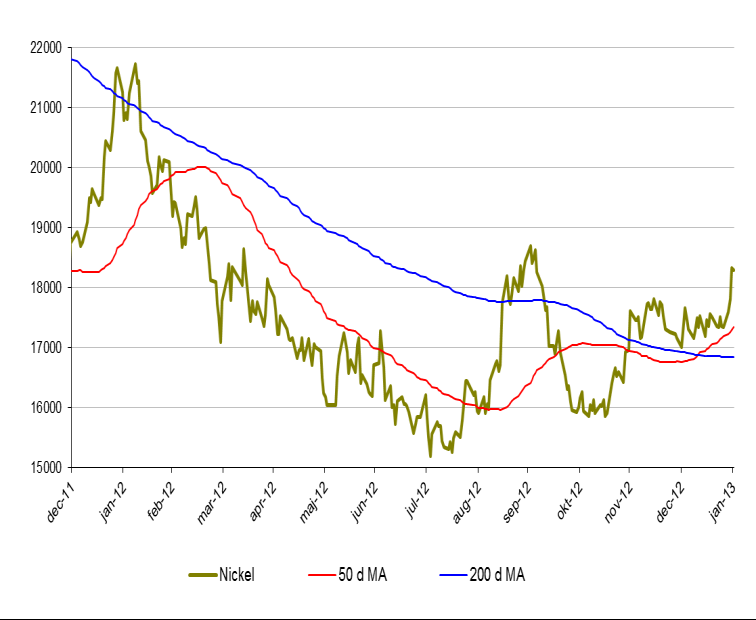
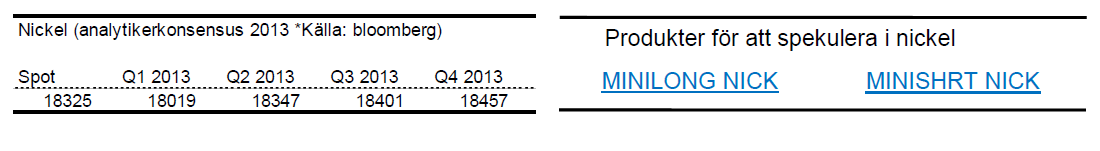
Nickel
- Nickel återhämtade nästan hela förra årets nedgång under januari. Upp 7,5 % totalt.
- Viktiga motståndsnivåer kring 18 400. Om detta område passeras är nästa nivå 22 000.
Råvaror – Jordbruk
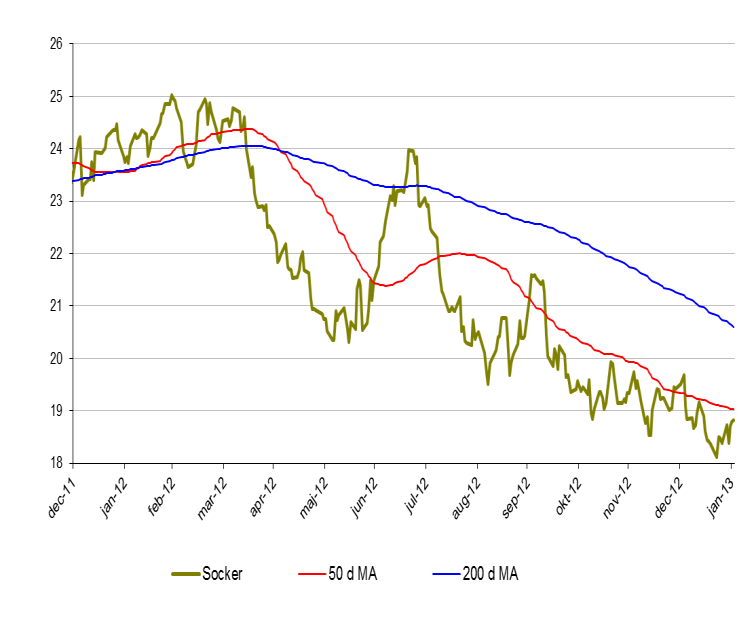
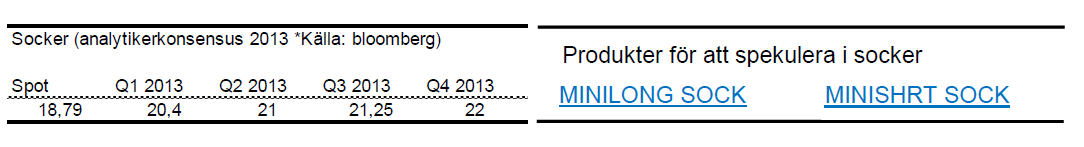
Socker
- Socker fortsätter i sin negativa trend. Ned 3 % i januari.
- Produktionen överstiger än konsumtionen kraftigt.
- Investerare ligger fortsatt i överhängande negativa positioner.
- Rapporter om att etanol ska åläggas en extra tullavgift i EU är inte positivt för socker som till viss del används för etanolproduktion.
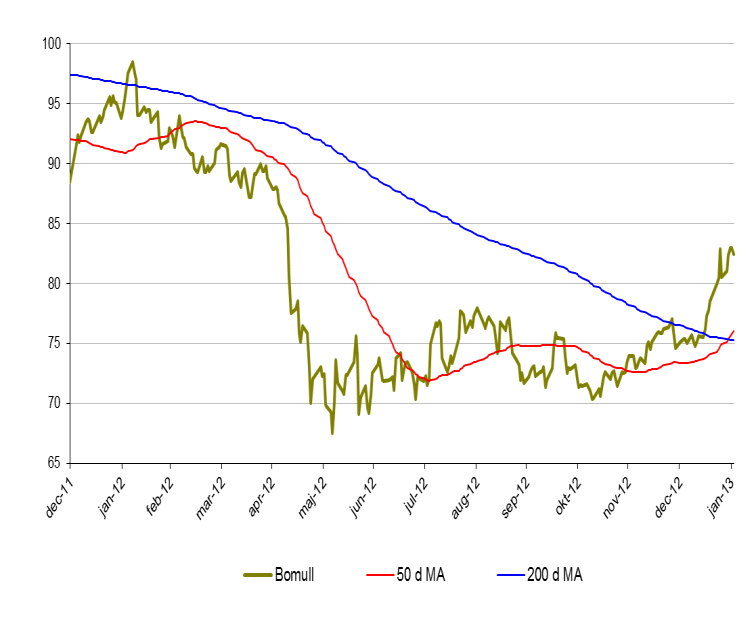
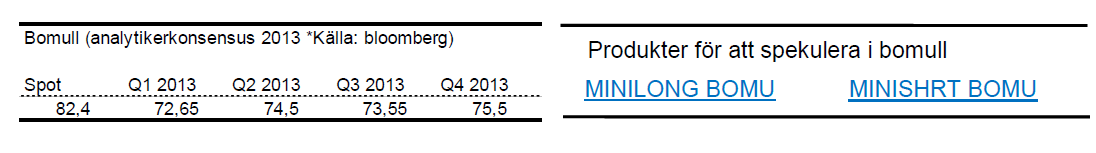
Bomull
- Bomull befinner sig i en kortsiktigt positiv trend. Sedan oktober förra året är bomull upp dryga 20 %.
- För januari är priset på bomull upp 11 %.
- Uppgången kan till stor härledas till en överaskande stark amerikansk och indisk export.
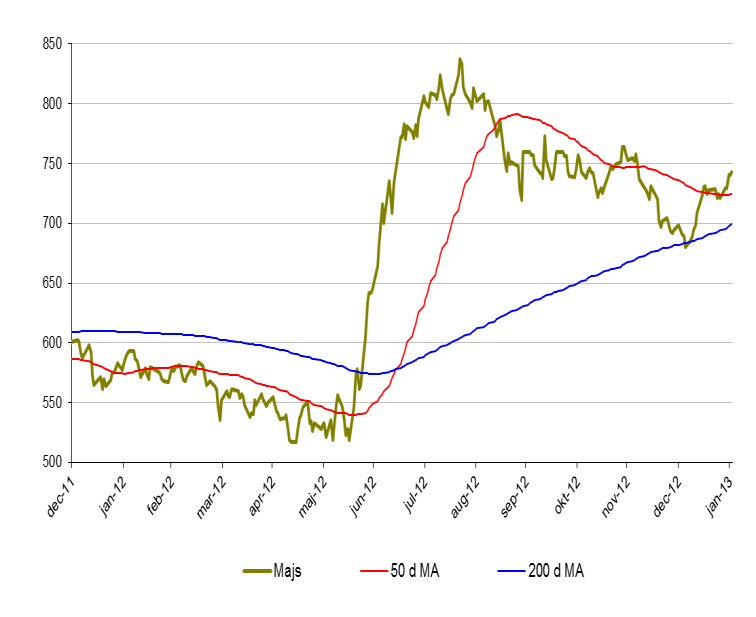
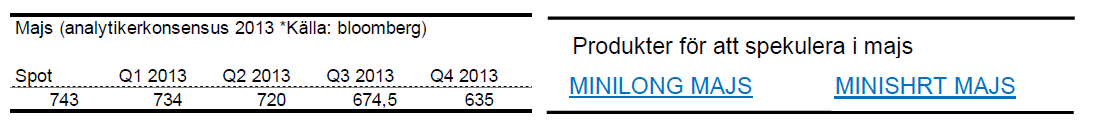
Majs
- För januari är majspriset upp 6,7 %.
- Uppgången kan dämpas då det spås att majsskörden kan bli mycket stor under sommaren 2013.
- Ytterligare faktorer som pekar på en avsvalnad kurs är lägre efterfrågan från etanol- och boskapsproducenter.
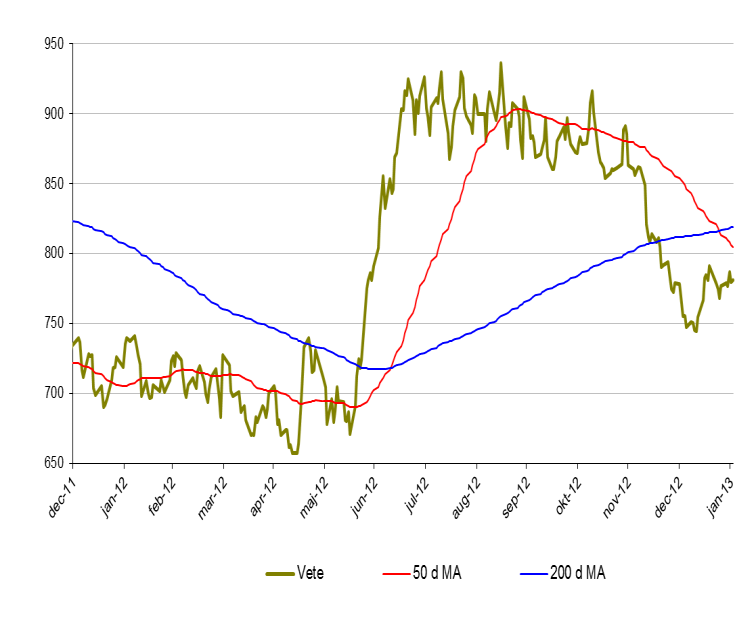
Vete
- Vete hade likt majs ett svängigt 2012.
- Under januari månad minskade priset på vete med 0,3 %.
- Den fortsatta utvecklingen för vete är osäker då det kommer tvetydiga rapporter om tillgång och efterfrågan.
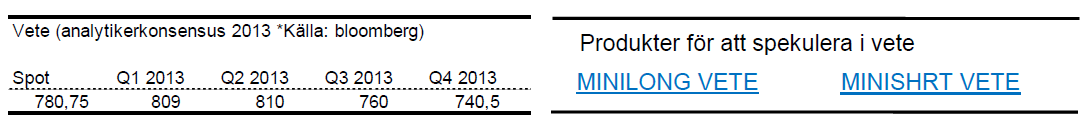
Apelsinjuice
- Apelsinjuice är i stort sett oförändrat under januari.
- Apelsinjuice befinner sig dock i ett mycket intressant läge där den negativa trenden nu verkar ha bytts mot det positiva.
- Viktiga nivåer kring 123 cents.
- Priset på apelsinjuice är fortfarande 70 % högre än botten 2009. Fallhöjden är således hög. Mycket hög.
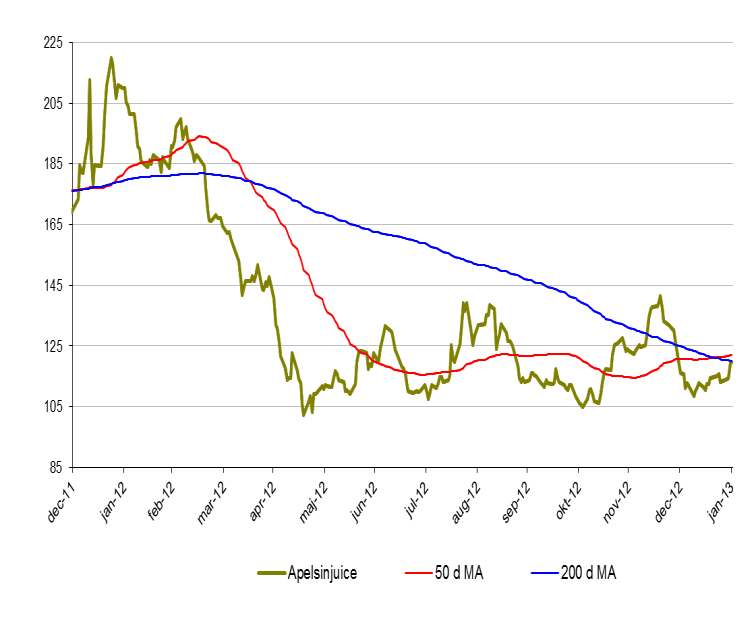
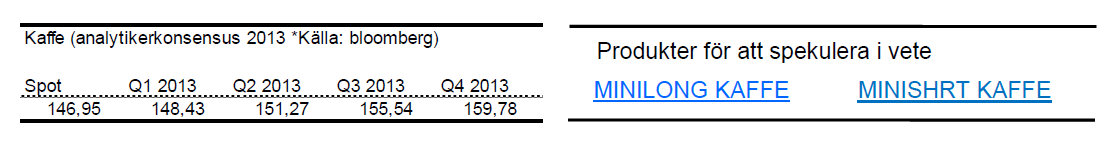
Kaffe
- Kaffe utvecklades under januari svagt uppåt. + 0,6 %.
- Kaffe kan mycket väl utvecklas positivt framöver till följd av låg produktion ibland annat Guatemala. Plantorna har i dessa regioner angripits av mögel vilket dämpar tillgången.
[box]Denna uppdatering är producerat av SIP Nordic och publiceras i samarbete och med tillstånd på Råvarumarknaden.se[/box]
Ansvarsbegränsning
Detta produktblad utgör endast marknadsföring och har sammanställts av SIP Nordic Fondkommission AB.
Innehållet ger inte fullständig information avseende det finansiella instrumentet. Investerare uppmanas att del av prospekt och slutliga villkor, vilka finns tillgängliga på: www.rbsbank.se/markets, innan ett investeringsbeslut tas.
Förekommande exempel är simulerade och baseras på SIP Nordics egna beräkningar och antaganden, en person som använder andra data eller antaganden kan nå andra resultat. Administrativa avgifter och transaktionsavgifter påverkar den faktiska avkastningen.

Parts of the Brent crude curve dipping into the high $50ies/b. Brent crude fell 2.3% over the week to Friday. It closed the week at $61.29/b, a slight gain on the day, but also traded to a low of $60.14/b that same day and just barely avoided trading into the $50ies/b. This morning it is risk-on in equities which seems to help industrial metals a little higher. But no such luck for oil. It is down 0.8% at $60.8/b. This week looks set for Brent crude to dip its feet in the $50ies/b. The Brent 3mth contract actually traded into the high $50ies/b on Friday.

The front-end backwardation has been on a weakening foot and is now about to fully disappear. The lowest point of the crude oil curve has also moved steadily lower and lower and its discount to the 5yr contract is now $6.8/b. A solid contango. The Brent 3mth contract did actually dip into the $50ies/b intraday on Friday when it traded to a low point of $59.93/b.
More weakness to come as lots of oil at sea comes to ports. Mid-East OPEC countries have boosted exports along with lower post summer consumption and higher production. The result is highly visibly in oil at sea which increased by 17 mb to 1,311 mb over the week to Sunday. Up 185 mb since mid-August. On its way to discharge at a port somewhere over the coming month or two.
Don’t forget that the oil market path ahead is all down to OPEC+. Remember that what is playing out in the oil market now is all by design by OPEC+. The group has decided that the unwind of the voluntary cuts is what it wants to do. In a combination of meeting demand from consumers as well as taking back market share. But we need to remember that how this plays out going forward is all at the mercy of what OPEC+ decides to do. It will halt the unwinding at some point. It will revert to cuts instead of unwind at some point.
A few months with Brent at $55/b and 40-50 US shale oil rigs kicked out may be what is needed. We think OPEC+ needs to see the exit of another 40-50 drilling rigs in the US shale oil patches to set US shale oil production on a path to of a 1 mb/d year on year decline Dec-25 to Dec-26. We are not there yet. But a 2-3 months period with Brent crude averaging $55/b would probably do it.
Oil on water increased 17 mb over the week to Sunday while oil in transit increased by 23 mb. So less oil was standing still. More was moving.

Crude oil floating storage (stationary more than 7 days). Down 11 mb over week to Sunday

The lowest point of the Brent crude oil curve versus the 5yr contract. Weakest so far this year.

Crude oil 1mth to 3mth time-spreads. Dubai held out strongly through summer, but then that center of strength fell apart in late September and has been leading weakness in crude curves lower since then.

Rebounding along with most markets. But concerns over solidity of Gaza peace may also contribute. Brent crude fell 0.8% yesterday to $61.91/b and its lowest close since May this year. This morning it is bouncing up 0.9% to $62.5/b along with a softer USD amid positive sentiment with both equities and industrial metals moving higher. Concerns that the peace in Gaza may be less solid than what one might hope for also yields some support to Brent. Bets on tech stocks are rebounding, defying fears of trade war. Money moving back into markets. Gold continues upwards its strong trend and a softer dollar helps it higher today as well.
US crude & products probably rose 5.6 mb last week (API) versus a normal seasonal decline of 2.4 mb. The US API last night partial and thus indicative data for US oil inventories. Their data indicates that US crude stocks rose 7.4 mb last week, gasoline stocks rose 3.0 mb while Distillate stocks fell 4.8 mb. Altogether an increase in commercial crude and product stocks of 5.6 mb. Commercial US crude and product stocks normally decline by 2.4 mb this time of year. So seasonally adjusted the US inventories rose 8 mb last week according to the indicative numbers by the API. That is a lot. Also, the counter seasonal trend of rising stocks versus normally declining stocks this time of year looks on a solid pace of continuation. If the API is correct then total US crude and product stocks would stand 41 mb higher than one year ago and 6 mb higher than the 2015-19 average. And if we combine this with our knowledge of a sharp increase in production and exports by OPEC(+) and a large increase in oil at sea, then the current trend in US oil inventories looks set to continue. So higher stocks and lower crude oil prices until OPEC(+) switch to cuts. Actual US oil inventory data today at 18:00 CET.
US commercial crude and product stocks rising to 1293 mb in week 41 if last nights indicative numbers from API are correct.

Crude oil soon coming to a port near you. OPEC has lifted production sharply higher this autumn. At the same time demand for oil in the Middle-East has fallen as we have moved out of summer heat and crude oil burn for power for air-conditioning. The Middle-East oil producers have thus been able to lift exports higher on both accounts. Crude oil and condensates on water has shot up by 177 mb since mid-August. This oil is now on its way to ports around the world. And when they arrive, it will likely help to lift stocks onshore higher. That is probably when we will lose the last bit of front-end backwardation the the crude oil curves. That will help to drive the front-month Brent crude oil price down to the $60/b line and revisit the high $50ies/b. Then the eyes will be all back on OPEC+ when they meet in early November and then again in early December.
Crude oil and condensates at sea have moved straight up by 177 mb since mid-August as OPEC(+) has produced more, consumed less and exported more.

When it starts to move lower it moves rather quickly. Gaza, China, IEA. Brent crude is down 2.1% today to $62/b after having traded as high as $66.58/b last Thursday and above $70/b in late September. The sell-off follows the truce/peace in Gaze, a flareup in US-China trade and yet another bearish oil outlook from the IEA.
A lasting peace in Gaze could drive crude oil at sea to onshore stocks. A lasting peace in Gaza would probably calm down the Houthis and thus allow more normal shipments of crude oil to sail through the Suez Canal, the Red Sea and out through the Bab-el-Mandeb Strait. Crude oil at sea has risen from 48 mb in April to now 91 mb versus a pre-Covid normal of about 50-60 mb. The rise to 91 mb is probably the result of crude sailing around Africa to be shot to pieces by the Houthis. If sailings were to normalize through the Suez Canal, then it could free up some 40 mb in transit at sea moving onshore into stocks.
The US-China trade conflict is of course bearish for demand if it continues.
Bearish IEA yet again. Getting closer to 2026. Credibility rises. We expect OPEC to cut end of 2025. The bearish monthly report from the IEA is what it is, but the closer we get to 2026, the more likely the IEA is of being ball-park right in its outlook. In its monthly report today the IEA estimates that the need for crude oil from OPEC in 2026 will be 25.4 mb/d versus production by the group in September of 29.1 mb/d. The group thus needs to do some serious cutting at the end of 2025 if it wants to keep the market balanced and avoid inventories from skyrocketing. Given that IEA is correct that is. We do however expect OPEC to implement cuts to avoid a large increase in inventories in Q1-26. The group will probably revert to cuts either at its early December meeting when they discuss production for January or in early January when they discuss production for February. The oil price will likely head yet lower until the group reverts to cuts.
Dubai: The Mid-East anchor dragging crude oil lower. Surplus emerging in Mid-East pricing. Crude oil prices held surprisingly strong all through the summer. A sign and a key source of that strength came from the strength in the front-end backwardation of the Dubai crude oil curve. It held out strong from mid-June and all until late September with an average 1-3mth time-spread premium of $1.8/b from mid-June to end of September. The 1-3mth time-spreads for Brent and WTI however were in steady deterioration from late June while their flat prices probably were held up by the strength coming from the Persian Gulf. Then in late September the strength in the Dubai curve suddenly collapsed. Since the start of October it has been weaker than both the Brent and the WTI curves. The Dubai 1-3mth time-spread now only stands at $0.25/b. The Middle East is now exporting more as it is producing more and also consuming less following elevated summer crude burn for power (Aircon) etc.
The only bear-element missing is a sudden and solid rise in OECD stocks. The only thing that is missing for the bear-case everyone have been waiting for is a solid, visible rise in OECD stocks in general and US oil stocks specifically. So watch out for US API indications tomorrow and official US oil inventories on Thursday.
No sign of any kind of fire-sale of oil from Saudi Arabia yet. To what we can see, Saudi Arabia is not at all struggling to sell its oil. It only lowered its Official Selling Prices (OSPs) to Asia marginally for November. A surplus market + Saudi determination to sell its oil to the market would normally lead to a sharp lowering of Saudi OSPs to Asia. Not yet at least and not for November.
The 5yr contract close to fixed at $68/b. Of importance with respect to how far down oil can/will go. When the oil market moves into a surplus then the spot price starts to trade in a large discount to the 5yr contract. Typically $10-15/b below the 5yr contract on average in bear-years (2009, 2015, 2016, 2020). But the 5yr contract is usually pulled lower as well thus making this approach a moving target. But the 5yr contract price has now been rock solidly been pegged to $68/b since 2022. And in the 2022 bull-year (Brent spot average $99/b), the 5yr contract only went to $72/b on average. If we assume that the same goes for the downside and that 2026 is a bear-year then the 5yr goes to $64/b while the spot is trading at a $10-15/b discount to that. That would imply an average spot price next year of $49-54/b. But that is if OPEC doesn’t revert to cuts and instead keeps production flowing. We think OPEC(+) will trim/cut production as needed into 2026 to prevent a huge build-up in global oil stocks and a crash in prices. But for now we are still heading lower. Into the $50ies/b.


Gruvbolaget Boliden överträffade analytikernas förväntningar

Australien och USA investerar 8,5 miljarder USD för försörjningskedja av kritiska mineraler
Brent crude set to dip its feet into the high $50ies/b this week

Vad guldets uppgång egentligen betyder för världen

Spotpriset på guld över 4300 USD och silver över 54 USD

OPEC+ missar produktionsmål, stöder oljepriserna

Goldman Sachs höjer prognosen för guld, tror priset når 4900 USD

Blykalla och amerikanska Oklo inleder ett samarbete
Guld nära 4000 USD och silver 50 USD, därför kan de fortsätta stiga
Are Ukraine’s attacks on Russian energy infrastructure working?
-
 Nyheter4 veckor sedan
OPEC+ missar produktionsmål, stöder oljepriserna
-
 Nyheter2 veckor sedan
Goldman Sachs höjer prognosen för guld, tror priset når 4900 USD
-
 Nyheter3 veckor sedan
Blykalla och amerikanska Oklo inleder ett samarbete
-
 Nyheter3 veckor sedan
Guld nära 4000 USD och silver 50 USD, därför kan de fortsätta stiga
-
Analys4 veckor sedan
Are Ukraine’s attacks on Russian energy infrastructure working?
-

 Nyheter2 veckor sedan
Leading Edge Materials är på rätt plats i rätt tid
-

 Nyheter3 veckor sedan
Ett samtal om guld, olja, koppar och stål
-

 Nyheter2 veckor sedan
Nytt prisrekord, guld stiger över 4000 USD