

Analys
SEB Jordbruksprodukter, 4 februari 2013

 Prisförändringarna på terminsmarknaderna för jordbruksprodukter var marginella förra veckan. Vetepriserna var i princip oförändrade. Sojabönorna handlades upp ett par tre procent på de första indikationerna att hektarskörden i Brasilien är lite sämre än väntat. Rapspriserna på Matif påverkades dock inte. I motsatt riktning – och den andra råvaran som rörde sig prismässigt över huvud taget var mjölk. Priserna på smör och mjölk på Eurex sjönk med ett par procent – och följer därmed efter det tidigare prisfallet på Class III – mjölk i USA.
 Den här veckan avslutas på fredag med den andra WASDE-rapporten i år. Klockan 18:00 släpper det amerikanska jordbruksdepartementet siffrorna. Vi återkommer senare under veckan med marknadens förväntningar inför den.
Odlingsväder
Europa fick snöfall som blev regn i södra Europa. Den västra delen av Ryssland och Ukraina fick milt väder, som gjorde att det skyddande snötäcket smälte på sina håll. Sydostasien fick riklig monsunnederbörd, som är bra för risproduktionen. Argentina fortsatte att vara torrt. Det ger en snabbare mognad, men riskerar också att ge en mindre skörd. Brasilien i söder berörs av samma torra väder som i norra Argentina. Längre uppåt landet föll god nederbörd.
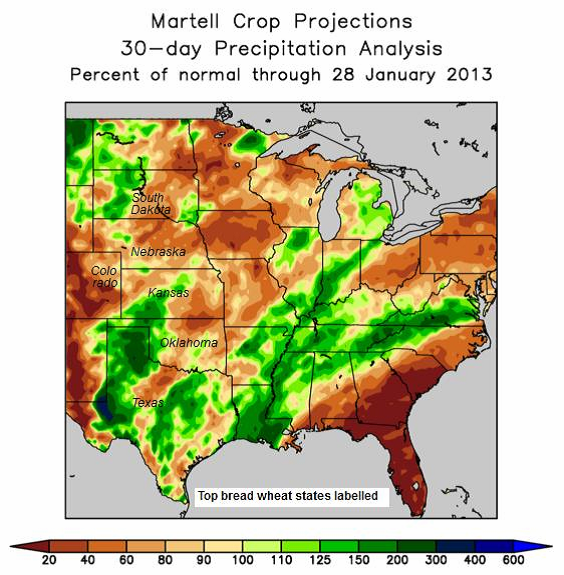
Torkan i USA ligger kvar på nästan exakt samma höga nivå som varit rådande sedan början av december.
 Vi fick ett mail från den amerikanska börsen CME, där CBOT ingår, om att de troligtvis kommer att reducera sina öppettider för handel med spannmål / oljeväxter som ett svar på synpunkter från branschen. Börsen, som just nu håller på med en undersökning bland sina kunder gällande öppettiderna, säger att även om inte undersökningen är komplett så har de redan fått tillräckligt med svar för att reducera öppettiderna för handel med terminer på spannmål och sojabönor, och avvaktar nu godkännande från CFTC.
En reducering av öppettiderna skulle delvis vara en återgång av CME:s kontroversiella beslut under 2012 att utöka öppettiderna. Börsen säger samtidigt att det finns flera olika uppfattningar om när marknaden ska vara öppen framöver och att de därför återkommer med fler detaljer under de kommande veckorna.
CME säger också att de är öppna för att överväga stopp av handeln under publiceringen av USDA:s viktigaste rapporter (bl.a WASDE) månadsvis och kvartalsvis. Konkurrenten ICE, vars lansering av terminskontrakt för spannmål och oljeväxter fick CME att utöka sina öppettider, har dock inga planer på att göra några förändringar av sina öppettider.
Vete
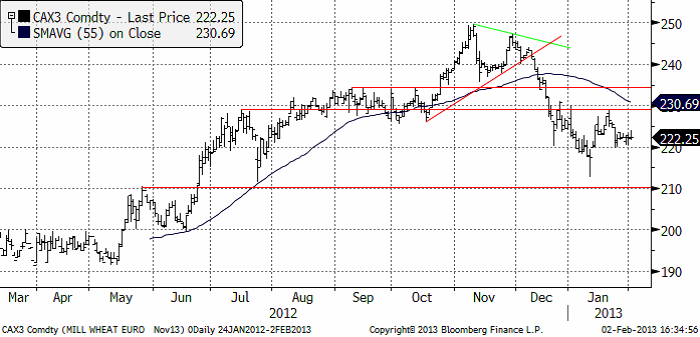
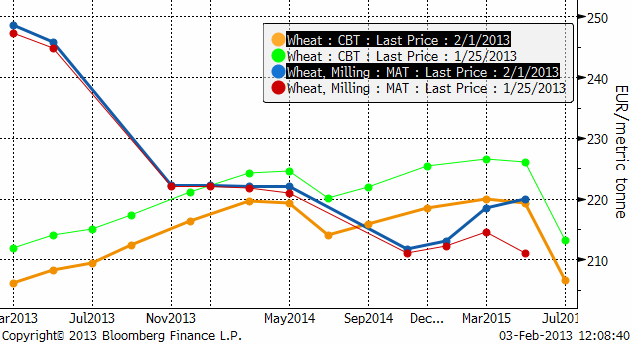
Priset på november (2013) kontraktet stabiliserade sig stödet vid 220 euro i veckan.
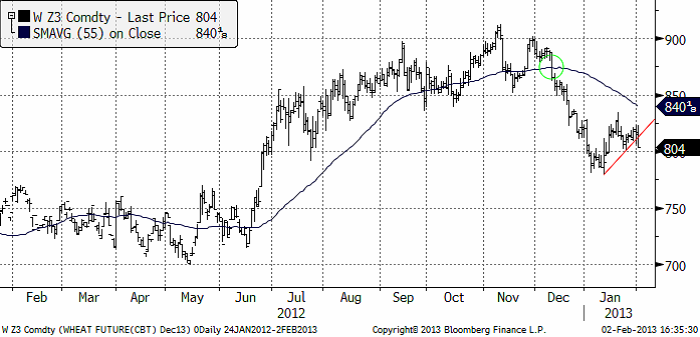
Nedan ser vi decemberkontraktet på CBOT, där det tekniska stödet bröts sent på fredagseftermiddagen. Detta signalerar prisfall, men 800 cent / bu är å andra sidan ett psykologiskt motstånd. Hela den tekniska bilden talar dock för lägre priser.
Efter de senaste dagarna med gatuvåld och månader av politisk oro gick Egyptens försvarsminister ut med den kraftiga varningen att ”en fortsättning av konflikten mellan de olika politiska krafterna och deras olikheter över hur landet ska styras kan leda till att staten kollapsar och därmed hota framtida generationer”. Egypten står inför en allt större ekonomisk och politisk instabilitet, där det egyptiska pundet har förlorat mer än en tiondel av sitt värde sedan revolutionen 2011. Många egyptier är beroende av det subventionerade bröd som säljs för ca 0.05 kr och störningar av brödutbudet skulle kunna leda till ytterligare oroligheter. Egyptens GASC har under januari månad köpt 115 000 ton vete för leverans 20-28 februari, vilket endast är hälften så mycket som under januari 2012. Fortsatta oroligheter kan leda till svårigheter att finansiera inköp av vete, men enligt GASC så har man vare sig finansiella problem och dessutom lager fram till mitten/slutet på juni, något som dock ifrågasätts om det verkligen stämmer.
Sådden av vete i Kanada, kan förmodligen komma att stiga med så mycket som 10 procent som en följd av ökad areal och höga priser enligt CWB (Canadian Wheat Board). Arealen kan komma att öka med 5-10 procent jämfört med förra årets 9.63 miljoner hektar, då lantbrukare skiftar till vete från andra mindre lönsamma grödor som t.ex oljeväxter och råg. Förra årets sådd av vårvete uppgick till 6.85 miljoner hektar, vilket motsvarar 71 procent av den totala vetearealen, inklusive höstgrödorna och durumvete. Den totala skörden av samtliga vetesorter uppgick till 27.2 mt under 2012/13.
Enligt AgCanada kan den kanadensiska produktionen av vete, inklusive durum, 2013/14 komma att öka med 4.8 procent till 28.5 mt, tack vare ökad areal. I veckan publicerades årets första gissning om arealen för årets veteproduktion. 25.3 miljoner acres är 1.5 mA mer än förra året.
Trots ökad nederbörd under januari månad över sydvästra Kansas, västra Oklahoma och delar av Texas, så visar USDA’s senaste rapport att tillståndet för det amerikanska vetet har förvärrats. Tillståndet för vete i Kansas, den största producenten av höstgrödan, har justerats ned från månaden innan då den värsta torkan i USA sedan 1930-talet kvarstår. 20 procent av grödan klassas nu som ”good/excellent”, där endast 1 procent tillhör ”excellent”, jämfört med 24 procent i slutet av december. 39 procent klassas som ”poor/very poor” jämfört med 35 procent månaden innan. I den sista rikstäckande rapporten som USDA skickade ut i slutet på november var 29 procent av höstvetet klassat som ”good/excellent”, vilket är den lägsta nivån sedan åtminstone 1985 då man började föra register. Än värre är det i Oklahoma, den näst största producenten, där endast 5 procent är klassat som ”good” (11 procent månaden innan) medan ”poor/very poor” uppgår till höga 69 procent.
I Nebraska klassas 8 procent som ”good/excellent” och 50 procent som ”poor/very poor”, medan i South Dakota tillhör 3 procent ”good/excellent” medan 66 procent är klassat som ”poor/very poor”.
Argentina har i princip sålt sitt vete (det mesta till Brasilien).
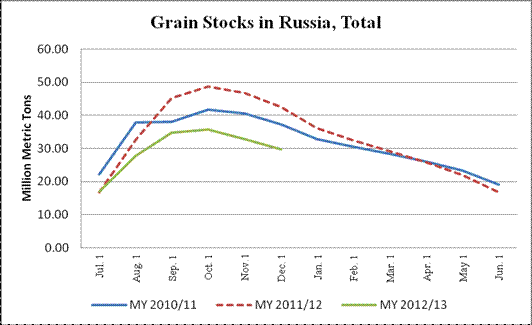
I EU var det en vecka tunn på exportsidan. I Ryssland rapporterades vetelagren uppgå till 13 mt vid årsskiftet. Det är 40% mindre än förra året. Det innebär att Ryssland når botten på lagren i slutet av april.
Enligt den fristående analytikern Noel Fryer är Rysslands importbehov samtalsämnet för dagen i Svartahavsområdet. I fredags hölls ett möte i Moskva om att eventuellt ta bort importtullen om 5% på vete, men inget kom ut av det. Ett nytt möte ska hållas nästa vecka där Medvedev ska vara ordförande.
De inhemska spannmålspriserna i Ryssland har fortsatt att stiga som en följd av markant lägre lager pga av en mindre skörd i kombinationen med en stark export i början av säsongen. Enligt Rosstat uppgick Rysslands totala skörd av spannmål och baljväxter till 70.7 mt jämfört med 94.2 mt året innan, varav 37.7 mt vete och 8 mt majs. Skörden av vete är därmed den lägsta på ett decennium, medan skörden av majs är rekordhög.
Det inhemska priset på kvarnvete i Ryssland steg till nya rekordnivåer under förra veckan, över 2008 års priser. I diagrammet nedan ser vi de totala spannmålslagren i Ryssland.
Rysslands export av spannmål 2012/13 estimeras till 14.8 mt, och de har redan exporterat 13.5 mt spannmål den här säsongen inklusive 10 mt vete. Importen av spannmål förväntas uppgå till 1.2 mt och under perioden juli-december har landet importerat 486 000 ton, varav merparten från Kazakstan. För 2013/14 förväntas produktionen att uppgå till 95 mt, vilket skulle generera ett överskott till export på 15 mt.
GASC har samtidigt, som nämnt ovan, sagt att de har fulla lager, vilket är anledningen till att de inte köpte så mycket i den senaste tendern. Däremot sade de att de har finanserna i ordning för att köpa mer när de behöver. Det kan alltså bli konkurrens om vetet framåt våren.
Vi ser att detta återspeglade sig i rörelsen i terminskurvan, som gick ännu mer in i backwardation på Matif. De korta kontrakten mars och maj för gammal skörd steg, medan november (ny skörd) inte förändrades alls mellan fredagen den 25 januari och den 1 februari.
I diagrammet ovan ser vi också tydligt att hela terminskurvan för Chicagovete föll ganska kraftigt. Ingen mannamån alls. De längre kontrakten något mer i pris, i synnerhet för leverans av 2014 års skörd.
Vi fortsätter vår neutrala vy på vetet. Tekniskt lutar det åt lägre pris. Den fundamentala informationen förebådar tilltagande oro på vetemarknaden i vår och torkan i USA ser inte ut att lätta.
Maltkorn
I diagrammet ovan ser vi också tydligt att hela terminskurvan för Chicagovete föll ganska kraftigt. Ingen mannamån alls. De längre kontrakten något mer i pris, i synnerhet för leverans av 2014 års skörd. Vi fortsätter vår neutrala vy på vetet. Tekniskt lutar det åt lägre pris. Den fundamentala informationen förebådar tilltagande oro på vetemarknaden i vår och torkan i USA ser inte ut att lätta.
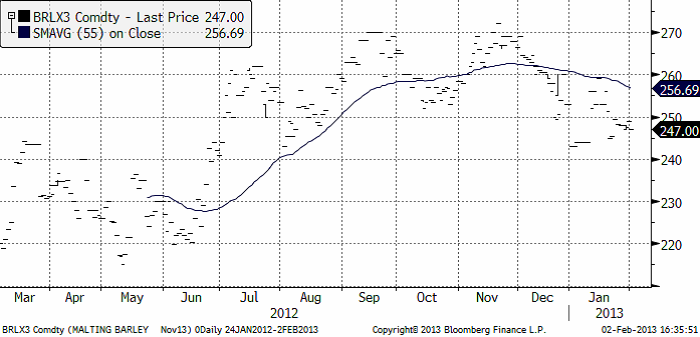
November 2013-kontraktet sjönk för andra veckan i rad, från 248.25 till 247 euro per ton.
Majs
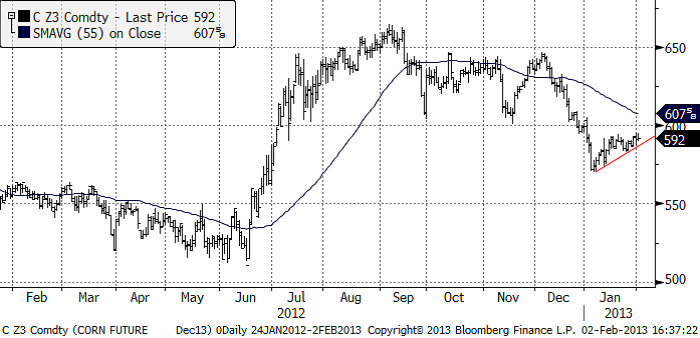
Majspriset (december 2013) fortsatte sin rekyl uppåt, men slutade veckan med prisnedgångar. Priset ligger fortsatte för andra veckan att glida uppåt precis dikt an det tekniska stödet. När nu rekylen tagit priset upp till strax under den jämna siffran 600 cent, ”borde” uppgången ta slut. Stödet ”borde” brytas och priset falla ner till åtminstone 575 cent i första hand och 550 cent i andra hand.
Veckovis etanolproduktion i USA sjönk till en rekordlåg nivå 700 fat per dag, som vi ser i diagrammet nedan. Det är den lägsta produktionsnivån sedan DOE började publicera produktionsstatistiken varje vecka. Den senaste noteringen är för veckan som slutade fredagen den 25 januari.
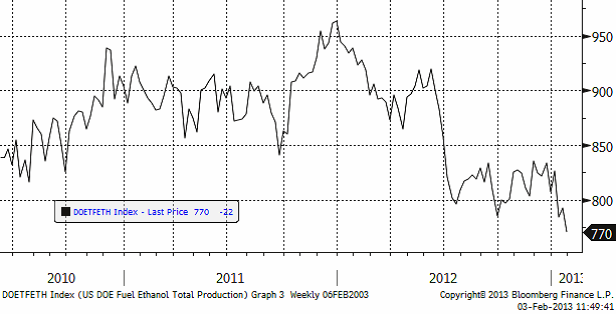
Det höga priset på majs sköter alltså sitt ransoneringsjobb ganska bra när det gäller majs. Etanol är inte livsviktigt heller, till skillnad från vete, t ex. En rekordskörd väntas i USA. WASDE-rapporten på fredag kommer kanske att kasta än mer ljus över utbuds- och efterfråge-ekvationerna. Mer klarhet kan säkerligen få marknadens oro att dämpa sig.
Enligt BAGE är Argentinas sådd av majs klar till 98.7 procent, jämfört med 96.4 procent förra veckan. Pablo Adreani, AgriPac Consultores, säger att han kan komma att justera ned sitt estimat för Argentinas majs produktion 2012/13 till 25.5 mt, jämfört med tidigare estimat om 27.1 mt.
I Brasilien sås nu den andra skörden ”safrinha”. Skörden väntas till sommaren. Cordonnier’s estimat för Brasiliens produktion av majs 2012/13 är oförändrad från tidigare estimat på 70 mt, och även Argentinas majsproduktion 2012/13 är oförändrat på 22.5 mt. El Tejar Ltd uppskattar Argentinas produktion av majs till 24-25 mt.
Vi fortsätter att ha en neutral vy på majs. Skulle det tekniska stödet i diagrammet för december-majs brytas vill vi sälja.
Sojabönor
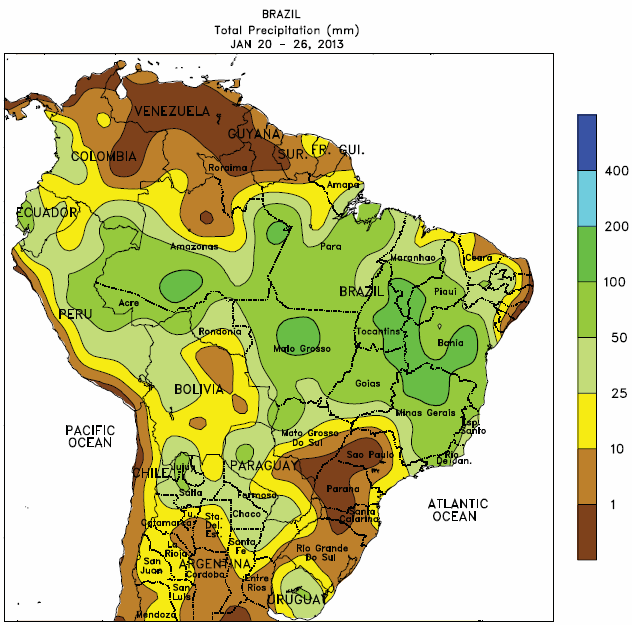
Sojabönorna (november 2013) fortsatte upp, efter att förra veckan ha brutit motståndslinjen i kursdiagrammet, som vi skrev om förra veckan. Regnen i Brasilien, där skörden inletts, försämrar transportmöjligheterna. De första rapporterna visar också att hektarskörden är något lägre än väntat av CONAB med flera. Dessa nyheter gav understöd till veckans prisuppgång. I Argentina är skörden till 8% klar, vilket är långt efter det normala. BAGE rapporterade att torkan ”börjar påverka hektarskörden negativt”. I kartbilden nedan ser vi nederbörden i Brasilien förrförra veckan. Vi ser att det saknas nederbörd i den södra delen av kartbilden, ner mot Argentina. Vi ser också att mitt i det viktiga sojadistriktet i Mato Grosso är det extra mycket nederbörd.
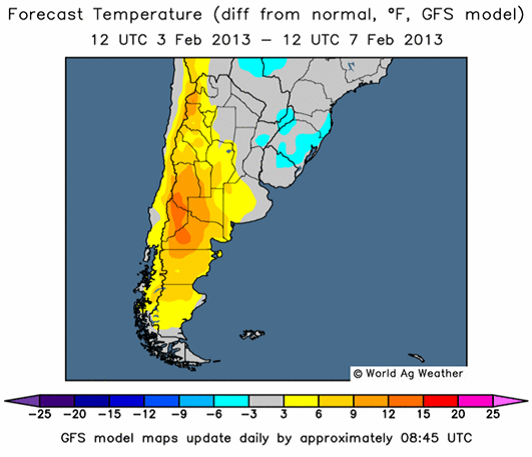
USDA’s FAS uppskattade produktionen i Argentina till 54 mt per den 23 januari och samma dag kom Rosario Grain Exchange med sin prognos på 53 mt. Rapporter säger att förra månaden kan ha varit den varmaste januari sedan 1957, och temperaturen förväntas uppgå till mer än 40 grader med spridda skurar under nästa vecka. För veckan 7-13 februari förväntas temperaturen att överstiga 35 grader.
Enligt BAGE är Argentinas sådd av sojabönor klar till 99.4 procent, en ökning med 2 procent sedan förra veckan. Pablo Adreani, AgriPac Consultores, säger att hans prognos för Argentinas produktion av sojabönor kan komma att justeras ned till 48.5 mt (mot tidigare 51.3 mt) om landet inte får tillräckligt med nederbörd.
Cordonniers estimat för Brasiliens produktion av sojabönor 2012/13 är oförändrad från tidigare estimat på 81 mt, medan Argentinas sojabönsproduktion 2012/13 justeras ned med 1 mt till 52.0 mt.
El Tejar Ltd estimerar Brasiliens produktion av sojabönor 2012/13 till 80-81 mt, jämfört med CONAB’s estimat på 82.7 mt. Argentinas produktion av sojabönor 2012/13 estimeras till 50.0 mt, medan Paraguays beräknas uppgå till 8.0 mt.
Enligt IMEA (Instituto Mato-Grossense de Economia Agropecuária) är skörden av sojabönor i brasilianska Mato Grosso avklarad till 7 procent jämfört med 3 procent för en vecka sedan. Nedanför ser vi kurdiagrammet för sojabönor (november 2013).
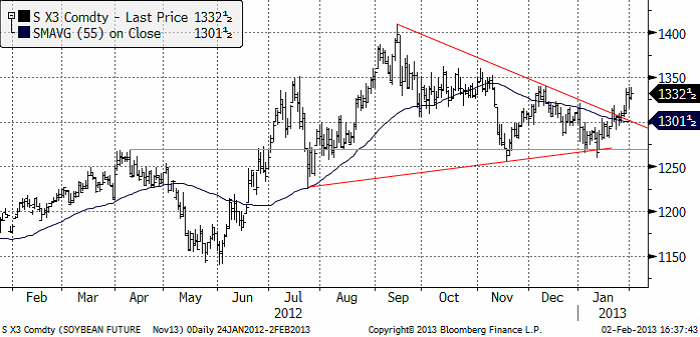
Prisuppgången borde stöta på motstånd i form av vinsthemtagningar / lantbrukares säljordrar vid 1350 cent / bushel. Det är en jämn och fin siffra och tidigare uppgångar från juli och senare har hejdats vi den nivån.
Vi fortsätter att ha en neutral vy i det här veckobrevet. Det troligaste just nu anser vi är att prisuppgången hejdas i veckan som kommer. WASDE-rapporten ger sedan ny vägledning för marknaden. Tekniskt ser det ut som om priset skulle kunna backa något på vinsthemtagningar.
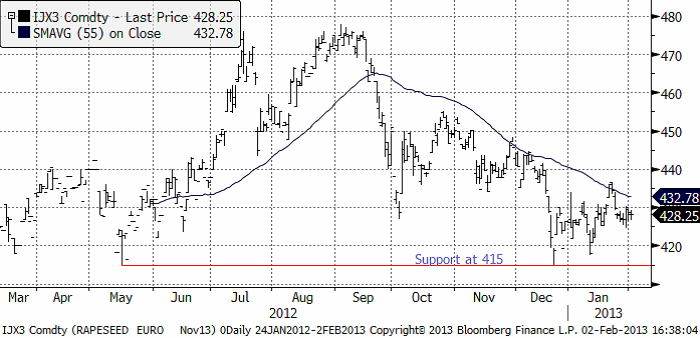
Raps
Rapspriset (november 2013) rörde sig knappast alls i veckan som gick. Vi fortsätter att tolka marknadens beteende som en rekyl i en sjunkande marknad, alternativt som en konsolideringsfas, som kanske kan sluta i att marknaden stiger – men inte än.
Som vi skrev om tidigare i brevet så skiftar lantbrukare i Kanada från t.ex oljeväxter till vete pga högre priser och enligt Oil World så förväntas kanadensiska lantbrukare att minska sin sådd av raps (canola) med 10 procent till förmån för vete. Sådden av canola beräknas uppgå till 7.7 miljoner hektar, en minskning från förra årets rekordhöga 8.61 miljoner hektar, som en följd av låg avkastning, problem med sjukdomar på grund av brist på växelbruk, ökad sådd av sojabönor och som tidigare nämnts, högre priser på vete.
AgCanada höjer sin prognos för den kanadensiska canola produktionen 2013/14 till 15.5 mt från de 13.3 mt som producerades 2012/13. Vi fortsätter att ha en övervägande negativ vy på prisutvecklingen på raps.
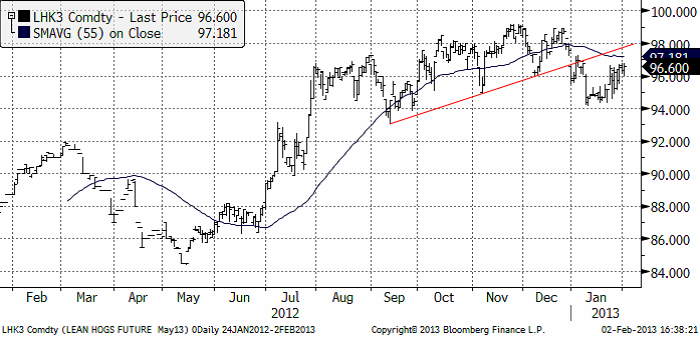
Gris
Grispriset (Maj 13), amerikansk Lean Hogs, har rekylerat uppåt efter brottet nedåt av stödlinjen vid årsskiftet. Rekylen uppåt följer ett klassiskt mönster. Den är ett säljtillfälle.
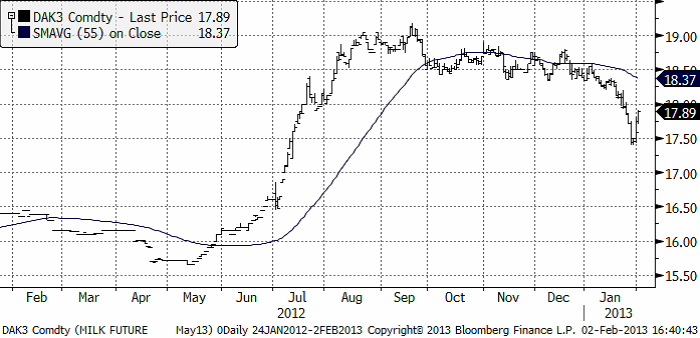
Mjölk
I diagrammet nedan ser vi tre kurvor. Den gröna linjen är priset på smör i euro per ton på Eurex-börsen. Den svarta är priset på smp på Eurex börsen. Priserna på Eurex anges i euro per ton.
Slutligen så den rosa linjen. Den visar priset på helmjölkspulver (WMP) FOB Västeuropa. Källan är USDA och priserna uppdateras varannan vecka. Vi ser att WMP-priset legat stabilt det fjärde kvartalet förra året.
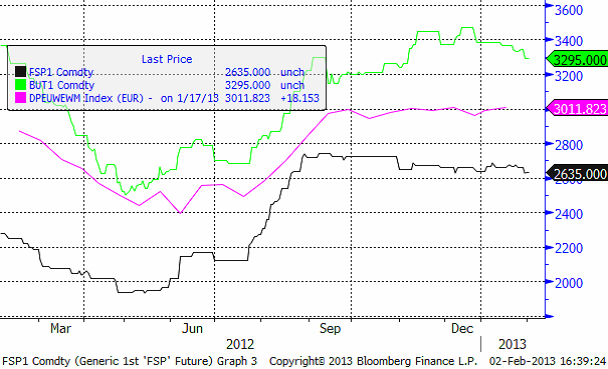
Såväl smör som SMP har haft en påfallande svag prisutveckling, vilket kan vara början på ett en större prisjustering nedåt. Möjligen har marknaden tagit intryck av prisfallet i terminerna (maj 2013) på Klass 3 – mjölk, som vi ser i diagrammet nedan. Vi har noterat att de amerikanska terminsmarknaderna tycks ”leda” utvecklingen i Europa. I USA hejdades dock prisfallet i veckan som gick, som vi ser i diagrammet nedan.
På tisdag, den 5 februari klockan 18:00 publiceras resultaten från Fonterras auktion av mjölkpulver. På basis av prisfallet i USA, ”borde” priset på SMP och smör på Eurex justeras ner i veckan som kommer.
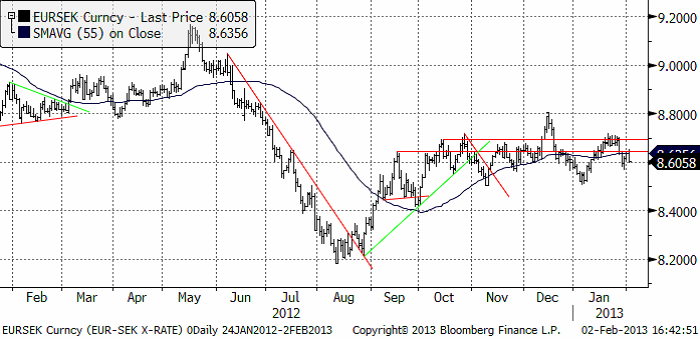
EURSEK
EURSEK föll i veckan som gick. Motståndet blev för starkt. Det är tystare om EU:s kris nu. Nyhetsbevakningen har haft andra fokus i veckan.
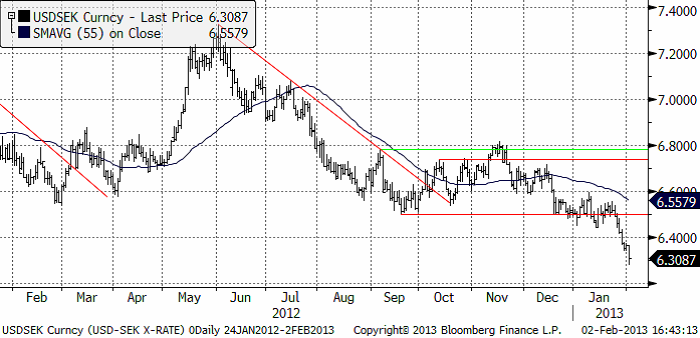
USDSEK
Dollarn har fortsatt att utveckla sig svagt mot kronan. Trenden fortsätter. Skuldkrisen hanterades i veckan – genom att skuldtaket höjdes i ett politiskt beslut. Frågan är om talesättet ”the sky is the limit” är aktuellt. Fortroendet för USA:s förmåga att lösa problemet fick sig en törn i veckan och dollarn fick lida för det.
[box]SEB Veckobrev Jordbruksprodukter är producerat av SEB Merchant Banking och publiceras i samarbete och med tillstånd på Råvarumarknaden.se[/box]
Disclaimer
The information in this document has been compiled by SEB Merchant Banking, a division within Skandinaviska Enskilda Banken AB (publ) (“SEB”).
Opinions contained in this report represent the bank’s present opinion only and are subject to change without notice. All information contained in this report has been compiled in good faith from sources believed to be reliable. However, no representation or warranty, expressed or implied, is made with respect to the completeness or accuracy of its contents and the information is not to be relied upon as authoritative. Anyone considering taking actions based upon the content of this document is urged to base his or her investment decisions upon such investigations as he or she deems necessary. This document is being provided as information only, and no specific actions are being solicited as a result of it; to the extent permitted by law, no liability whatsoever is accepted for any direct or consequential loss arising from use of this document or its contents.
About SEB
SEB is a public company incorporated in Stockholm, Sweden, with limited liability. It is a participant at major Nordic and other European Regulated Markets and Multilateral Trading Facilities (as well as some non-European equivalent markets) for trading in financial instruments, such as markets operated by NASDAQ OMX, NYSE Euronext, London Stock Exchange, Deutsche Börse, Swiss Exchanges, Turquoise and Chi-X. SEB is authorized and regulated by Finansinspektionen in Sweden; it is authorized and subject to limited regulation by the Financial Services Authority for the conduct of designated investment business in the UK, and is subject to the provisions of relevant regulators in all other jurisdictions where SEB conducts operations. SEB Merchant Banking. All rights reserved.

Brent is climbing higher. Front-month is at USD 106.3/bl this morning, close to a weekly high and a USD 9/bl jump from Mondays open. This is the move we flagged as a risk earlier in the week: the market shifting from ”a deal is around the corner” to ”this is going to take longer than we thought”.

Analyst Commodities, SEB
During April, rest-of-year Brent remained remarkably stable around USD 90/bl. A stability which rested on one single assumption: the SoH reopens around 1 May. That assumption is now slowly falling apart.
As we highlighted yesterday: every week of delay beyond 1 May adds (theoretically) ish USD 5/bl to the rest-of-year average, as global inventories draw 100 million barrels per week. i.e., a mid-May reopening implies rest-of-year Brent closer to USD 100/bl, and anything pushing into June or July takes us meaningfully higher.
What’s changed in the last 48 hours:
#1: The US military has formally warned that clearing suspected sea mines from SoH could take up to six months. That is a completely different timescale from what the financial market is pricing. Even a political deal tomorrow does not immediately reopen the strait.
#2: Trump has shifted his tone from urgency to ”strategic patience”. In yesterday’s press conference: ”Don’t rush me… I want a great deal.” The market is reading this as a president no longer feeling pressured by timelines, with the naval blockade running in the background.
#3: So far, the military activity is escalating, not de-escalating. Axios reports Iran is laying more mines in SoH. The US 3rd carrier strike group (USS George H.W. Bush) is arriving with two countermine vessels. Trump yesterday ordered the US Navy to destroy any Iranian boats caught laying mines. While CNN reports that the Pentagon is actively drawing up plans to strike Iranian SoH capabilities and individual Iranian military leaders if the ceasefire collapses. i.e., NOT a attitude consistent with an imminent deal!
Spot crude and product prices eased off the early-April highs on a combination of system rerouting and deal optimism. Both now weakening. Goldman estimates April Gulf output is reduced by 14.5 mbl/d, or 57% of pre-war supply, a number that keeps getting worse the longer this drags on.
Demand-side adaptation is ongoing: S. Korea has cut its Middle East crude dependence from 69% to 56% by pulling more from the Americas and Africa, and Japan is kicking off a second round of SPR releases from 1 May. But SPRs are finite.
Ref. to the negotiations, we should not bet on speed. The current Iranian leadership is dominated by genuine hardliners willing to absorb economic pain and run the clock to extract concessions. That is not a setup for a rapid resolution. US/Israeli media briefings keep framing the delay as ”internal Iranian divisions”, the reality is more complicated and points toward weeks and months, not days.
Our point is that the complexity is large, and higher prices have only just started (given a scenario where the negotiations drag out in time). The market spent April leaning on the USD 90/bl rest-of-year assumption; that case is diminishing by the hour. If ”early May reopening” is replaced by ”June, July or later” over the next week or two, both crude and products have meaningful room to reprice higher from here. There is a high risk being short energy and betting on any immediate political resolution(!).
Down on Friday. Up on Monday. The Brent June crude oil contract traded down 5.1% last week to a close of $90.38/b. It reached a high of $103.87/b last Monday and a low of $86.09/b on Friday as Iran announced that the Strait of Hormuz was fully open for transit. That quickly changed over the weekend as the US upheld its blockade of Iranian oil exports while Iran naturally responded by closing the SoH again. The US blew a hole in the engine room of the Iranian ship TOUSKA and took custody of the ship on Sunday. Brent crude is up 5.6% this morning to $95.4/b.

The cease-fire is expiring tomorrow. The US has said it will send a delegation for a second round of negotiations in Islamabad in Pakistan. But Iran has for now rejected a second round of talks as it views US demands as unrealistic and excessive while the US is also blocking the Strait of Hormuz.
While Brent is up 5% this morning, the financial market is still very optimistic that progress will be made. That talks will continue and that the SoH will fully open by the start of May which is consistent with a rest-of-year average Brent crude oil price of around $90/b with the market now trading that balance at around $88/b.
Financial optimism vs. physical deterioration. We have a divergence where the financial market is trading negotiations, improvements and resolution while at the same time the physical market is deteriorating day by day. Physical oil flows remain constrained by disrupted flows, longer voyage times and elevated freight and insurance costs.
Financial markets are betting that a US/Iranian resolution will save us in time from violent shortages down the road. But every day that the SoH remains closed is bringing us closer to a potentially very painful point of shortages and much higher prices.
The US blockade is also a weapon of leverage against its European and Asian allies. When Iran closed the SoH it held the world economy as a hostage against the US. The US blockade of the SoH is of course blocking Iranian oil exports. But it is also an action of disruption directed towards Europe and Asia. The US has called for the rest of the world to engaged in the war with Iran: ”If you want oil from the Persian Gulf, then go and get it”. A risk is that the US plays brinkmanship with the global oil market directed towards its European and Asian allies and maybe even towards China to force them to engage and take part. Maybe unthinkable. But unthinkable has become the norm with Trump in the White House.
Wild moves yesterday. Brent crude traded to a high of $114.43/b and a low of $96.0/b and closed at $99.94/b yesterday.
US – Iran negotiations ongoing or not? What a day. Donald Trump announced that good talks were ongoing between Iran and the US and that the 48 hour deadline before bombing Iranian power plants and energy infrastructure was postponed by five days subject to success of ongoing meetings. Iranian media meanwhile stated that no meetings were ongoing at all.
Today we are scratching our heads trying to figure out what yesterday was all about.
Friends and family playing the market? Was it just Trump and his friends and family who were playing with oil and equity markets with $580m and $1.46bn in bets being placed by someone in oil and equity markets just 15 minutes before Trump’s announcement?
Was Trump pulling a TACO as he reached his political and economic pain point: Brent at $112/b, US Gas at $4/gal, SPX below 200dma and US 10yr above 4.4%?
Different Iranian factions with Trump talking with one of them? Are there real negotiations going on but with the US talking to one faction in Iran while another, the hardliners, are not involved and are denying any such negotiations going on?
Extending the ultimatum to attack and invade Kharg island next weekend? Or, is the five day delay of the deadline a tactical decision to allow US amphibious assault ships and marines to arrive in the Gulf in the upcoming weekend while US and Israeli continues to degrade Iranian military targets till then. And then next weekend a move by the US/Israel to attack and conquer for example the Kharg island?
We do not really know which it is or maybe a combination of these.
We did get some kind of TACO ydy. But markets have been waiting for some kind of TACO to happen and yesterday we got some kind of TACO. And Brent crude is now trading at $101.5/b as a result rather than at $112-114/b as it did no the high yesterday.
But what really matters in our view is the political situation on the ground in Iran. Will hardliners continue to hold power or will a more pragmatic faction gain power?
If the hardliners remain in power then oil pain should extend all the way to US midterm elections. The hardliners were apparently still in charge as of last week. Iran immediately retaliated and damaged LNG infrastructure in Qatar after Israel hit Iranian South Pars. The SoH was still closed and all messages coming out of Iran indicated defiance. Hardliners continues in power has a huge consequence for oil prices going forward. The regime has played its ’oil-weapon’ (closing or chocking the Strait of Hormuz). It is using it to achieve political goals. Deterrence: it needs to be so politically and economically expensive to attack Iran that it won’t happen again in the future. Or at least that the US/Israel thinks 10-times over before they attack again. The highest Brent crude oil closing price since the start of the war is $112.19/b last Friday. In comparison the 20-year inflation adjusted Brent price is $103/b. So Brent crude last Friday at $112.19/b isn’t a shockingly high price. And it is still far below the nominal high of $148/b from 2008 which is $220/b if inflation adjusted. So once in a lifetime Iran activates its most powerful weapon. The oil weapon. It needs to show the power of this weapon and it needs to reap political gains. Getting Brent to $112/b and intraday high of $119.5/b (9 March) isn’t a display of the power of that weapon. And it is not a deterrence against future attacks.
So if the hardliners remain in power in Iran, then the SoH will likely remain chocked all the way to US midterm elections and Brent crude will at a minimum go above the historical nominal high of $148/b from 2008.
Thus the outlook for the oil price for the rest of the year doesn’t depend all that much of whether Trump pulls a TACO or not. Stops bombing or not. It depends more on who is in charge in Iran. If it is the hardliners, then deterrence against future attacks via chocking of the SoH and high oil prices is the likely line of action. It is impacting the world but the Iranian ’oil-weapon’ is directed towards the US president and the the US midterm elections.
If a pragmatic faction gets to power in Iran, then a very prosperous future is possible. However, if power is shifting towards a more pragmatic faction in Iran then a completely different direction could evolve. Such a faction could possibly be open for cooperation with the US and the GCC and possibly put its issues versus Israel aside. Then the prosperity we have seen evolving in Dubai could be a possible future also for Iran.
So far it looks like the hardliners are fully in charge. As far as we can see, the hardliners are still fully in control in Iran. That points towards continued chocking of the SoH and oil prices ticking higher as global inventories (the oil market buffers) are drawn lower. And not just for a few more weeks, but possibly all the way to the US midterm elections.


Solkraften pressar elpriserna dagtid

Michel Gubel ger sin syn på oljemarknaden

Svag vårflod dubblar elpriserna
Brent crude up USD 9/bl on the week… ”deal around the corner” narrative fades
Market Still Betting on Timely Resolution, But Each Day Raises Shortage Risk
Market Still Betting on Timely Resolution, But Each Day Raises Shortage Risk
Brent crude up USD 9/bl on the week… ”deal around the corner” narrative fades
Michel Gubel ger sin syn på oljemarknaden
Solkraften pressar elpriserna dagtid
Svag vårflod dubblar elpriserna
-
Analys3 veckor sedan
Market Still Betting on Timely Resolution, But Each Day Raises Shortage Risk
-
Analys3 veckor sedan
Brent crude up USD 9/bl on the week… ”deal around the corner” narrative fades
-
 Nyheter2 veckor sedan
Michel Gubel ger sin syn på oljemarknaden
-
 Nyheter2 veckor sedan
Solkraften pressar elpriserna dagtid
-
Nyheter2 veckor sedan
Svag vårflod dubblar elpriserna