

Analys
SHB Råvarubrevet 16 augusti 2013

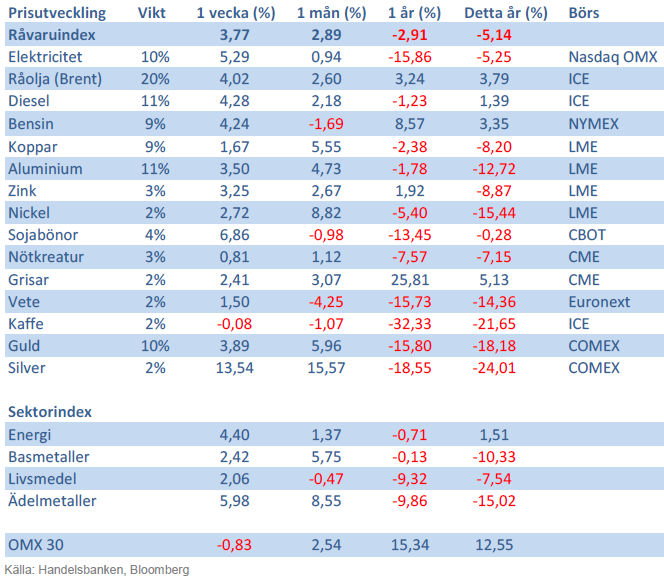
 Råvaror allmänt
Back to School
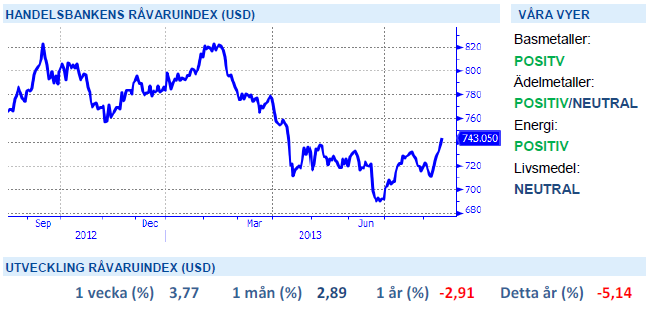
Efter sköna lata dagar är de flesta tillbaka på arbetsplatsen och fokus ligger åter på ekonomisk data och aktuella teman för hösten. Tre teman kommer dominera prisutvecklingen för industriråvaror under andra halvåret: Eurozonen, Fed och Kina. En glad överraskning efter sommaren var att Eurozonen hoppade upp ur recessionsträsket. 0,3 % tillväxt under Q2 är såklart välkommet som bidrag till globala tillväxten. Visserligen kommer inte positiv tillväxt i Eurozonen, skapad av Tyskland och Frankrike, att lösa de djupt rotade problemen i de perifera länderna i Europa, de kan till och med bli en negativ effekt spunnen ur den starkare eurokursen som kommer av starka kärnländer, men givet rådande låga förväntningar på EMU så tror vi att EMU data har potential att driva prisuppgångar framöver. Sammanfattningsvis är recensionen över medan skuldkrisen lever.
Om Eurozonen är marginellt bättre så kompenseras det av Feds påbörjan av att minska sitt bidrag till marknaden. Antagligen redan i september men i kombination med löften om att hålla räntorna låga mycket längre. Därför tror vi att ”tapering” endast får liten negativ inverkan på råvarupriser. Temat har varit känt sedan maj, övriga centralbanker är fortfarande expansiva och Fed väntas enbart trimma sina stödköp om USA:s ekonomi fortsätter att stärkas.
Om vi antar att dessa båda teman balanserar varandra (om än med övervikt åt positiv EMU effekt) så återstår Kina som det osäkra kortet. Senaste omgången med data var klart bättre än väntat. Handelsdata och råvaruimport var klarast lysande stjärnor. Råvaruimporten av de fyra stora, järnmalm, olja, koppar och sojabönor var den högsta på ett år. Ett sammanträffande som säger något då dessa råvaror används i vitt skilda sektorer. Uppgången har drivits av ökade investeringar och ökad kreditgivning tidigare i år. För råvarornas del tror vi att det handlar om en klassik ”restocking” där lagerkedjan är på mycket låga nivåer efter besvärliga tider och åtstramade krediter i Kina. Vårt argument för att det inte rör sig om en ökad slutkonsumtion är främst industri PMI som hovrar omkring 50-strecket. Icke desto mindre kan lagerrörelsen driva industriråvaror under en månad eller två.
Basmetaller
Kina stärker metallerna
Kinas ekonomi har tappat fart under 9 av de 10 senaste kvartalen. Efter en serie av små förändringar från beslutsfattare så har trenden (åtminstone tillfälligt) vänt. Under juli steg industriproduktion, investeringar och bostadsbyggande. De är de viktigaste kategorierna för basmetaller som följaktligen också har stigit i pris. Vårt basmetallindex steg med 6 % under första halvan av augusti där samtliga basmetaller har stärkts med 6-8 %.
Extra bränsle fick brasan av en urstark kinesisk råvaruimport. Denna är visserligen laggad då det tar 6 veckor att skeppa koppar från Chile och järnmalm och sojabönor från Brasilien till Kina men att importen var upp bland vitt skilda råvaror är ett styrketecken. Basmetaller har varit hårt nedtryckta av korta positioner och med en starkare dataström från Kina så ska många korta positioner ut ur LME metallerna. Vi tror på stigande basmetaller med nickel som favorit.
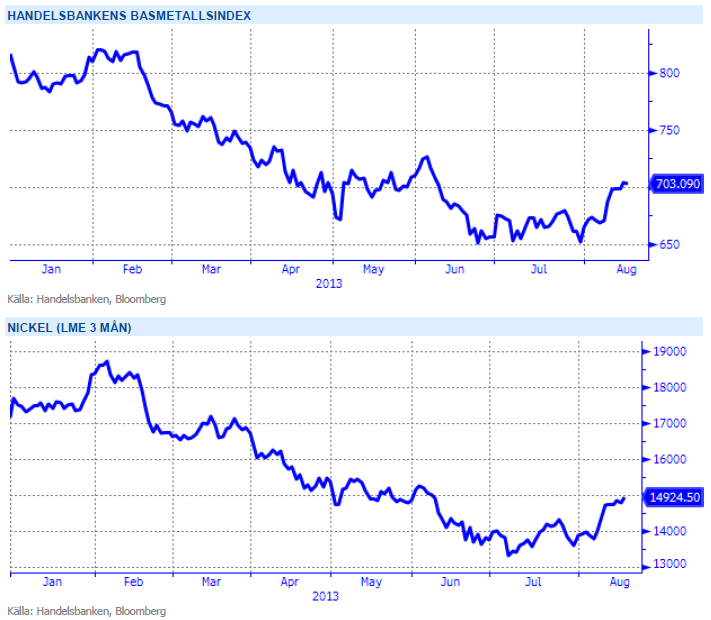
Nickel är den basmetall som gått ner mest under året och med många gruvor som går med förlust på dagens prisnivåer tror vi på stigande priser. Vi tror på: LONG NICKEL H
Ädelmetaller
Guldet fortsatt starkt
Den 1 juli presenterade vi ett kortsiktigt köpcase på guld, baserat på att priset då rasat väldigt mycket på kort tid, på att kvartalsskiftet orsakade extra stora försäljningar, och på att inflationsförväntningarna börjat stiga igen. Vidare såg guldet rent tekniskt ut att vara översålt. Sedan dess har guldet gått från 1240 dollar per uns till nuvarande 1360 dollar, en uppgång på ca.10 procent. Vi tror att uppgången har lite mer att hämta, även om vi alltjämt håller i vår mer långsiktigt negativa vy.
Den nuvarande drivkraften är primärt den tragiska utvecklingen i Egypten som skapar riskaversion och flykt till mer upplevt säkra tillgångar som guld. Det är dock viktigt att ”dansa nära nödutgången” när man handlar mot sin långsiktiga vy, så vi måste vara påpassliga för plötsliga prisfall orsakade av bättre riskaptit eller fallande inflationsförväntningar. Vi ser fortfarande 1450 som en rimlig nivå att nå i denna uppåtrörelse.
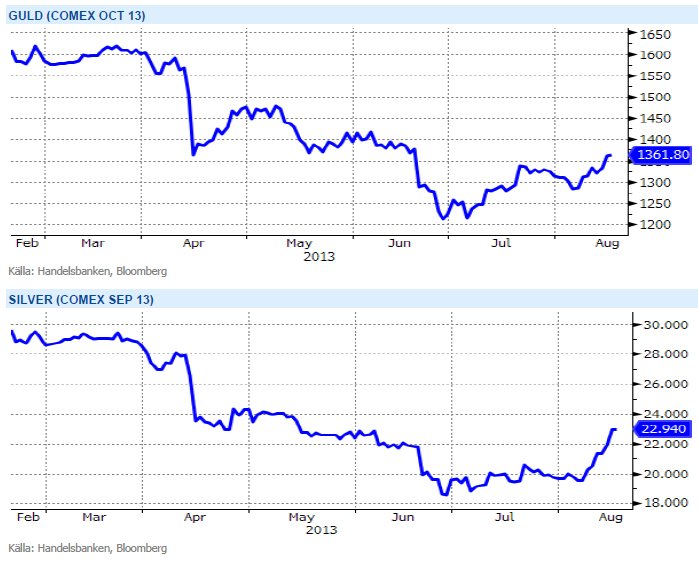
I ett läge där råvaror generellt har viktats ned av institutionella placerare kan guld och silver få en ”omotiverad” uppgång när dessa indexköpare återvänder till råvaror drivit av bättre utsikter för Kina och USA. Vi tror på : LONG GULD H och LONG SILVER H
Energi
Dyrare olja i sommar
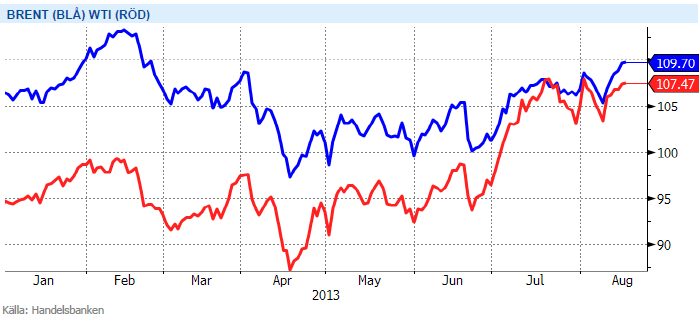
Stigande WTI olja och efterföljande Brent har dragit rubriker i sommar. För WTI handlar det mest om att logistiska knutar har lösts upp i USA och ökat utflödet från Cushing som är leveranspunkten för WTI. Lägre lager som sammanföll med stark bensinefterfrågan under driving season stärkte också priset. Brentoljan har också stigit, drivit av högre WTI och oroligheterna i Egypten/ Mellanöstern. Egypten i sig är inget stort oljeland men som stor ekonomi viktig för regionens (in)stabilitet. Presidentbyte i Iran har ännu inte lett till förändrad kommunikation kring sanktionerna. Rouhani är dock mer västvänlig än sin föregångare. I dagsläget är utbudstörningar i Irak mer prisdrivande. Ökat våld och politiskt vakuum har fått produktionsutsikterna på fall. Irak är idag OPEC:s näst största medlem sedan sanktionerna mot Iran infördes. Saudi har redan växlat upp produktionen för att kompensera vilket fått ner Brent något. Saudis roll är alltså inte över trots den boomande oljeproduktionen i USA.
Den korta elpriskurvan stärktes tillfälligt under sommaren med närmare 6 procent vilket främst orsakades av torrt väder och stigande kolpriser. Den hydrologiska balansen försämrades från -6 TWh till -11Twh för att sedan åter falla tillbaka till -6 TWh samtidigt som den negativa trenden på kolmarknaden fortsätter. Såväl gas som utsläppsrätterna handlas i stort sett oförändrat över sommaren samtidigt som spotpriserna i Norden kommer in på stabila nivåer, ca 30 öre per kWh i snitt sedan 1 juni och 33.5 öre i snitt hittills i år. Utsikterna framöver pekar på ett torrare scenario mot normalt vilket i kombination med något starkare kontinentala marknader bör ge fortsatt stöd i en semesterlugn elmarknad.
Utsikterna framöver pekar på ett torrare scenario mot normalt vilket i kombination med något starkare kontinentala marknader bör ge fortsatt stöd. Vi tror på: LONG EL
Livsmedel
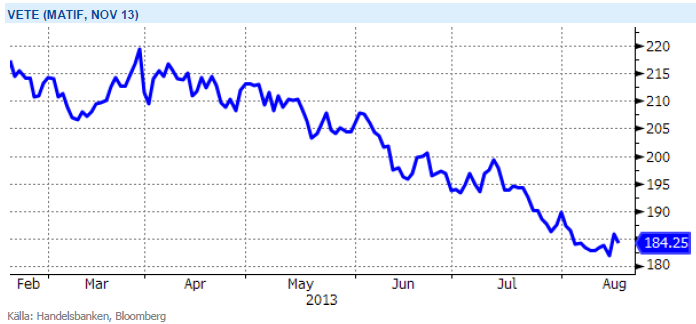
Goda skördar pressar priset
Priserna på de stora jordbruksgrödorna vete, majs och soja har fallit kraftigt under sommaren. I april skrev vi om ett lägre pris på vete framtill hösten på 15-18%, det har sedan dess fallit 15 % och därmed har vi sett det stora fall vi förväntade oss. Det finns fortfarande kvar risk på nedsidan men det kan vara dags att ta hem vinst för korta positioner. Anledningen till prisrasen är främst en generellt sett gynnsam utveckling för grödorna i flera viktiga odlingsområden. Majsen och sojan i USA fick en dålig och sen start men har därefter upplevt en ganska lång period av nära idealiska förhållanden. Förväntningarna på kommande skörd har med tiden skrivits upp flera gånger – det samtidigt som tiden för eventuella bakslag hela tiden minskat. Efter de stora prisfallen har priset på vete, majs och soja neutraliserats men vi ser fortsatt risk på nedsidan – om än mindre än tidigare.
För kakao har uteblivet regn och torka har ökat risken för minskad skörd i Elfenbenskusten, vilket har pressat upp priset till två års högsta. Vi ser också signaler på stigande konsumtion i tillväxtländerna och står därför kvar vid vår vy om fortsatt stigande kakaopris.
I många kaffeproducerande länder däremot, med Brasilien i spetsen, har det regnat i mängder under odlingsperioden och det råder viss oro kring kvalitén på kaffebönorna nu när vi går mot senare delen av skördeperioden. Förseningen har lett till att en del odlare sålt sin skörd till reducerade priser. Förutom nederbörden i Brasilien och fortsatta problem i Centralamerika och Mexico med svampsjukdomar väntas världsproduktionen på kaffe för säsongen 2013/-14 komma att minsta med 3 procent medan en blygsam ökning väntas på konsumtionssidan. Med andra ord så finns det än så länge gott om kaffe på marknaden varför vi tror på terminspris (frontkontrakt) under 1,25 dollar/Ib.
Sammanfattningsvis håller vi en neutral för vårt livsmedelsindex.
Handelsbankens råvaruindex
[box]SHB Råvarubrevet är producerat av Handelsbanken och publiceras i samarbete och med tillstånd på Råvarumarknaden.se[/box]
Ansvarsbegränsning
Detta material är producerat av Svenska Handelsbanken AB (publ) i fortsättningen kallad Handelsbanken. De som arbetar med innehållet är inte analytiker och materialet är inte oberoende investeringsanalys. Innehållet är uteslutande avsett för kunder i Sverige. Syftet är att ge en allmän information till Handelsbankens kunder och utgör inte ett personligt investeringsråd eller en personlig rekommendation. Informationen ska inte ensamt utgöra underlag för investeringsbeslut. Kunder bör inhämta råd från sina rådgivare och basera sina investeringsbeslut utifrån egen erfarenhet.
Informationen i materialet kan ändras och också avvika från de åsikter som uttrycks i oberoende investeringsanalyser från Handelsbanken. Informationen grundar sig på allmänt tillgänglig information och är hämtad från källor som bedöms som tillförlitliga, men riktigheten kan inte garanteras och informationen kan vara ofullständig eller nedkortad. Ingen del av förslaget får reproduceras eller distribueras till någon annan person utan att Handelsbanken dessförinnan lämnat sitt skriftliga medgivande. Handelsbanken ansvarar inte för att materialet används på ett sätt som strider mot förbudet mot vidarebefordran eller offentliggörs i strid med bankens regler.


Market is starting to take US/Iran headlines with a pinch of salt. Brent crude rose $2.8/b yesterday to an official close of $112.1/b. But after that it traded as low as $108.05/b before ending late night at around $109.7/b. Through the day it traded in a range of $106.87 – 112.72/b amid a flurry of news or rumors from Iran and the US. ”US temporary sanctions during negotiations” (falls alarm). ”We will bomb Iran” (not anyhow),… etc. While the market is still fluctuating to this kind of news flow, it is starting to take such headlines with a pinch of salt.

We’ll see. Maybe, maybe not. The Brent M1 contract is trading at $110.2/b this morning which very close to the average ticks through yesterday of $110.4/b.
Trump with bearish, verbal intervention whenever Brent trades above $110/b it seems. What seems to be a pattern is that Trump states something like ”very good negotiations going on with Iran”, ”New leaders in Iran are great,..”, ”Great progress in negotiations,…”, ”Deal in sight,..” etc whenever the Brent M1 contract trades above $110/b. An effort to cool the market. These hot air verbal interventions from Trump used to have a heavy bearish impact on prices, but they now seems to have less and less effect unless they are backed by reality.
As far as we can see there has been no real progress in the negotiations between the US and Iran with both sides still standing by their previous demands.
Iran is getting stronger while the cease fire lasts making a return to war for Trump yet harder. Iran is naturally in constant preparation for a return to war given Trump’s steady threats of bombing Iran again. Iran is naturally doing what ever is possible to prepare for a return to war. And every day the cease fire lasts it is better prepared. This naturally makes it more and more difficult and dangerous for the US to return to warring activity versus Iran as the consequences for energy infrastructure in the Persian Gulf will be more and more severe the longer the cease fire lasts. Israel seems to see it this way as well. That the war is not won and that current frozen state of a cease fire gives Iran opportunity to rebuild military and politically.
Global inventories are drawing down day by day. How much? In the meantime the Strait of Hormuz stays closed. There is varying measures and estimates of how much global inventories are drawing down. Our rough estimate, back of the envelope, is that global inventories are drawing down by at least some 10 mb/d or about 300 mb/d in a balance between loss of supply versus demand destruction. Other estimates we see are a monthly draw of 250-270 mb/d. The IEA only ’measured’ a draw in global observable stocks of 117 mb in April with oil on water rising 53 mb while on shore stocks fell 170 mb. But global stocks are hard to measure with large invisible, unmeasured stocks. As such a back of the envelope approach may be better.
Oil products is what the world is consuming. Oil product prices likely to rise while product stocks fall. Strategic Petroleum Reserves (SPR) are predominantly crude oil. Discharging oil from OECD SPR stocks, a sharp reduction in Chinese crude imports and a reduction in global refinery throughput of 6-7 mb/d has helped to keep crude oil markets satisfactorily supplied. But global inventories are drawing down none the less. And oil products is really what the world is consuming. So if global refinery throughput stays subdued, then demand will eventually have to match the supply of oil products. The likely path forward this summer is a steady draw down in jet fuel, diesel and gasoline. Higher prices for these. Then, if possible, higher refinery throughput and higher usage of crude in response to very profitable refinery margins. And lastly sharper draw in crude stocks and higher prices for these. But some 6 mb/d of oil products used to be exported through the Strait of Hormuz. And it may not be so easy to ramp up refinery activity across the world to compensate. Especially as Ukraine continues to damage Russian refineries as well as Russian crude production and export facilities.
Watch oil product stocks and prices as well as Brent calendar 2027. What to watch for this summer is thus oil product inventories falling and oil product premiums to crude rising. Another measure to watch is the Brent crude 2027 contract as it rises steadily day by day as the Strait of Hormuz stays closed and global oil inventories decline. The latter is close to the highest level since the start of the war and keeps rising.
The Brent M1 contract and the Brent 2027 prices and current price of jet fuel in Europe (ARA). All in USD/b

Our back of the envelope calculation of the global shortage created by the closure of the Strait of Hormuz. Note that 3.5 mb/d of discharge from SPR is also a draw. Note also that ’Forced demand loss’ of 2.5 mb/d is probably temporary and will fall back towards zero as logistics are sorted out leaving ’Price demand loss’ to do the job of balancing the market. Thus a shortfall of at least 9 mb/d created by the closure. More if SPR discharge is included and more if Forced demand loss recedes.

Brent is climbing higher. Front-month is at USD 106.3/bl this morning, close to a weekly high and a USD 9/bl jump from Mondays open. This is the move we flagged as a risk earlier in the week: the market shifting from ”a deal is around the corner” to ”this is going to take longer than we thought”.

Analyst Commodities, SEB
During April, rest-of-year Brent remained remarkably stable around USD 90/bl. A stability which rested on one single assumption: the SoH reopens around 1 May. That assumption is now slowly falling apart.
As we highlighted yesterday: every week of delay beyond 1 May adds (theoretically) ish USD 5/bl to the rest-of-year average, as global inventories draw 100 million barrels per week. i.e., a mid-May reopening implies rest-of-year Brent closer to USD 100/bl, and anything pushing into June or July takes us meaningfully higher.
What’s changed in the last 48 hours:
#1: The US military has formally warned that clearing suspected sea mines from SoH could take up to six months. That is a completely different timescale from what the financial market is pricing. Even a political deal tomorrow does not immediately reopen the strait.
#2: Trump has shifted his tone from urgency to ”strategic patience”. In yesterday’s press conference: ”Don’t rush me… I want a great deal.” The market is reading this as a president no longer feeling pressured by timelines, with the naval blockade running in the background.
#3: So far, the military activity is escalating, not de-escalating. Axios reports Iran is laying more mines in SoH. The US 3rd carrier strike group (USS George H.W. Bush) is arriving with two countermine vessels. Trump yesterday ordered the US Navy to destroy any Iranian boats caught laying mines. While CNN reports that the Pentagon is actively drawing up plans to strike Iranian SoH capabilities and individual Iranian military leaders if the ceasefire collapses. i.e., NOT a attitude consistent with an imminent deal!
Spot crude and product prices eased off the early-April highs on a combination of system rerouting and deal optimism. Both now weakening. Goldman estimates April Gulf output is reduced by 14.5 mbl/d, or 57% of pre-war supply, a number that keeps getting worse the longer this drags on.
Demand-side adaptation is ongoing: S. Korea has cut its Middle East crude dependence from 69% to 56% by pulling more from the Americas and Africa, and Japan is kicking off a second round of SPR releases from 1 May. But SPRs are finite.
Ref. to the negotiations, we should not bet on speed. The current Iranian leadership is dominated by genuine hardliners willing to absorb economic pain and run the clock to extract concessions. That is not a setup for a rapid resolution. US/Israeli media briefings keep framing the delay as ”internal Iranian divisions”, the reality is more complicated and points toward weeks and months, not days.
Our point is that the complexity is large, and higher prices have only just started (given a scenario where the negotiations drag out in time). The market spent April leaning on the USD 90/bl rest-of-year assumption; that case is diminishing by the hour. If ”early May reopening” is replaced by ”June, July or later” over the next week or two, both crude and products have meaningful room to reprice higher from here. There is a high risk being short energy and betting on any immediate political resolution(!).
Down on Friday. Up on Monday. The Brent June crude oil contract traded down 5.1% last week to a close of $90.38/b. It reached a high of $103.87/b last Monday and a low of $86.09/b on Friday as Iran announced that the Strait of Hormuz was fully open for transit. That quickly changed over the weekend as the US upheld its blockade of Iranian oil exports while Iran naturally responded by closing the SoH again. The US blew a hole in the engine room of the Iranian ship TOUSKA and took custody of the ship on Sunday. Brent crude is up 5.6% this morning to $95.4/b.
The cease-fire is expiring tomorrow. The US has said it will send a delegation for a second round of negotiations in Islamabad in Pakistan. But Iran has for now rejected a second round of talks as it views US demands as unrealistic and excessive while the US is also blocking the Strait of Hormuz.
While Brent is up 5% this morning, the financial market is still very optimistic that progress will be made. That talks will continue and that the SoH will fully open by the start of May which is consistent with a rest-of-year average Brent crude oil price of around $90/b with the market now trading that balance at around $88/b.
Financial optimism vs. physical deterioration. We have a divergence where the financial market is trading negotiations, improvements and resolution while at the same time the physical market is deteriorating day by day. Physical oil flows remain constrained by disrupted flows, longer voyage times and elevated freight and insurance costs.
Financial markets are betting that a US/Iranian resolution will save us in time from violent shortages down the road. But every day that the SoH remains closed is bringing us closer to a potentially very painful point of shortages and much higher prices.
The US blockade is also a weapon of leverage against its European and Asian allies. When Iran closed the SoH it held the world economy as a hostage against the US. The US blockade of the SoH is of course blocking Iranian oil exports. But it is also an action of disruption directed towards Europe and Asia. The US has called for the rest of the world to engaged in the war with Iran: ”If you want oil from the Persian Gulf, then go and get it”. A risk is that the US plays brinkmanship with the global oil market directed towards its European and Asian allies and maybe even towards China to force them to engage and take part. Maybe unthinkable. But unthinkable has become the norm with Trump in the White House.


Sommarväder skapar prisrally på elbörsen
Oil product price pain is set to rise as the Strait of Hormuz stays closed into summer

Solkraften pressar elpriserna dagtid

Michel Gubel ger sin syn på oljemarknaden