

Analys
Råvaruplanket – Politiken tar över råvarumarknaden

![]() Trump, Xi och MBS
Trump, Xi och MBS
Efter två års prisuppgångar på råvaror, helt i linje med den globala konjunkturens frammarsch med den starkaste, synkroniserade tillväxten på många år, ser nu politiken ut att ta över. Trump inför tullar på stål och aluminium i världens största ekonomi. Xi Jinping har utropats till president för resten av sitt liv i världens största producent och konsument av råvaror. Kronprins Mohammed Bin Salman har utmanövrerat sina motståndare i Riyad och styr OPEC med järnhand. Om konjunkturen drev råvarorna hit har politiken större inflytande framöver.
 Kinas nedgång rullas fram
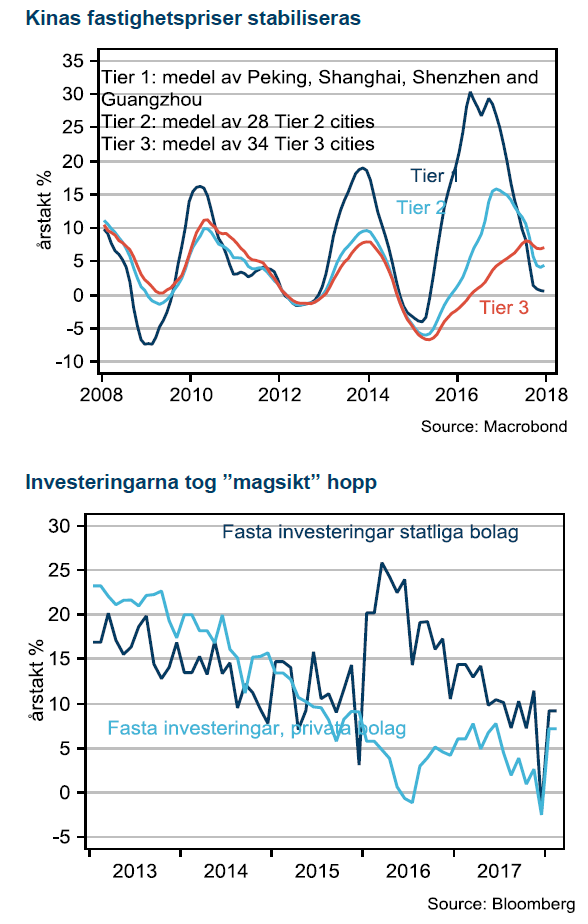
Förväntningarna på Kina för 2018 har varit lågt ställda, hittills har dock data överraskat positivt. Det fanns en osäkerhet kring tillväxtmålet då Xi lagt mindre fokus på det under senare tid. Tillväxtmålet ligger dock kvar på ”omkring 6,5” att jämföra med ”omkring 6,5% eller högre om möjligt” som gällde 2017. Tillväxtmålets betydelse har ändå spelats ner men det faktum att det finns kvar gör att Kina kommer fortsätta styra ekonomin mot målet framöver, antagligen fram till 2020.
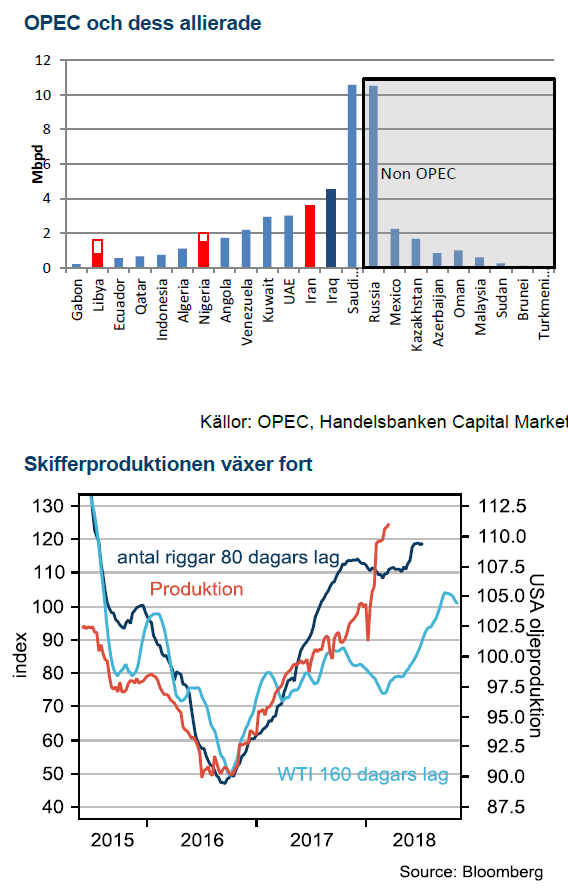
OPEC åker gratis på Venezuelas kollaps
OPEC:s genomförandegrad med avtalet om att sänka produktionen steg till 147% i februari, högsta sedan avtalet inleddes januari 2017. Krisen i Venezuela accelererar och minskar oljeproduktionen så pass mycket att oljemarknaden kan gå mot underskott i marknadsbalansen under året. Venezuela ligger bakom att OPECs genomförandegrad är nästan 50% högre än avtalat. Vi tror fortfarande att oljepriset är på väg ner men höjer vår tro vid slutet av 2018 från USD 50 till USD 55.
Basmetaller
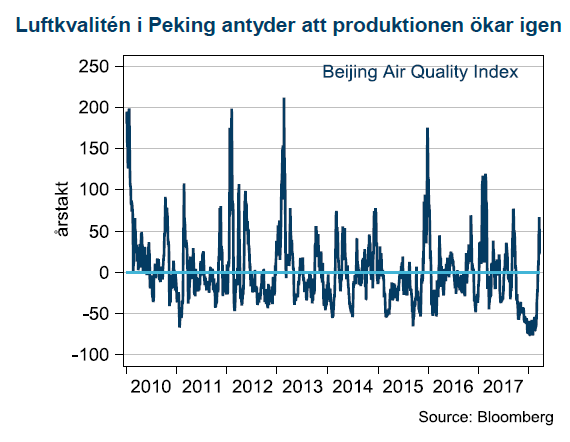
 Striktare plan för luftföroreningar
Under Kinas folkkongress meddelade premiärminister Li Keqiang att tillväxtmålet behålls på 6,5%. Taket för två mandatperioder togs bort och Xi Jinping har nu fritt fram att driva på de reformer som är hans hjärtefrågor. Xis ökade makt är kortsiktigt positivet för Kina men långsiktigt negativt.
Efter att Xi Jinping använt antikorruptionskampanjen för att avväpna sina politiska fiender har hans maktposition blivit fullkomlig. Xi Jinping är en populär ledare både i och utanför Kina. Hans ökade inflytande kommer sannolikt leda till ökat fokus på de frågor som han har drivit. De tre hörnstenarna är; hantera finansiella risker, minska miljöutsläpp och minska fattigdom. Risken med en obegränsad tidsperiod ligger i att politiska motståndare inte vågar göra sig hörda när presidenten sitter på livstid. Det skapar också stora risker kring ett kommande ledarskifte.
Andra besked från folkkongressen har varit fortsatt fokus på reformer av statliga bolag. De ska konsolideras och skulderna ska sänkas. Överproduktion av miljöbelastande råvaruproduktion ska fortsätta beskäras, det talar för att långt ifrån all produktion som stängdes under vintersäsongen kommer tillbaka.
Tullarna är ännu oklara
 Trumps tullar på stål och aluminium verkar komma med en rad undantag. Ju fler undantag desto mindre påverkan på priserna. Vi tror visserligen att Kinas export är permanent på väg ner under Xi Jinpings miljökampanj men det finns ändå risk för turbulens när etablerade handelskanaler ska omarbetas. De länder som får undantag kommer sannolikt i större utsträckning bli transitländer för att försörja USA. Vi ser väldigt liten potential för USA att öka den inhemska produktionen av aluminium och stål.
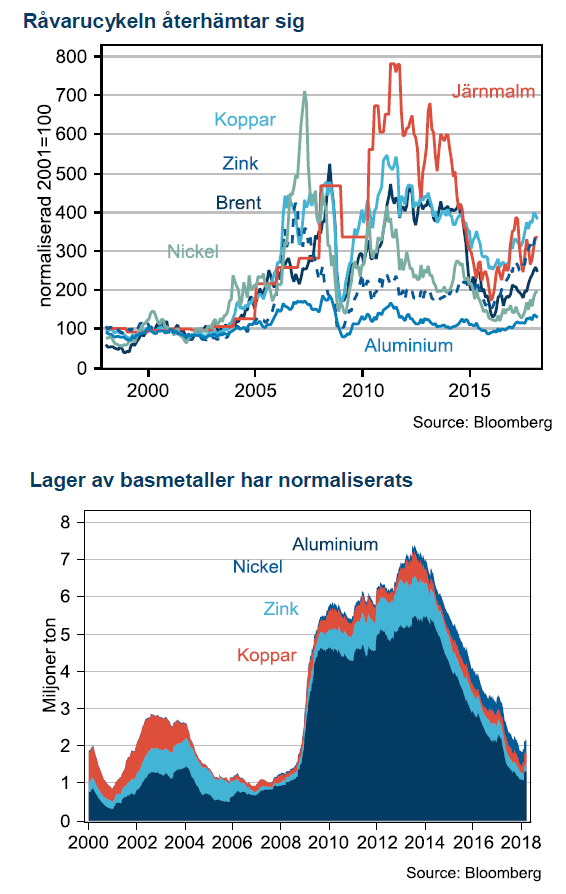
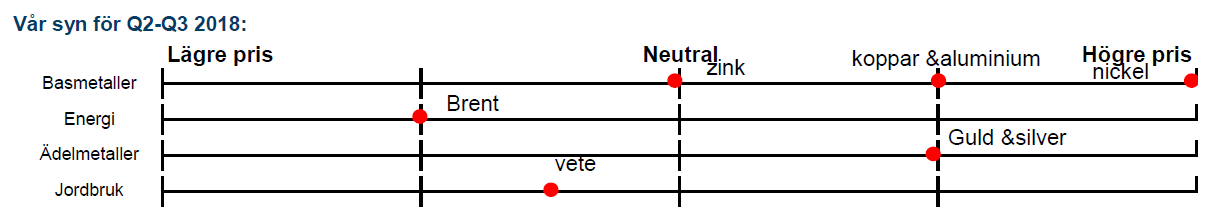
Starka basmetaller framöver
Koppar håller vi som favorit framöver som ett klassiskt, sencykliskt konjunkturspel. Aluminium gynnas av Xis miljökampanj men missgynnas av Trumps tullar. Nickel har mer potential från Xis nedstängningar. Zink tror vi har nått sin topp för den här gången. Zinkpris på nästan 3600 USD/ton är väldigt högt ur ett historiskt perspektiv.
Energi
 Brent på tvåårshögsta
Efter en stark återhämtning under hela hösten har oljepriset stabiliserats omkring 65 USD/fat. OPEC:s kampanj har accelererat i takt med att Venezuelas kollapsande ekonomi går ut över oljeproduktionen. OPECs genomförandegrad var 147% i februari och det är på grund av fallande produktion i Venezuela som OPECs sänkning nästan är 50% större än målet.
Lagercykeln styr
Globala lager har fallit under 2016 och ligger bakom mycket av prisuppgången. De närmsta månaderna stiger USA:s lager säsongsmässigt. Sannolikt har inte mycket förändrats vid nästa OPEC-möte den 22a juni i Wien, varför vi tror det kommer vara för tidigt att diskutera en exitstrategi, i alla fall offentligt. Ryssland har öppnat för en eventuell förlängning in i 2019 om det krävs för att nå målet. Man kan utgå från att oljemarknaden prissätter att OPEC kommer lyckas sänka lager till målet.
Låga tillväxtestimat för USA
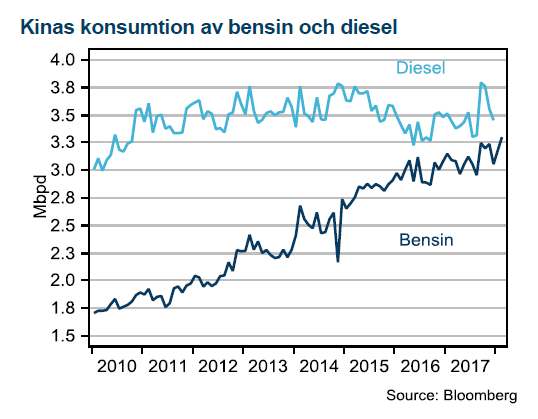
Amerikanska skifferproducenter har åter överraskat marknaden och både OPEC och IEA har fått revidera upp prognoserna för USAs oljeproduktion det här året. OPEC har inte gjort mindre än fem upprevideringar på lika många månader. Vi hade höga estimat på USA och förvånas över att revideringen inte sänkt priset mer, ca 5-6 USD. Vi hade räknat med USD 10.
 Höga tillväxtestimat för Kina
Så här långt har inte tillväxten i efterfrågan justerats i någon större utsträckning. Dieselefterfrågan i Kina har fallit i takt med Xi Jinpings miljökampanj och bensinefterfrågan stiger inte längre lika fort. Vi ser en sannolikhet att nedrevideringar av efterfrågan kan bli drivkraften till nästa större prisrörelse för oljepriset.
Joker
Den största risken för vårt scenario med lägre oljepris ser vi i en finansiell kollaps i Venezuela som spiller över på oljeproduktionen eller mer aktivt motstånd bland saudiske prins MBS rivaler. Den annonserade försäljningen av Aramco uppges åter få skjutas fram, ett tydligt tecken på allt inte går på räls för den Saudiske ledaren.
Ädelmetaller
 Guldet gynnas av ökad oror
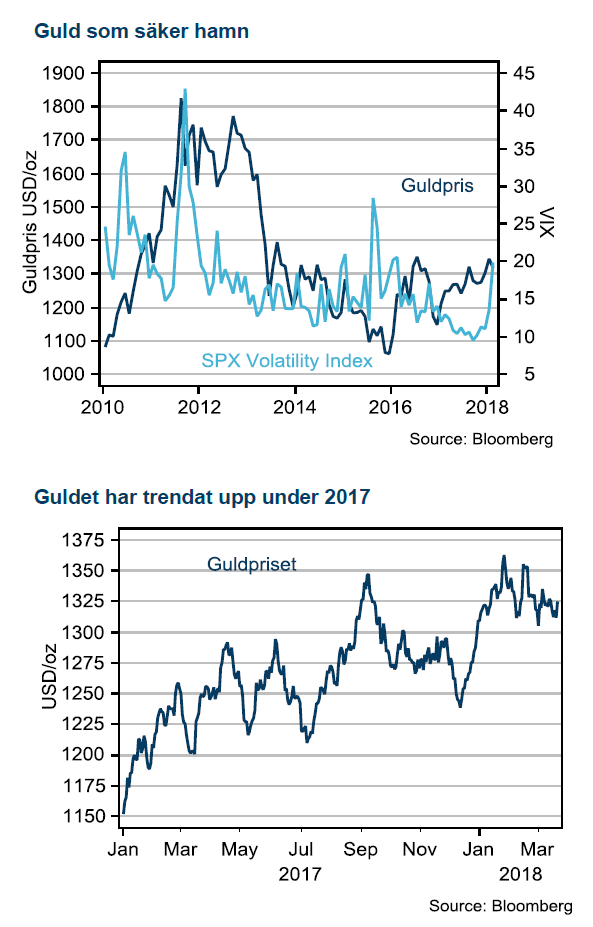
Guldpriset har stigit 5,7% sedan december och fått en mycket tydligare koppling till risk och oro. Största hickan på senare år kom 2016 under Brexitomröstningen. Vid större händelser har guld återfått sin glans men faller tillbaka från topparna så länge börsen fortsätter stiga. Nordkoreas vapenskrammel och annan politisk risk såsom valet i Italien och Trumps handelskrig har varit starka drivkrafter för guld. Vi ser en tydlig trend där guld blir allt mer intressant i takt med att bågen späns i värderingar i andra sektorer under 2017. Under 2018 har början på året präglats av ökad volatilitet på samtliga tillgångsmarknader.
Fed höjer vidare
USA tror vi har mindre betydelse för guld framöver. Fed har genomfört fem höjningar som passerat marknaden utan något problem. Marknaden har också börjat prisa upp fyra höjningar, istället för de tre som Fed planerar under 2018. Trots Fed:s optimistiska syn på konjunkturen räknar vi med att de finansiella förhållandena försämras framöver. Vår prognos är att Fed slutar höja styrräntan 2018 efter höjning i mars, juni och september, därefter drabbas USA av lågkonjunktur 2019. I det scenariot står guld kvar som en fast tillgång som investerare gillar.
Jordbruk
 Neutrala till negative utsikter för vete
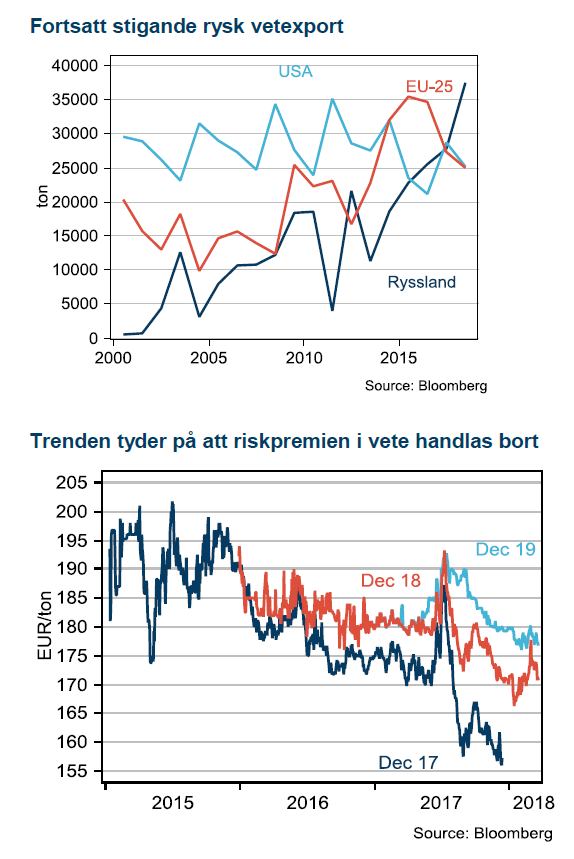
Veteterminer i både Paris och Chicago steg i pris under andra halvan av februari månad, drivet av främst oro för torrt väder i viktiga höstveteregioner i USA. Plantorna har tagit skada av det torra vädret men en hel del nederbörd har fallit den senaste tiden och mer tycks vara på väg, vilket fått priserna att åter falla tillbaka ned till nästan samma nivå som innan uppgången startade – som vanligt har förhållandevis mer volatila Chicagovetet haft större rörelser både upp och ned jämfört med det franska MATIF-vetet.
Vad som också drivit på vetepriserna i uppgången är torrt väder även i Argentina – vilket drabbat främst majs och sojaodlingar. Starka kopplingar finns mellan dessa grödor och vete vilket gjort att prisuppgången för dessa råvaror gett extra press uppåt på vetet. Dock har det nu regnat även i Argentina och priserna på majs och soja har också fallit tillbaka.
Väder styr
Återigen har en väderrelaterad riskpremie byggts upp för att sedan försvinna lika snabbt som den kom, vi såg det nu och vi såg det än tydligare månadsskiftet juli/augusti förra året. Dessa situationer kommer dyka upp igen och visar sig ofta vara bra säljtillfällen. Det är lätt att konstatera i efterhand att marknaden ofta överreagerar och det gamla talessättet ”buy the rumor sell the fact” ter sig ganska passande här. Där fakta just nu är att det finns gott om vete att tillgå i världen och mycket ska till för att ändra på det. Fakta är också att redan nu har ryska inflytelserika analytiker en prognos för inhemsk veteskörd år 2018 överstigande den de för ett år sedan hade för rekordskörden år 2017.
Vi står fast i vår prognos om förfall på MATIF vete termin december 2018 kring EUR 160, vilket i skrivande stund motsvarar en nedgång på 6,5 procent.
[box]Handelsbankens råvarukommentar är producerad av Handelsbanken och publiceras i samarbete och med tillstånd på Råvarumarknaden.se[/box]
Ansvarsbegränsning
Handelsbanken Capital Markets, som är en division inom Svenska Handelsbanken AB (publ) (i fortsättningen kallad ”SHB”), är ansvarig för sammanställningen av analysrapporter. I Sverige står SHB under tillsyn av Finansinspektionen, i Norge av norska Finansinspektionen, i Finland av finska Finansinspektionen och i Danmark av danska Finansinspektionen. Alla analysrapporter bygger på information från handels- och statistiktjänster och annan information som SHB bedömt vara tillförlitlig. SHB har emellertid inte själv verifierat informationen och kan inte garantera att informationen är sann, korrekt eller fullständig. I den mån lagen tillåter tar varken SHB, styrelseledamöter, tjänstemän eller medarbetare, eller någon annan person, ansvar för någon som helst förlust, oavsett om den uppstår till följd av användning av en analysrapport eller dess innehåll eller på annat sätt uppstår i anslutning till något i denna.


Market is starting to take US/Iran headlines with a pinch of salt. Brent crude rose $2.8/b yesterday to an official close of $112.1/b. But after that it traded as low as $108.05/b before ending late night at around $109.7/b. Through the day it traded in a range of $106.87 – 112.72/b amid a flurry of news or rumors from Iran and the US. ”US temporary sanctions during negotiations” (falls alarm). ”We will bomb Iran” (not anyhow),… etc. While the market is still fluctuating to this kind of news flow, it is starting to take such headlines with a pinch of salt.

We’ll see. Maybe, maybe not. The Brent M1 contract is trading at $110.2/b this morning which very close to the average ticks through yesterday of $110.4/b.
Trump with bearish, verbal intervention whenever Brent trades above $110/b it seems. What seems to be a pattern is that Trump states something like ”very good negotiations going on with Iran”, ”New leaders in Iran are great,..”, ”Great progress in negotiations,…”, ”Deal in sight,..” etc whenever the Brent M1 contract trades above $110/b. An effort to cool the market. These hot air verbal interventions from Trump used to have a heavy bearish impact on prices, but they now seems to have less and less effect unless they are backed by reality.
As far as we can see there has been no real progress in the negotiations between the US and Iran with both sides still standing by their previous demands.
Iran is getting stronger while the cease fire lasts making a return to war for Trump yet harder. Iran is naturally in constant preparation for a return to war given Trump’s steady threats of bombing Iran again. Iran is naturally doing what ever is possible to prepare for a return to war. And every day the cease fire lasts it is better prepared. This naturally makes it more and more difficult and dangerous for the US to return to warring activity versus Iran as the consequences for energy infrastructure in the Persian Gulf will be more and more severe the longer the cease fire lasts. Israel seems to see it this way as well. That the war is not won and that current frozen state of a cease fire gives Iran opportunity to rebuild military and politically.
Global inventories are drawing down day by day. How much? In the meantime the Strait of Hormuz stays closed. There is varying measures and estimates of how much global inventories are drawing down. Our rough estimate, back of the envelope, is that global inventories are drawing down by at least some 10 mb/d or about 300 mb/d in a balance between loss of supply versus demand destruction. Other estimates we see are a monthly draw of 250-270 mb/d. The IEA only ’measured’ a draw in global observable stocks of 117 mb in April with oil on water rising 53 mb while on shore stocks fell 170 mb. But global stocks are hard to measure with large invisible, unmeasured stocks. As such a back of the envelope approach may be better.
Oil products is what the world is consuming. Oil product prices likely to rise while product stocks fall. Strategic Petroleum Reserves (SPR) are predominantly crude oil. Discharging oil from OECD SPR stocks, a sharp reduction in Chinese crude imports and a reduction in global refinery throughput of 6-7 mb/d has helped to keep crude oil markets satisfactorily supplied. But global inventories are drawing down none the less. And oil products is really what the world is consuming. So if global refinery throughput stays subdued, then demand will eventually have to match the supply of oil products. The likely path forward this summer is a steady draw down in jet fuel, diesel and gasoline. Higher prices for these. Then, if possible, higher refinery throughput and higher usage of crude in response to very profitable refinery margins. And lastly sharper draw in crude stocks and higher prices for these. But some 6 mb/d of oil products used to be exported through the Strait of Hormuz. And it may not be so easy to ramp up refinery activity across the world to compensate. Especially as Ukraine continues to damage Russian refineries as well as Russian crude production and export facilities.
Watch oil product stocks and prices as well as Brent calendar 2027. What to watch for this summer is thus oil product inventories falling and oil product premiums to crude rising. Another measure to watch is the Brent crude 2027 contract as it rises steadily day by day as the Strait of Hormuz stays closed and global oil inventories decline. The latter is close to the highest level since the start of the war and keeps rising.
The Brent M1 contract and the Brent 2027 prices and current price of jet fuel in Europe (ARA). All in USD/b

Our back of the envelope calculation of the global shortage created by the closure of the Strait of Hormuz. Note that 3.5 mb/d of discharge from SPR is also a draw. Note also that ’Forced demand loss’ of 2.5 mb/d is probably temporary and will fall back towards zero as logistics are sorted out leaving ’Price demand loss’ to do the job of balancing the market. Thus a shortfall of at least 9 mb/d created by the closure. More if SPR discharge is included and more if Forced demand loss recedes.

Brent is climbing higher. Front-month is at USD 106.3/bl this morning, close to a weekly high and a USD 9/bl jump from Mondays open. This is the move we flagged as a risk earlier in the week: the market shifting from ”a deal is around the corner” to ”this is going to take longer than we thought”.

Analyst Commodities, SEB
During April, rest-of-year Brent remained remarkably stable around USD 90/bl. A stability which rested on one single assumption: the SoH reopens around 1 May. That assumption is now slowly falling apart.
As we highlighted yesterday: every week of delay beyond 1 May adds (theoretically) ish USD 5/bl to the rest-of-year average, as global inventories draw 100 million barrels per week. i.e., a mid-May reopening implies rest-of-year Brent closer to USD 100/bl, and anything pushing into June or July takes us meaningfully higher.
What’s changed in the last 48 hours:
#1: The US military has formally warned that clearing suspected sea mines from SoH could take up to six months. That is a completely different timescale from what the financial market is pricing. Even a political deal tomorrow does not immediately reopen the strait.
#2: Trump has shifted his tone from urgency to ”strategic patience”. In yesterday’s press conference: ”Don’t rush me… I want a great deal.” The market is reading this as a president no longer feeling pressured by timelines, with the naval blockade running in the background.
#3: So far, the military activity is escalating, not de-escalating. Axios reports Iran is laying more mines in SoH. The US 3rd carrier strike group (USS George H.W. Bush) is arriving with two countermine vessels. Trump yesterday ordered the US Navy to destroy any Iranian boats caught laying mines. While CNN reports that the Pentagon is actively drawing up plans to strike Iranian SoH capabilities and individual Iranian military leaders if the ceasefire collapses. i.e., NOT a attitude consistent with an imminent deal!
Spot crude and product prices eased off the early-April highs on a combination of system rerouting and deal optimism. Both now weakening. Goldman estimates April Gulf output is reduced by 14.5 mbl/d, or 57% of pre-war supply, a number that keeps getting worse the longer this drags on.
Demand-side adaptation is ongoing: S. Korea has cut its Middle East crude dependence from 69% to 56% by pulling more from the Americas and Africa, and Japan is kicking off a second round of SPR releases from 1 May. But SPRs are finite.
Ref. to the negotiations, we should not bet on speed. The current Iranian leadership is dominated by genuine hardliners willing to absorb economic pain and run the clock to extract concessions. That is not a setup for a rapid resolution. US/Israeli media briefings keep framing the delay as ”internal Iranian divisions”, the reality is more complicated and points toward weeks and months, not days.
Our point is that the complexity is large, and higher prices have only just started (given a scenario where the negotiations drag out in time). The market spent April leaning on the USD 90/bl rest-of-year assumption; that case is diminishing by the hour. If ”early May reopening” is replaced by ”June, July or later” over the next week or two, both crude and products have meaningful room to reprice higher from here. There is a high risk being short energy and betting on any immediate political resolution(!).
Down on Friday. Up on Monday. The Brent June crude oil contract traded down 5.1% last week to a close of $90.38/b. It reached a high of $103.87/b last Monday and a low of $86.09/b on Friday as Iran announced that the Strait of Hormuz was fully open for transit. That quickly changed over the weekend as the US upheld its blockade of Iranian oil exports while Iran naturally responded by closing the SoH again. The US blew a hole in the engine room of the Iranian ship TOUSKA and took custody of the ship on Sunday. Brent crude is up 5.6% this morning to $95.4/b.
The cease-fire is expiring tomorrow. The US has said it will send a delegation for a second round of negotiations in Islamabad in Pakistan. But Iran has for now rejected a second round of talks as it views US demands as unrealistic and excessive while the US is also blocking the Strait of Hormuz.
While Brent is up 5% this morning, the financial market is still very optimistic that progress will be made. That talks will continue and that the SoH will fully open by the start of May which is consistent with a rest-of-year average Brent crude oil price of around $90/b with the market now trading that balance at around $88/b.
Financial optimism vs. physical deterioration. We have a divergence where the financial market is trading negotiations, improvements and resolution while at the same time the physical market is deteriorating day by day. Physical oil flows remain constrained by disrupted flows, longer voyage times and elevated freight and insurance costs.
Financial markets are betting that a US/Iranian resolution will save us in time from violent shortages down the road. But every day that the SoH remains closed is bringing us closer to a potentially very painful point of shortages and much higher prices.
The US blockade is also a weapon of leverage against its European and Asian allies. When Iran closed the SoH it held the world economy as a hostage against the US. The US blockade of the SoH is of course blocking Iranian oil exports. But it is also an action of disruption directed towards Europe and Asia. The US has called for the rest of the world to engaged in the war with Iran: ”If you want oil from the Persian Gulf, then go and get it”. A risk is that the US plays brinkmanship with the global oil market directed towards its European and Asian allies and maybe even towards China to force them to engage and take part. Maybe unthinkable. But unthinkable has become the norm with Trump in the White House.


Sommarväder skapar prisrally på elbörsen
Oil product price pain is set to rise as the Strait of Hormuz stays closed into summer

Solkraften pressar elpriserna dagtid

Michel Gubel ger sin syn på oljemarknaden