

Analys
SIP Nordic – Råvaruguiden – februari 2013

 De flesta investerar i en enskild tillgång för att de tror på uppgång alternativt en nedgång i samma underliggande. Vad många ibland missar är att det finns goda möjligheter till avkastning om man investerar i en skillnad mellan två eller flera tillgångar. Ett sådant tillfälle finns nu i skillnaden i pris mellan guld och platina. Frågan är åt vilket håll det ska gå. Kanske dags för ett spread bet?
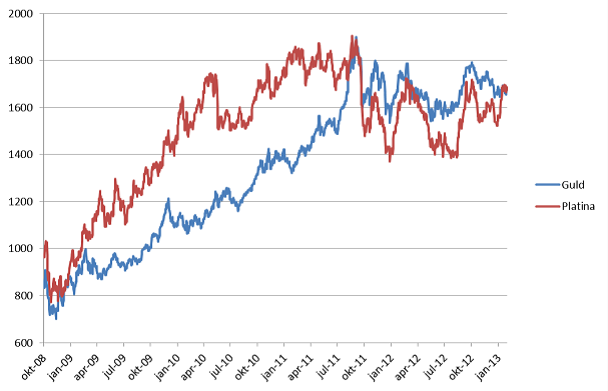
Platina och gulds utveckling sedan 2008. Guld har sedan september 2011 handlats till ett dyrare pris än platina. Något som nu kan ändras.
Historiskt har platina handlats på en högre nivå än guld men detta förändrades i september 2011. Detta till följd av att den dystra utsikten för den globala ekonomin drabbade industrimetaller, såsom platina, samtidigt som investerare sökte sig mot den säkra hamnen som guld ansågs vara. Skillnaden mellan priset var som mest drygt $200 i september 2012.
Trots att guld spås ha ännu ett år av positiv utveckling finns det mycket som talar för att platina kommer att utvecklas ännu bättre. (se text om guld och platina nedan)
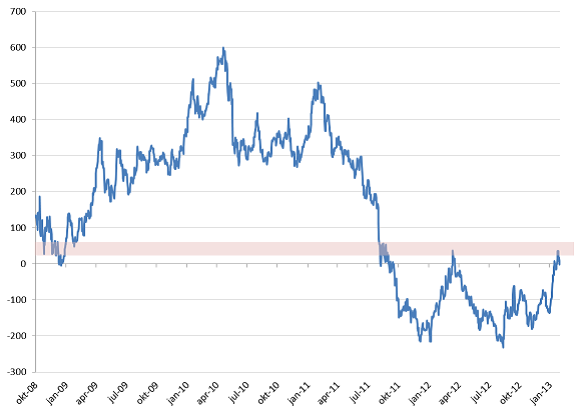
Skillnaden i pris mellan platina och guld (platina – guld) är återigen vid nollinjen. En nivå som tidigare testats.
Skillnaden i pris mellan guld och platina (spread) är nu åter vid nollinjen (se bild ovan). Om man tror att spreaden nu ska öka, till platinas fördel, kan man använda följande strategi.
Köp: MINILONG PLAT A
Köp: MINISHRT GULD P
Denna trade kan generera positiv avkastning om platinapriset ökar mer än vad guldpriset gör. Denna trade kan också vara fördelaktig även om både platina- och guldpriset tappar i värde. Så länge som guld tappar mer än platina.
Självklart fungerar det att spekulera i det motsatta. D.v.s. att skillnaden i pris mellan de två råvarorna kommer att öka till gulds fördel. Då kan man istället använda följande produkter.
Köp: MINILONG GULD G
Köp: MINISHRT PLAT B
Råvaror – Energi
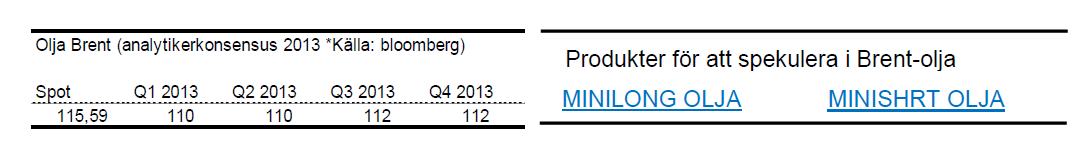
Brent olja
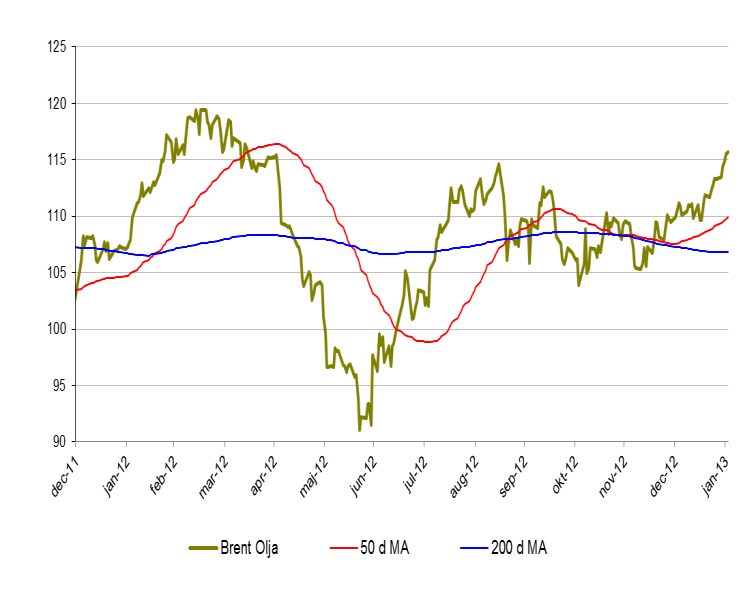
- Brentoljan har startat året mycket positivt. Upp dryga 5 % under januari månad.
- Brent närmar sig nu en viktig motståndsnivå kring $118 USD.
- Oljepriset steg under januari månad till följd av signaler på att den amerikanska ekonomin är på bättringsvägen. Något som spekulanter tror kan få fart på oljekonsumtionen igen.
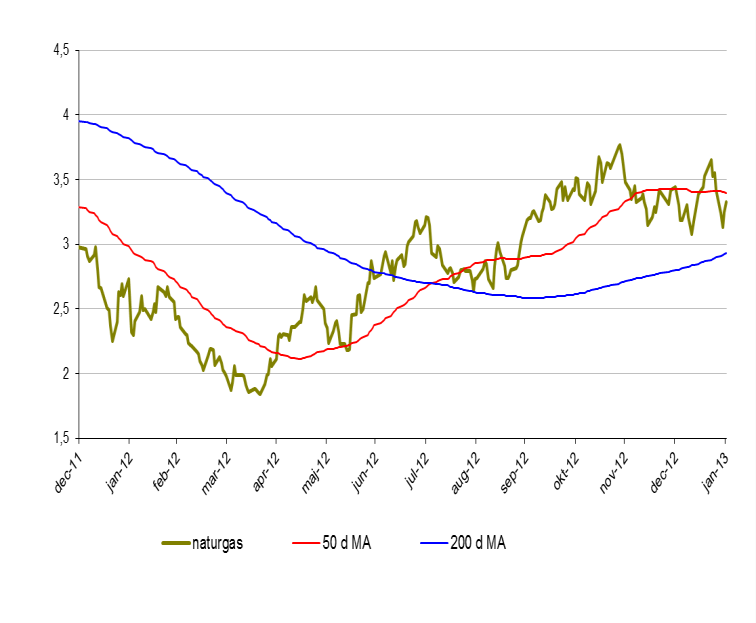
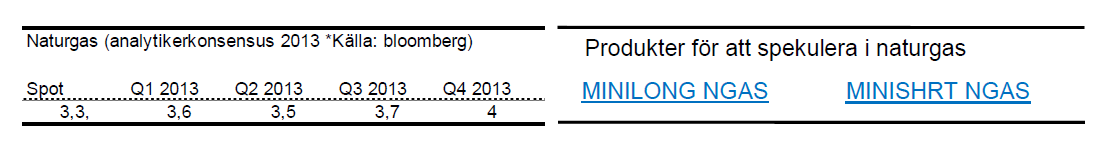
Naturgas
- Priset på naturgas föll under januari månad knappa 4 %.
- Lagren av naturgas är fortfarande höga. Ca 12 % över medelvärdet (5 år).
- Lagren är dock mindre jämfört med samma period förra året. Något som kan vända den negativa kortsiktiga trend som naturgas hade under januari.
Råvaror – Metaller
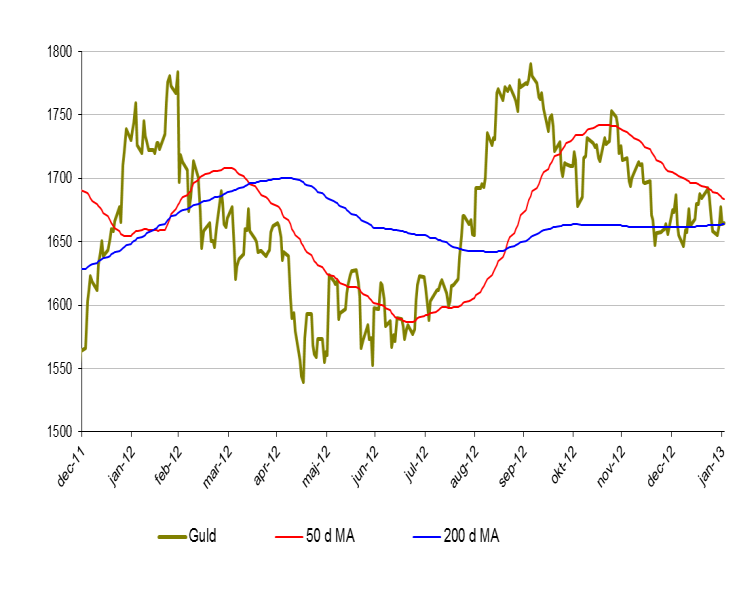
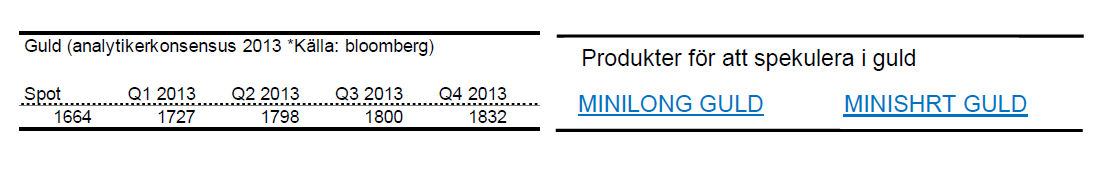
Guld
- Guldpriset ökade marginellt under januari. 0,4 % upp.
- Med signaler om en starkare global ekonomi i kombination med en större vilja att flytta pengar från ”säkra hamnar” till aktiemarknaden, kommer även en svagare guldutveckling.
- Rapporter om minskad handel av fysiskt guld i Asien jämfört med föregående år kan även påverka guldet negativt på kort sikt.
- Den amerikanska penningpolitiken kommer till stor del fortsatt styra utvecklingen av guldpriset.
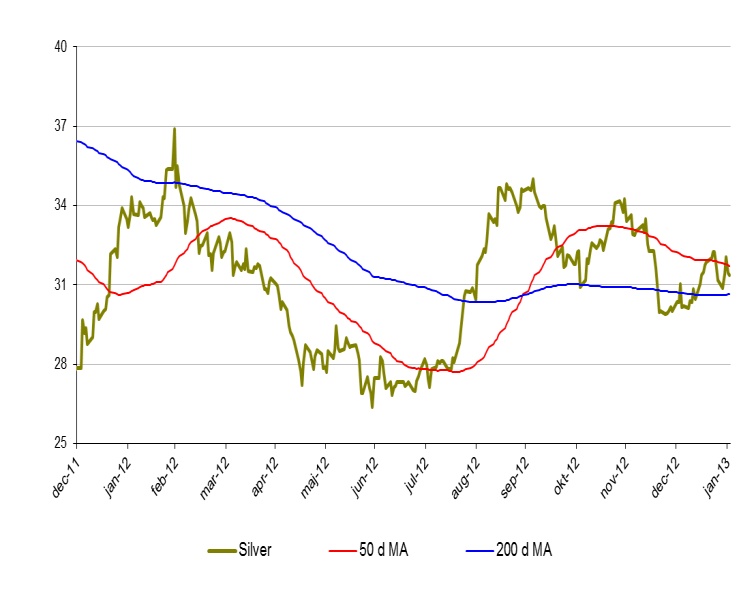
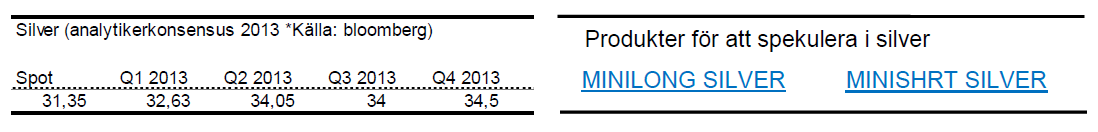
Silver
• Silver överpresterade guld under januari månad. Upp 4,7 %.
• Efterfrågan på fysiskt silver ökar.
• Indiens export av silver väntas öka med runt 30 % till följd av ökad efterfrågan.
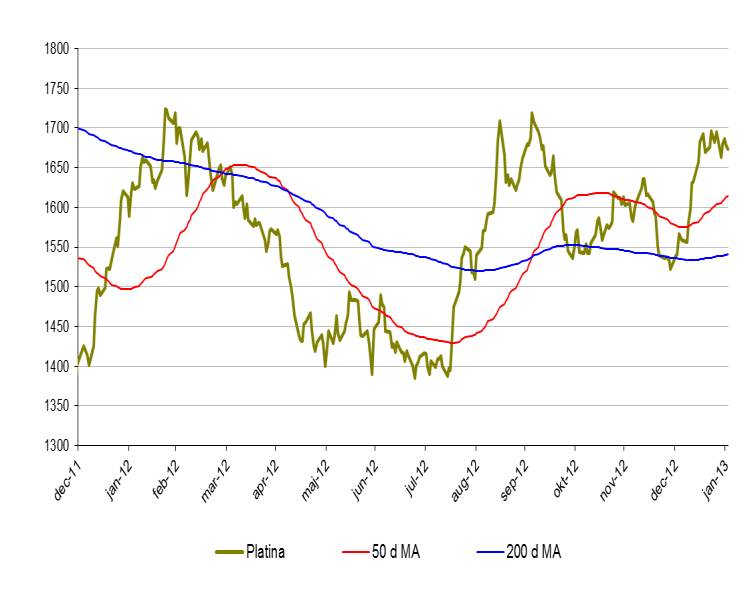
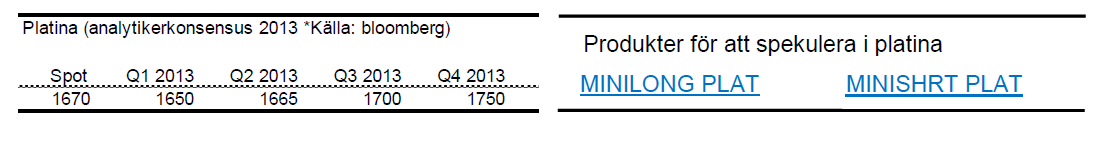
Platina
- Platinapriset steg kraftigt under januari. Upp nästan 10 % under januari månad.
- Detta gör att platina nu handlas till ett högre pris än guld. (Första gången sedan 2011)
- Nettopositionerna i platinaterminer är i stor övervikt för långa kontrakt.
- Efterfrågan på platina är hög samtidigt som produktionskostnaderna fortsatt är höga. Något som pressar priset uppåt.
- Sviterna efter de stora strejkerna i de Sydafrikanska gruvorna gör sig fortfarande påminda och gruvorna är inte än uppe i full produktionstakt.
- Sydafrika står för en mycket stor del av den globala platinaproduktionen.
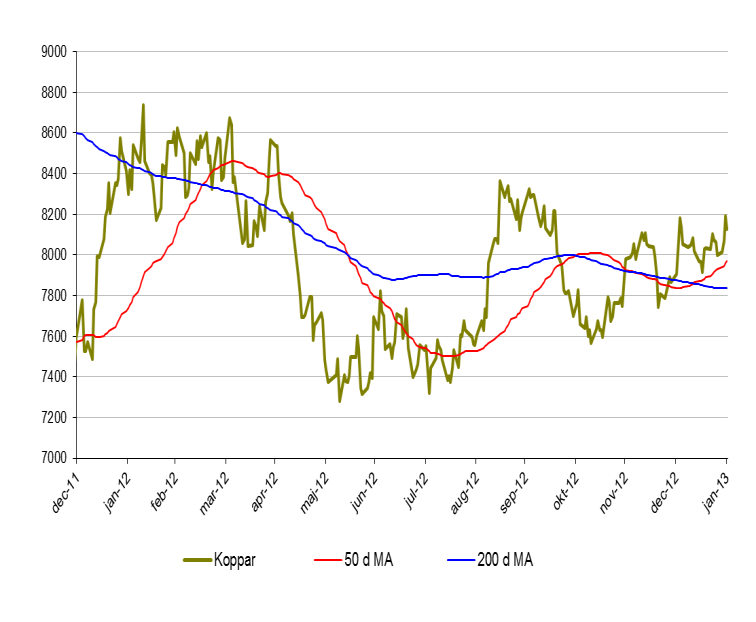
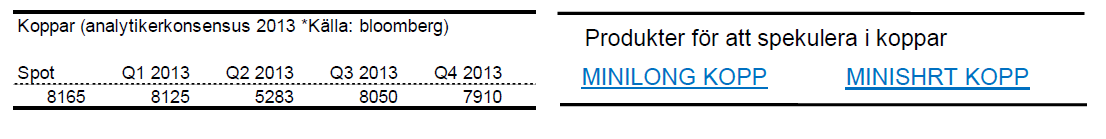
Koppar
- Priset på koppar ökade 3,2 % under januari.
- Kopparproduktionen förväntas öka med cirka 3 % under 2013 till följd av ökad efterfrågan ibland annat Kina och Indien.
- Priset på industrimetallerna hjälps till stor del av en svagare USD.
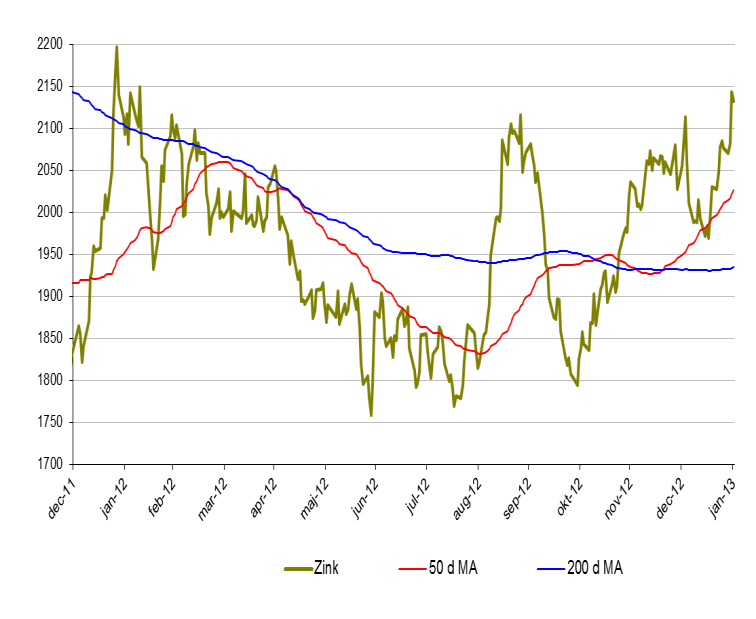
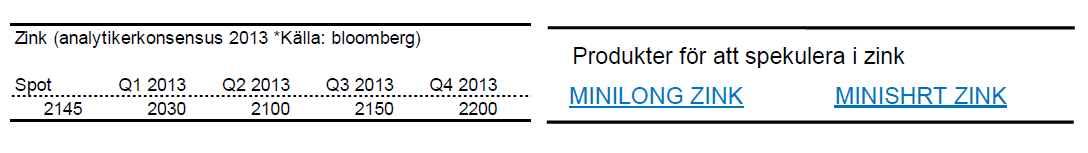
Zink
- Priset på zink åkte berg och dalbana under januari och stängde till slut 4,8 % upp.
- Likt andra basmetaller hjälper en svagare dollar kursen uppåt.
- Rapporter indikerar på en lägre produktionssiffra under 2013. Någon som kan få priset på zink att klättra ytterligare.
- Zink närmar sig nu viktiga nivåer kring 2150 där vi har en rad motståndsnivåer. Blir intressant att följa under 2013.
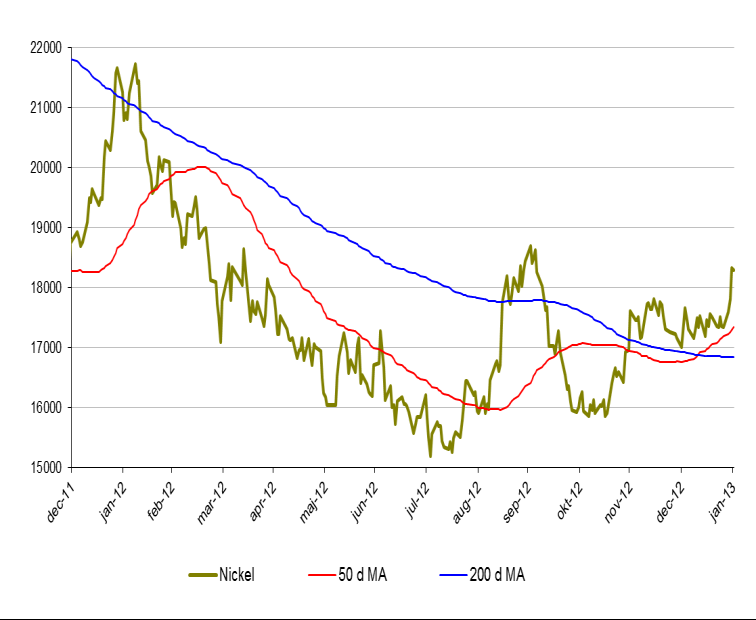
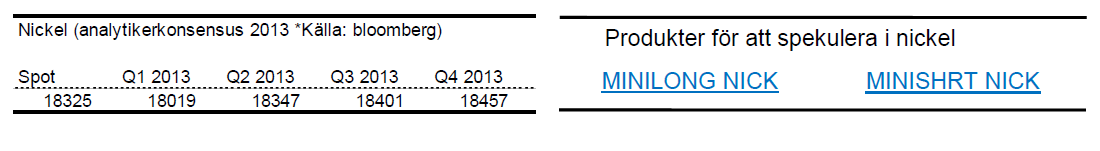
Nickel
- Nickel återhämtade nästan hela förra årets nedgång under januari. Upp 7,5 % totalt.
- Viktiga motståndsnivåer kring 18 400. Om detta område passeras är nästa nivå 22 000.
Råvaror – Jordbruk
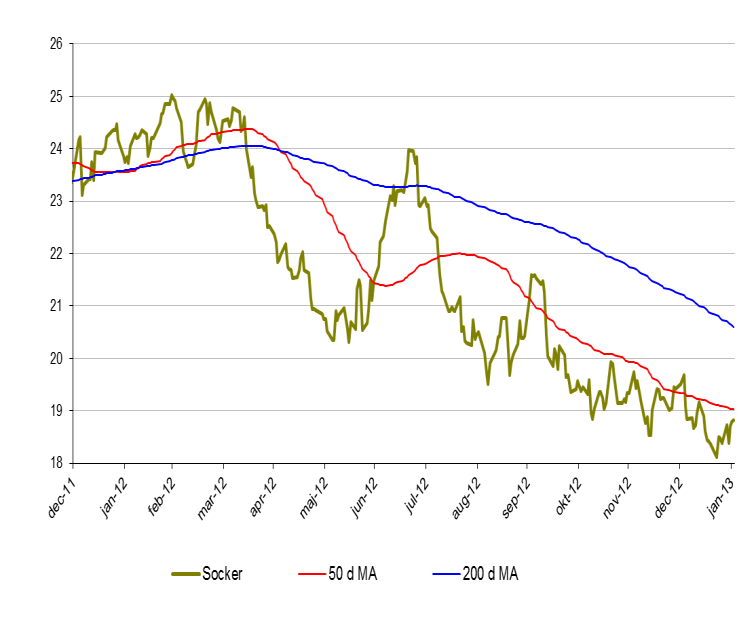
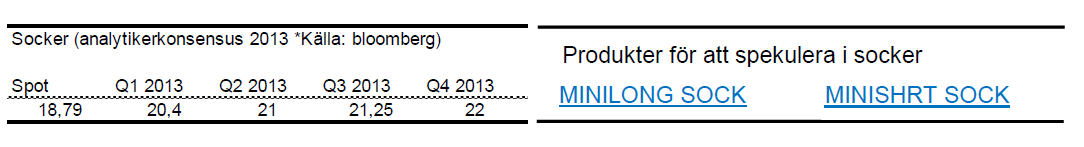
Socker
- Socker fortsätter i sin negativa trend. Ned 3 % i januari.
- Produktionen överstiger än konsumtionen kraftigt.
- Investerare ligger fortsatt i överhängande negativa positioner.
- Rapporter om att etanol ska åläggas en extra tullavgift i EU är inte positivt för socker som till viss del används för etanolproduktion.
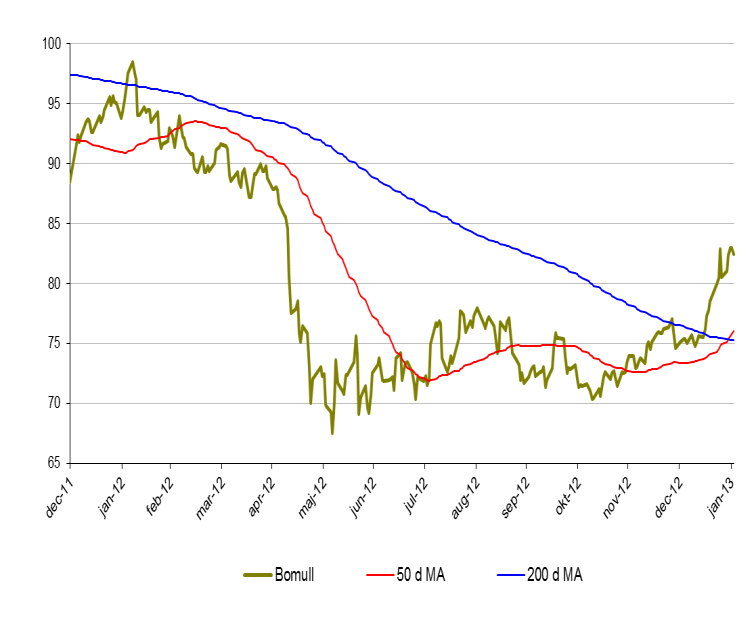
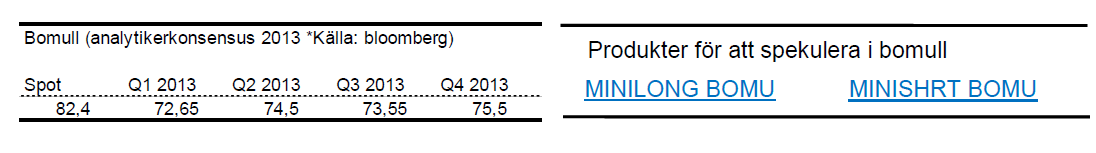
Bomull
- Bomull befinner sig i en kortsiktigt positiv trend. Sedan oktober förra året är bomull upp dryga 20 %.
- För januari är priset på bomull upp 11 %.
- Uppgången kan till stor härledas till en överaskande stark amerikansk och indisk export.
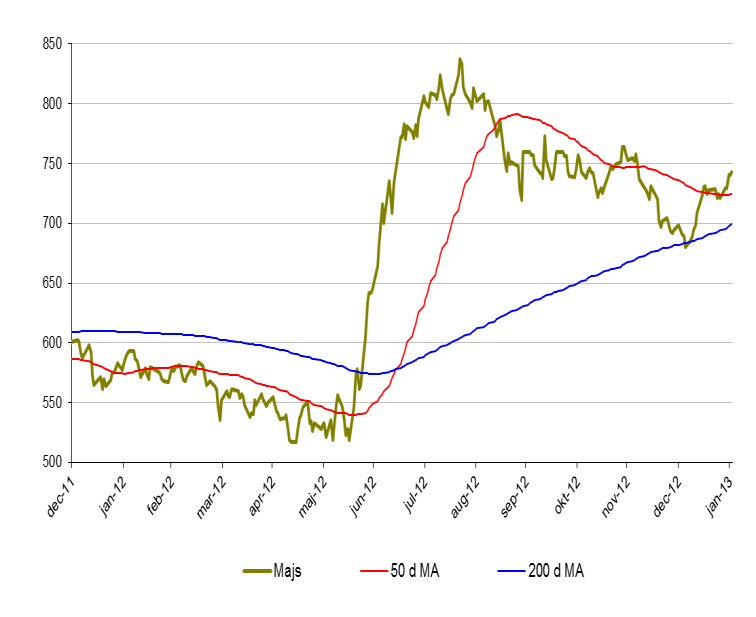
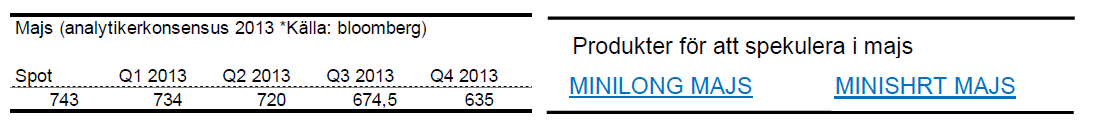
Majs
- För januari är majspriset upp 6,7 %.
- Uppgången kan dämpas då det spås att majsskörden kan bli mycket stor under sommaren 2013.
- Ytterligare faktorer som pekar på en avsvalnad kurs är lägre efterfrågan från etanol- och boskapsproducenter.
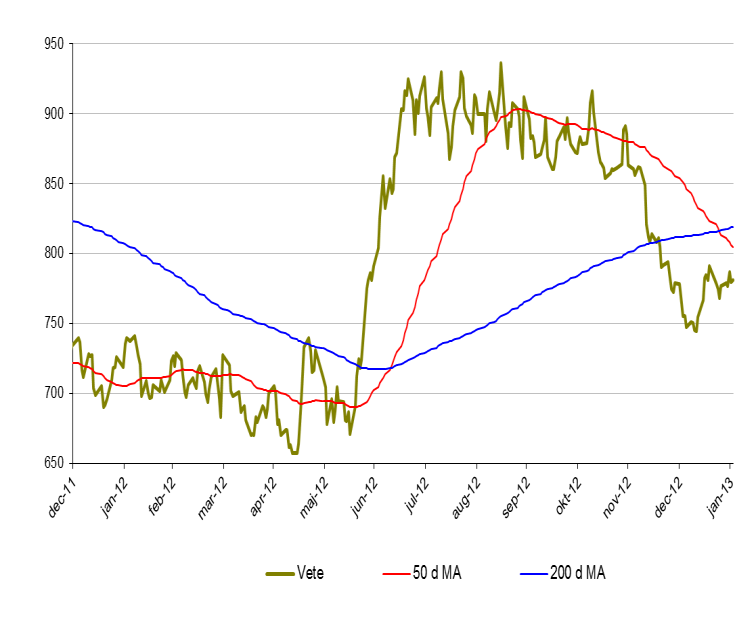
Vete
- Vete hade likt majs ett svängigt 2012.
- Under januari månad minskade priset på vete med 0,3 %.
- Den fortsatta utvecklingen för vete är osäker då det kommer tvetydiga rapporter om tillgång och efterfrågan.
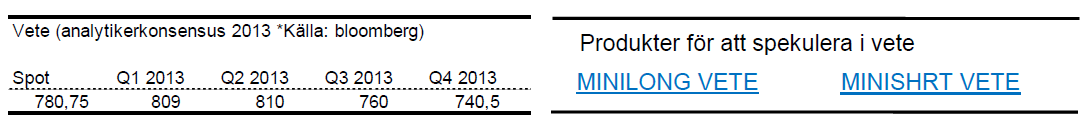
Apelsinjuice
- Apelsinjuice är i stort sett oförändrat under januari.
- Apelsinjuice befinner sig dock i ett mycket intressant läge där den negativa trenden nu verkar ha bytts mot det positiva.
- Viktiga nivåer kring 123 cents.
- Priset på apelsinjuice är fortfarande 70 % högre än botten 2009. Fallhöjden är således hög. Mycket hög.
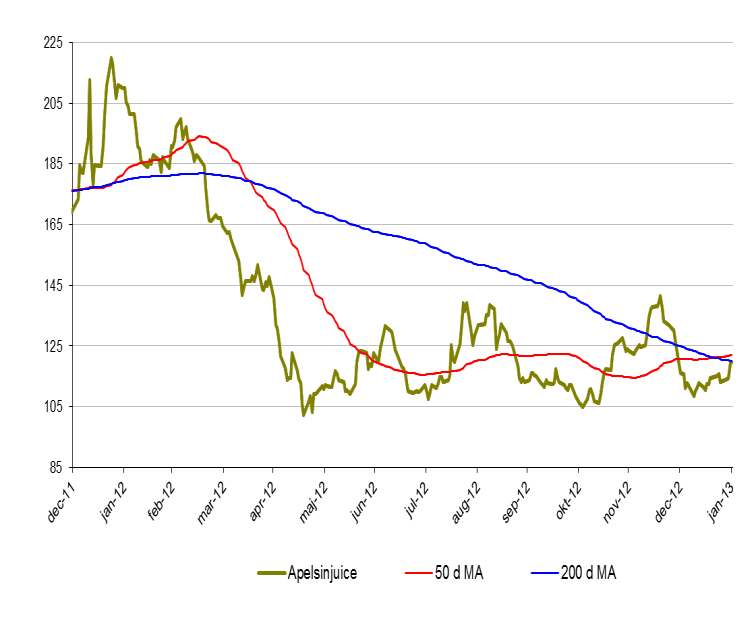
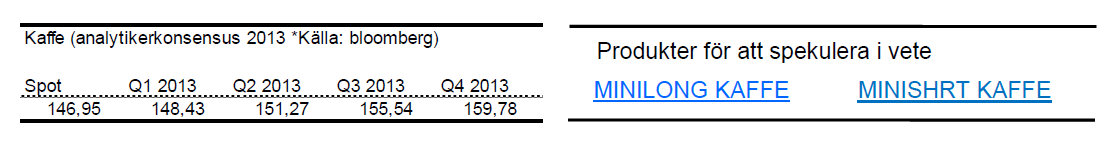
Kaffe
- Kaffe utvecklades under januari svagt uppåt. + 0,6 %.
- Kaffe kan mycket väl utvecklas positivt framöver till följd av låg produktion ibland annat Guatemala. Plantorna har i dessa regioner angripits av mögel vilket dämpar tillgången.
[box]Denna uppdatering är producerat av SIP Nordic och publiceras i samarbete och med tillstånd på Råvarumarknaden.se[/box]
Ansvarsbegränsning
Detta produktblad utgör endast marknadsföring och har sammanställts av SIP Nordic Fondkommission AB.
Innehållet ger inte fullständig information avseende det finansiella instrumentet. Investerare uppmanas att del av prospekt och slutliga villkor, vilka finns tillgängliga på: www.rbsbank.se/markets, innan ett investeringsbeslut tas.
Förekommande exempel är simulerade och baseras på SIP Nordics egna beräkningar och antaganden, en person som använder andra data eller antaganden kan nå andra resultat. Administrativa avgifter och transaktionsavgifter påverkar den faktiska avkastningen.

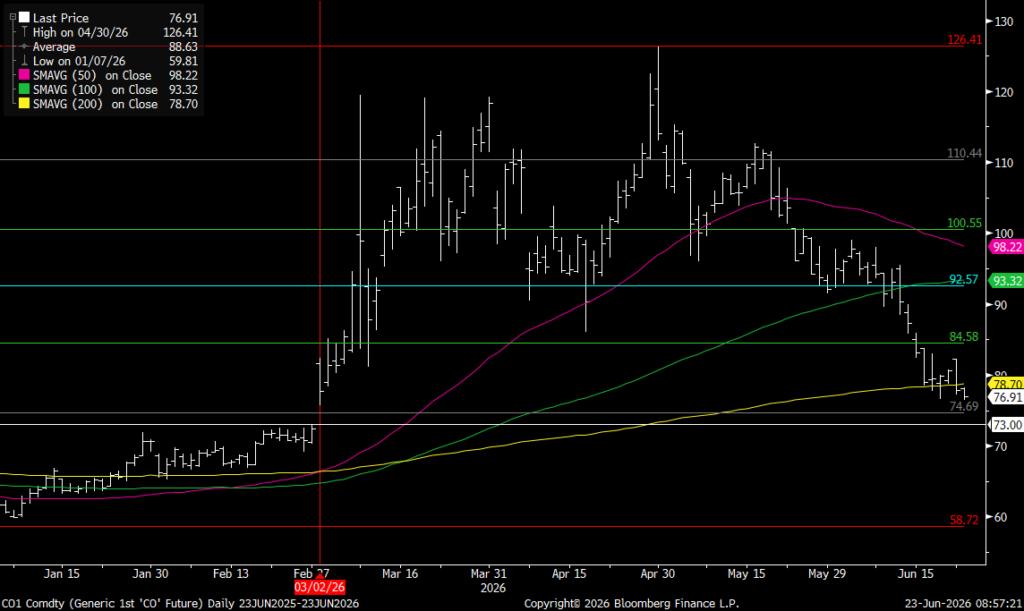
Brent M1 moving below the 200 dma of $78.7/b. Brent crude continued its move lower yesterday with a decline of 3.3% to $77.9/b. This morning it is adding another drop of 1.4% to $76.8/b. Israel bombing Lebanon during the weekend was a violence of the MoU and Iran was quick to declare the SoH closed again. But the willingness to move forward by both the US and Iran obviously trumped the bombing in Lebanon making the event more of a hiccup on the road of further negotiations.

The US has now waived sanctions against Iranian oil exports for two months allowing Iran to sell its oil all over the world, though sanctions instated in Europe will take more time to unwind. Oil from Iran, Russia as well as Venezuela can for the time being be sold across the world without any sharp discount due to sanctions. Chinese Tea-pot refineries will suffer as they previously could buy rebated crude while selling products at market prices.
Crude oil is no flowing out of the SoH with latest number close to 7 mb/d on a three day moving average. That is still well below the 14 mb/d of crude and 6 mb/d of products normally flowing out of the SoH. Latest estimate is that there is around 80 mb of crude on water inside the Persian Gulf and maybe another 80 mb of oil products on water as well. If crude is exiting the SoH at a rate of around 7 mb/d, then the 80 mb of crude would be depleted within 10-15 days and there after the flow would rely on new crude tankers entering, loading and then exiting the SoH to continue further flows. Given the uncertainties surrounding the status of the SoH with Iran stating that it was closed again as recent as this weekend, there is likely an asymmetry here where ships and oil stranded in the SoH for months are much more eager to exit than new ships are eager to enter.
For now Brent crude keeps falling like a rock with the front-end Brent contract now only trading at a premium of $7.6/b above the five year contract. Quickly heading towards parity. The Brent M1 contract has now broken below its 200 dma of $78.7/b and is closing in on the Fibo-level at $74.7/b. Below that there is not much more supporting levels to be found before $73/b which would close the gap from February 3.
Brent crude M1 technical levels
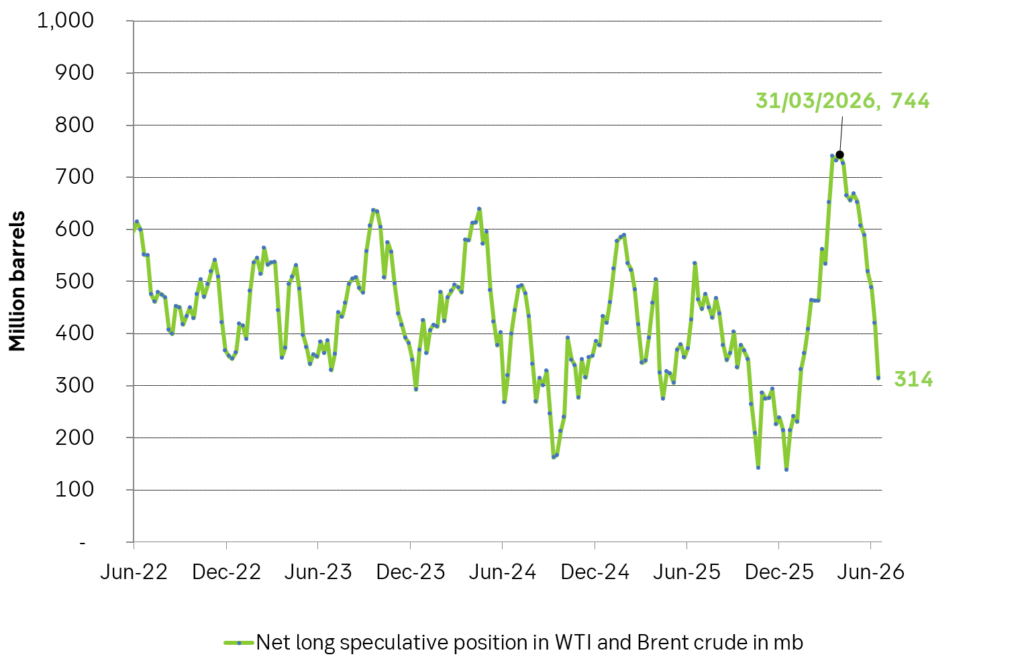
Net long speculative positions are also falling like a rock and as of Tuesday last week the net long positioning in Brent and WTI together summed to 314 million barrels and falling fast.
Will there be a rebound? A possible combination could be an exhaustion of the oil blob caught within the SoH within 1-2 weeks if exits continue at current rate while new ships entering are much more cautious, more Israeli bombardments in Lebanon as Netanyahu fights for re-election, a temporary closure of the SoH again while speculative short positions take cover buying back and covering their positions.
US and Israeli stands versus Iran could harden beyond elections so 2027 surplus is far from given. But Iran and the US are all in all moving towards a set of solutions with both clearly eager to reopen the SoH and keep it open. And that is what the market is pricing along with sharply falling prices. The ongoing discussions will likely take months and last beyond both the upcoming Israeli election (before 27 oct) and the US midterm elections on 3 Nov. Beyond those dates the stance by both Israel and the US may harden again versus Iran. But Iran knows that and is most likely preparing for such a hardening turn. Thus a surplus of oil and global oil stock rebuilding in 2027 (as now is mostly projected) is far from given.
Selling down on a ”deal”. Brent crude fell 6.2% last week with accelerated weakness towards the end of the week. Close of the week at $87.33/b and low of the week (and on Friday) of $85.8/b. Brent is falling another 4% this morning to $83.7/b on confirmation by Iran that a MoU text has been reached and that it will be signed on Friday this week.
So what is this ”deal” worth? Talk on the desk here this morning is that it is much like ”putting lipstick on a pig” where Trump has to sell this at home as a victory where ”the SoH has reopened”, the nuclear issue will be ironed out over the coming 60 days (or maybe 600 days?) and US consumers are getting a lower gasoline price and maybe US republicans survives the midterm elections.
The importance for Iran is that it emerges as the defacto winner of this war in the eyes of the non-US public world. That Iran now onwards is the ”ruler of the SoH” (combo of geography and new weapons systems like drones) or more softer: ”the guarantor of safe passage through the SoH”.
Iran doesn’t need nuclear weapons any more. Nuclear deterrence doesn’t work any more. Ukraine has made many attacks deep into Russia without being nuked in return. Plenty of Iranian ballistic rockets blasts over Israel but Iran wasn’t nuked in return.
There is no trust between the US and Iran. We don’t know all the details yet of the MoU. But what we do know is that there is no trust between the US and Iran what so ever. This is probably more like a descriptive text on how they can cooperate in a way where both sides keeps tactical leverage. Neither side makes irreversible concessions. Violations can be punished quickly. Cooperation produces immediate benefits.
This is a fragile structure. It can easily break down. There may be details which cannot be overcome. To be seen on Friday. The US has to show that it is willing put enough force behind managing and restraining Israel versus Hezbollah in Lebanon. We have seen that Netanyahu hasn’t listened all that much to Trump’s directives and wishes. This could be a major obstacle.
A gradual reopening is tactically preferable for Iran. A tactical leverage for Iran right now is that global oil stocks have been drawn down towards painful and increasingly dangerous levels with increasing risks for oil price spikes in mid-July to August. This together with US midterm elections on 3 November gives tactical leverage to Iran. Iran probably doesn’t want to fully give up on that leverage. A rapid, full reopening where global stocks are able to refill over the coming 60 days will significantly erode that leverage. If Iran reinstates a closure of the SoH after 60 days (if talks break down again), then the effect won’t be that impactful in terms of prices and the US midterm elections.
So a gradual and partial reopening where global markets gets the oil they need while they are unable to rebuild stocks could be a practical middle way for both parties. Trump can sell it as ”the SoH has reopened” and get affordable gasoline for US consumers. Iran can sell it as ”the SoH has fully reopened, but there is some friction” so flow is only 60-80% of normal.
Not much real demand destruction below $100/b. What we do know is that there is not much real price pain demand destruction for oil globally at an oil price below $100/b. A lot of demand-shock destruction. Fear. But demand should now come roaring back towards normal with fear for exceptionally high prices now is rapidly receding.
Sudden China demand destruction due to EVs? Bullocks. EV share of total Chinese carpool now around 13%. Share of new sales of EVs has reached 50%. This is a very gradual process. It doesn’t make oil demand fall like a rock over night. When EV new sales share reaches 100%, then the gasoline car pool will contract by some 5-10% per year. But that is only gasoline. Sudden reduction in Chinese oil demand is more about shock and risk.
Chinese crude oil imports will come roaring back. At what price? Today’s ”neutral” oil price is $70/b. That is the five year price which has steadily traded around the $70/b mark over the past 3-4 years. With still a risky picture one would think that China and the rest of the world will be big buyers of oil in the range of $70-85/b.
Global demand will likely snap back towards normal, forecasted demand and growth at such prices.
Physical reopening is a gradual process. The physical and practical reopening of the SoH will likely be gradual rather than sudden. And that probably suites Iran tactically as well.
Brent M1 price versus the Brent 5-yr (today’s ”normal” price)

Market is starting to take US/Iran headlines with a pinch of salt. Brent crude rose $2.8/b yesterday to an official close of $112.1/b. But after that it traded as low as $108.05/b before ending late night at around $109.7/b. Through the day it traded in a range of $106.87 – 112.72/b amid a flurry of news or rumors from Iran and the US. ”US temporary sanctions during negotiations” (falls alarm). ”We will bomb Iran” (not anyhow),… etc. While the market is still fluctuating to this kind of news flow, it is starting to take such headlines with a pinch of salt.
We’ll see. Maybe, maybe not. The Brent M1 contract is trading at $110.2/b this morning which very close to the average ticks through yesterday of $110.4/b.
Trump with bearish, verbal intervention whenever Brent trades above $110/b it seems. What seems to be a pattern is that Trump states something like ”very good negotiations going on with Iran”, ”New leaders in Iran are great,..”, ”Great progress in negotiations,…”, ”Deal in sight,..” etc whenever the Brent M1 contract trades above $110/b. An effort to cool the market. These hot air verbal interventions from Trump used to have a heavy bearish impact on prices, but they now seems to have less and less effect unless they are backed by reality.
As far as we can see there has been no real progress in the negotiations between the US and Iran with both sides still standing by their previous demands.
Iran is getting stronger while the cease fire lasts making a return to war for Trump yet harder. Iran is naturally in constant preparation for a return to war given Trump’s steady threats of bombing Iran again. Iran is naturally doing what ever is possible to prepare for a return to war. And every day the cease fire lasts it is better prepared. This naturally makes it more and more difficult and dangerous for the US to return to warring activity versus Iran as the consequences for energy infrastructure in the Persian Gulf will be more and more severe the longer the cease fire lasts. Israel seems to see it this way as well. That the war is not won and that current frozen state of a cease fire gives Iran opportunity to rebuild military and politically.
Global inventories are drawing down day by day. How much? In the meantime the Strait of Hormuz stays closed. There is varying measures and estimates of how much global inventories are drawing down. Our rough estimate, back of the envelope, is that global inventories are drawing down by at least some 10 mb/d or about 300 mb/d in a balance between loss of supply versus demand destruction. Other estimates we see are a monthly draw of 250-270 mb/d. The IEA only ’measured’ a draw in global observable stocks of 117 mb in April with oil on water rising 53 mb while on shore stocks fell 170 mb. But global stocks are hard to measure with large invisible, unmeasured stocks. As such a back of the envelope approach may be better.
Oil products is what the world is consuming. Oil product prices likely to rise while product stocks fall. Strategic Petroleum Reserves (SPR) are predominantly crude oil. Discharging oil from OECD SPR stocks, a sharp reduction in Chinese crude imports and a reduction in global refinery throughput of 6-7 mb/d has helped to keep crude oil markets satisfactorily supplied. But global inventories are drawing down none the less. And oil products is really what the world is consuming. So if global refinery throughput stays subdued, then demand will eventually have to match the supply of oil products. The likely path forward this summer is a steady draw down in jet fuel, diesel and gasoline. Higher prices for these. Then, if possible, higher refinery throughput and higher usage of crude in response to very profitable refinery margins. And lastly sharper draw in crude stocks and higher prices for these. But some 6 mb/d of oil products used to be exported through the Strait of Hormuz. And it may not be so easy to ramp up refinery activity across the world to compensate. Especially as Ukraine continues to damage Russian refineries as well as Russian crude production and export facilities.
Watch oil product stocks and prices as well as Brent calendar 2027. What to watch for this summer is thus oil product inventories falling and oil product premiums to crude rising. Another measure to watch is the Brent crude 2027 contract as it rises steadily day by day as the Strait of Hormuz stays closed and global oil inventories decline. The latter is close to the highest level since the start of the war and keeps rising.
The Brent M1 contract and the Brent 2027 prices and current price of jet fuel in Europe (ARA). All in USD/b

Our back of the envelope calculation of the global shortage created by the closure of the Strait of Hormuz. Note that 3.5 mb/d of discharge from SPR is also a draw. Note also that ’Forced demand loss’ of 2.5 mb/d is probably temporary and will fall back towards zero as logistics are sorted out leaving ’Price demand loss’ to do the job of balancing the market. Thus a shortfall of at least 9 mb/d created by the closure. More if SPR discharge is included and more if Forced demand loss recedes.


Brent falling like a rock with oil likely to flow from SoH until at least 3 November

Vattenfalls och Industrikrafts kärnkraftsbolag Videberg Kraft har valt Rolls-Royce SMR
Selling down on a ”deal”

Sommarväder skapar prisrally på elbörsen
Oil product price pain is set to rise as the Strait of Hormuz stays closed into summer
Sommarväder skapar prisrally på elbörsen
Vattenfalls och Industrikrafts kärnkraftsbolag Videberg Kraft har valt Rolls-Royce SMR
Selling down on a ”deal”
Brent falling like a rock with oil likely to flow from SoH until at least 3 November
-
Nyheter3 veckor sedan
Sommarväder skapar prisrally på elbörsen
-
 Nyheter1 vecka sedan
Vattenfalls och Industrikrafts kärnkraftsbolag Videberg Kraft har valt Rolls-Royce SMR
-
Analys1 vecka sedan
Selling down on a ”deal”
-
Analys6 timmar sedan
Brent falling like a rock with oil likely to flow from SoH until at least 3 November