

Analys
SIP Nordic – Råvaruguiden – februari 2013

 De flesta investerar i en enskild tillgång för att de tror på uppgång alternativt en nedgång i samma underliggande. Vad många ibland missar är att det finns goda möjligheter till avkastning om man investerar i en skillnad mellan två eller flera tillgångar. Ett sådant tillfälle finns nu i skillnaden i pris mellan guld och platina. Frågan är åt vilket håll det ska gå. Kanske dags för ett spread bet?
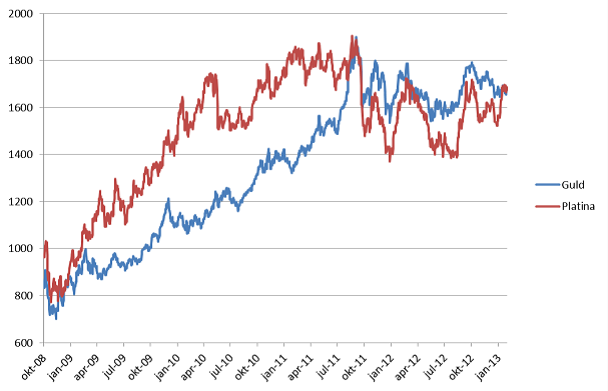
Platina och gulds utveckling sedan 2008. Guld har sedan september 2011 handlats till ett dyrare pris än platina. Något som nu kan ändras.
Historiskt har platina handlats på en högre nivå än guld men detta förändrades i september 2011. Detta till följd av att den dystra utsikten för den globala ekonomin drabbade industrimetaller, såsom platina, samtidigt som investerare sökte sig mot den säkra hamnen som guld ansågs vara. Skillnaden mellan priset var som mest drygt $200 i september 2012.
Trots att guld spås ha ännu ett år av positiv utveckling finns det mycket som talar för att platina kommer att utvecklas ännu bättre. (se text om guld och platina nedan)
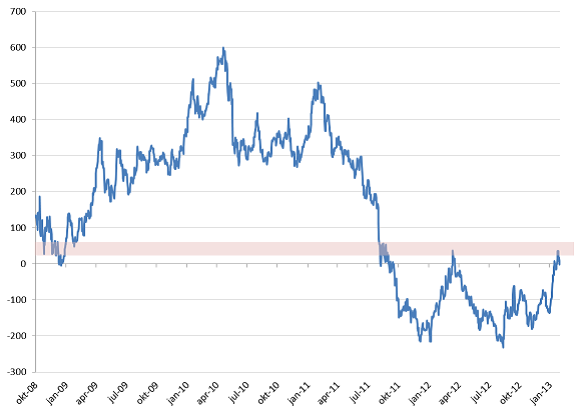
Skillnaden i pris mellan platina och guld (platina – guld) är återigen vid nollinjen. En nivå som tidigare testats.
Skillnaden i pris mellan guld och platina (spread) är nu åter vid nollinjen (se bild ovan). Om man tror att spreaden nu ska öka, till platinas fördel, kan man använda följande strategi.
Köp: MINILONG PLAT A
Köp: MINISHRT GULD P
Denna trade kan generera positiv avkastning om platinapriset ökar mer än vad guldpriset gör. Denna trade kan också vara fördelaktig även om både platina- och guldpriset tappar i värde. Så länge som guld tappar mer än platina.
Självklart fungerar det att spekulera i det motsatta. D.v.s. att skillnaden i pris mellan de två råvarorna kommer att öka till gulds fördel. Då kan man istället använda följande produkter.
Köp: MINILONG GULD G
Köp: MINISHRT PLAT B
Råvaror – Energi
Brent olja
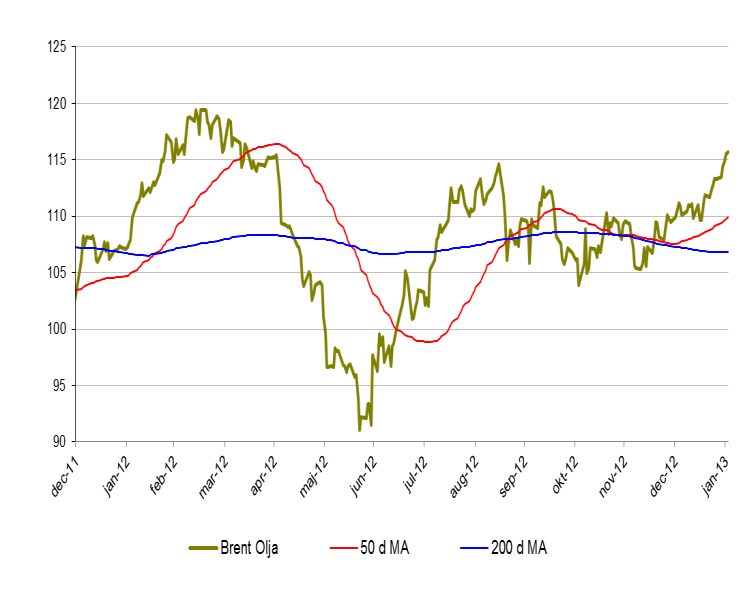
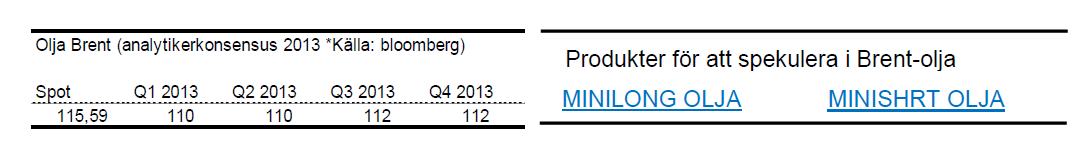
- Brentoljan har startat året mycket positivt. Upp dryga 5 % under januari månad.
- Brent närmar sig nu en viktig motståndsnivå kring $118 USD.
- Oljepriset steg under januari månad till följd av signaler på att den amerikanska ekonomin är på bättringsvägen. Något som spekulanter tror kan få fart på oljekonsumtionen igen.
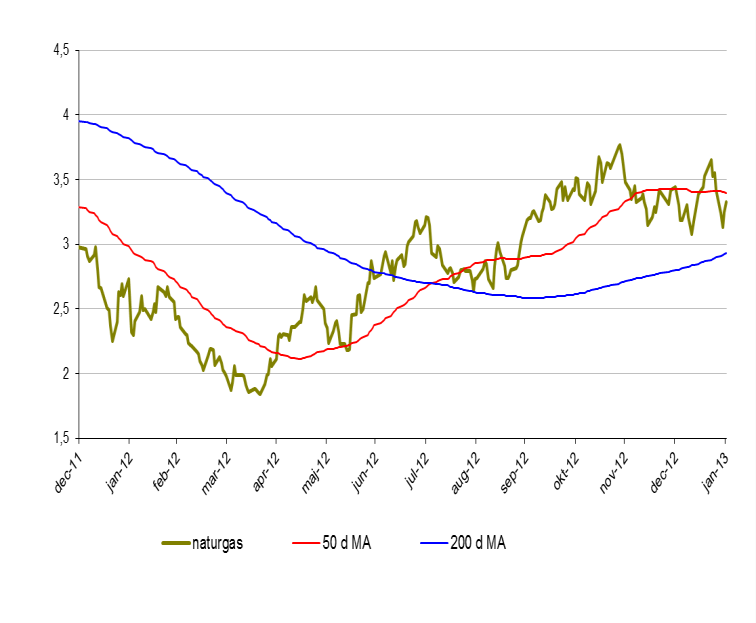
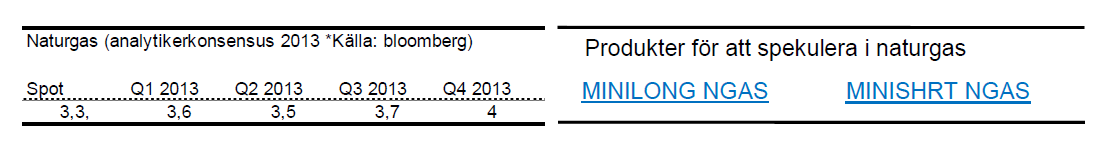
Naturgas
- Priset på naturgas föll under januari månad knappa 4 %.
- Lagren av naturgas är fortfarande höga. Ca 12 % över medelvärdet (5 år).
- Lagren är dock mindre jämfört med samma period förra året. Något som kan vända den negativa kortsiktiga trend som naturgas hade under januari.
Råvaror – Metaller
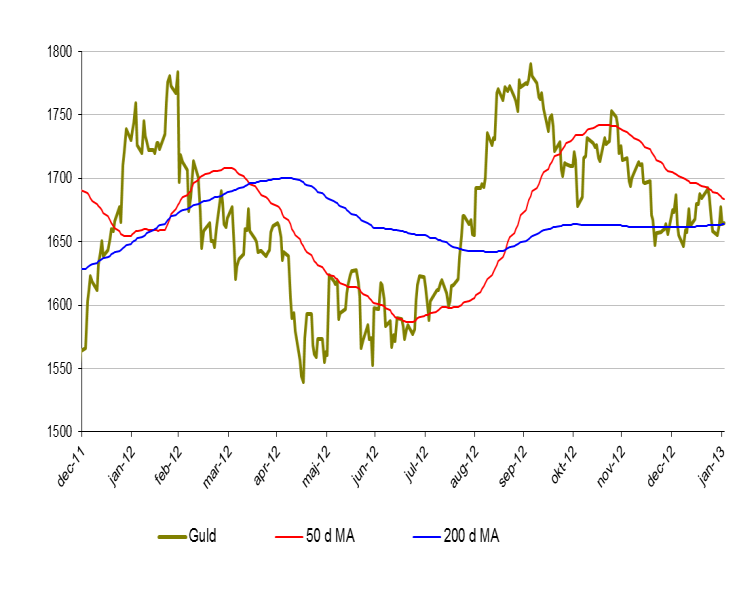
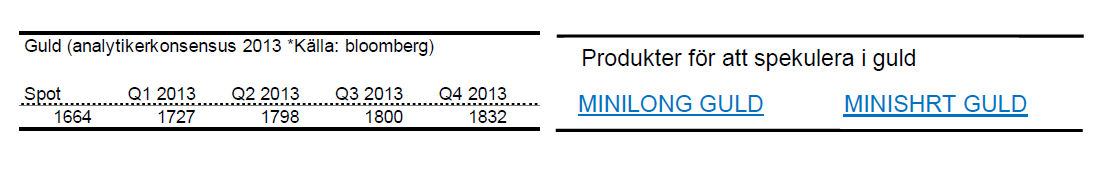
Guld
- Guldpriset ökade marginellt under januari. 0,4 % upp.
- Med signaler om en starkare global ekonomi i kombination med en större vilja att flytta pengar från ”säkra hamnar” till aktiemarknaden, kommer även en svagare guldutveckling.
- Rapporter om minskad handel av fysiskt guld i Asien jämfört med föregående år kan även påverka guldet negativt på kort sikt.
- Den amerikanska penningpolitiken kommer till stor del fortsatt styra utvecklingen av guldpriset.
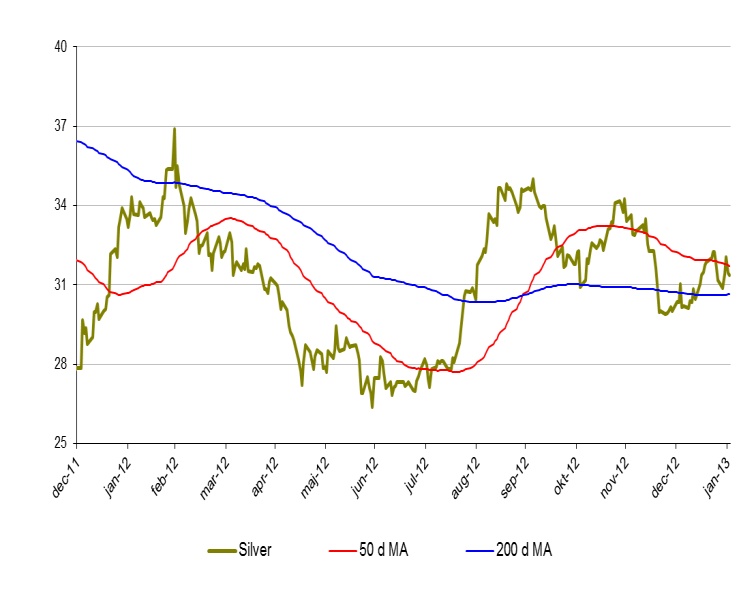
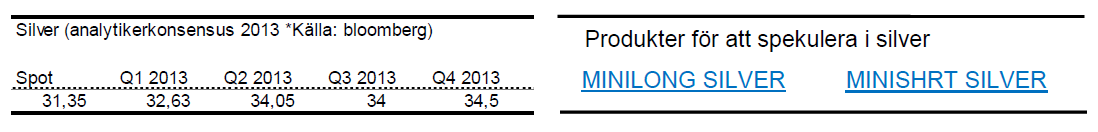
Silver
• Silver överpresterade guld under januari månad. Upp 4,7 %.
• Efterfrågan på fysiskt silver ökar.
• Indiens export av silver väntas öka med runt 30 % till följd av ökad efterfrågan.
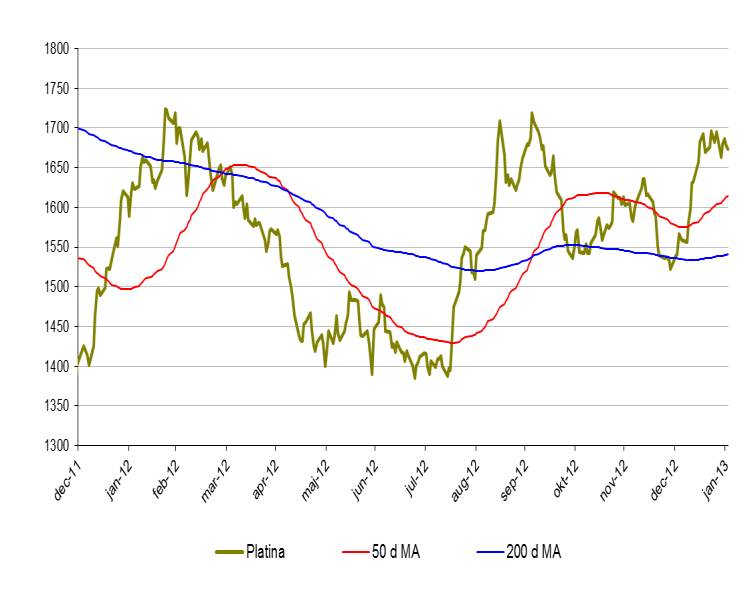
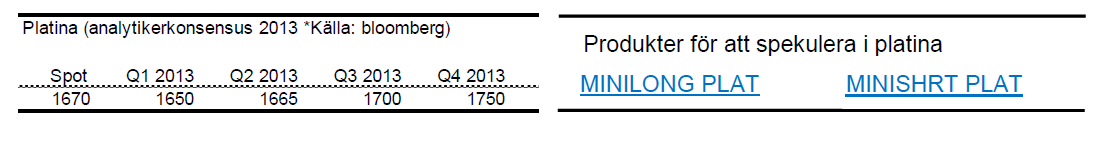
Platina
- Platinapriset steg kraftigt under januari. Upp nästan 10 % under januari månad.
- Detta gör att platina nu handlas till ett högre pris än guld. (Första gången sedan 2011)
- Nettopositionerna i platinaterminer är i stor övervikt för långa kontrakt.
- Efterfrågan på platina är hög samtidigt som produktionskostnaderna fortsatt är höga. Något som pressar priset uppåt.
- Sviterna efter de stora strejkerna i de Sydafrikanska gruvorna gör sig fortfarande påminda och gruvorna är inte än uppe i full produktionstakt.
- Sydafrika står för en mycket stor del av den globala platinaproduktionen.
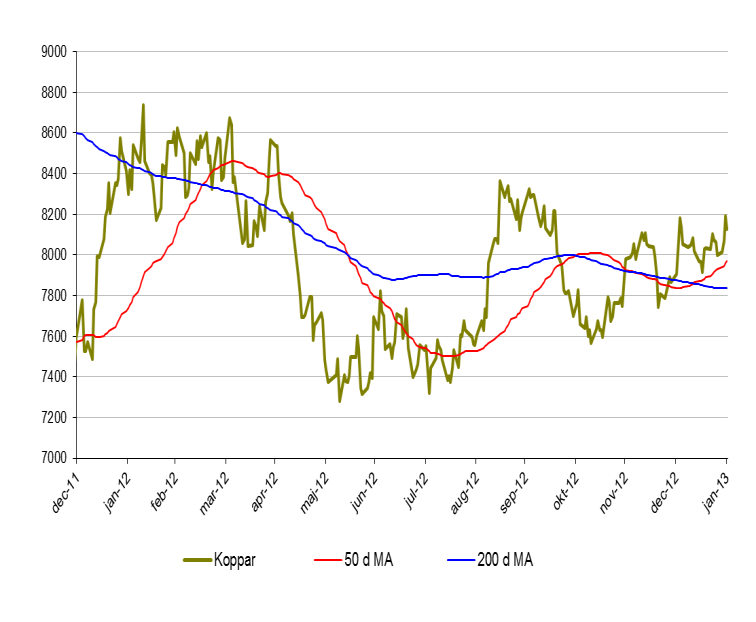
Koppar
- Priset på koppar ökade 3,2 % under januari.
- Kopparproduktionen förväntas öka med cirka 3 % under 2013 till följd av ökad efterfrågan ibland annat Kina och Indien.
- Priset på industrimetallerna hjälps till stor del av en svagare USD.
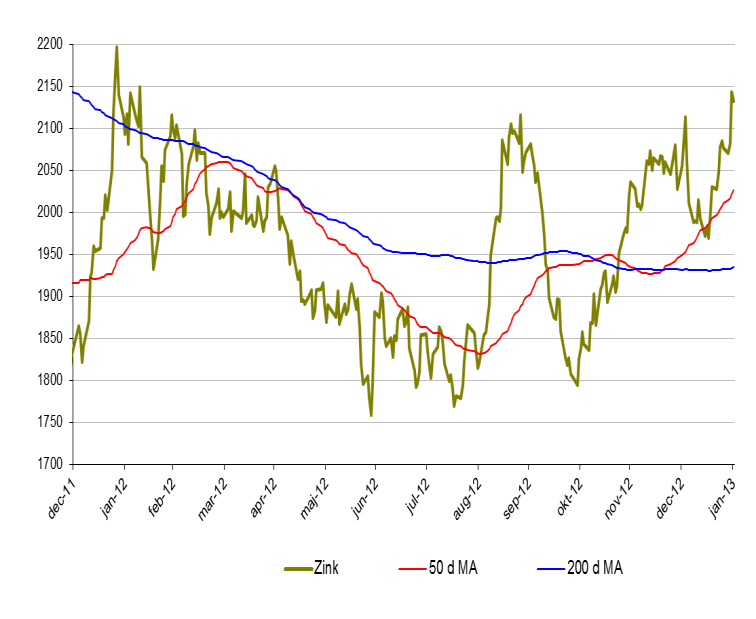
Zink
- Priset på zink åkte berg och dalbana under januari och stängde till slut 4,8 % upp.
- Likt andra basmetaller hjälper en svagare dollar kursen uppåt.
- Rapporter indikerar på en lägre produktionssiffra under 2013. Någon som kan få priset på zink att klättra ytterligare.
- Zink närmar sig nu viktiga nivåer kring 2150 där vi har en rad motståndsnivåer. Blir intressant att följa under 2013.
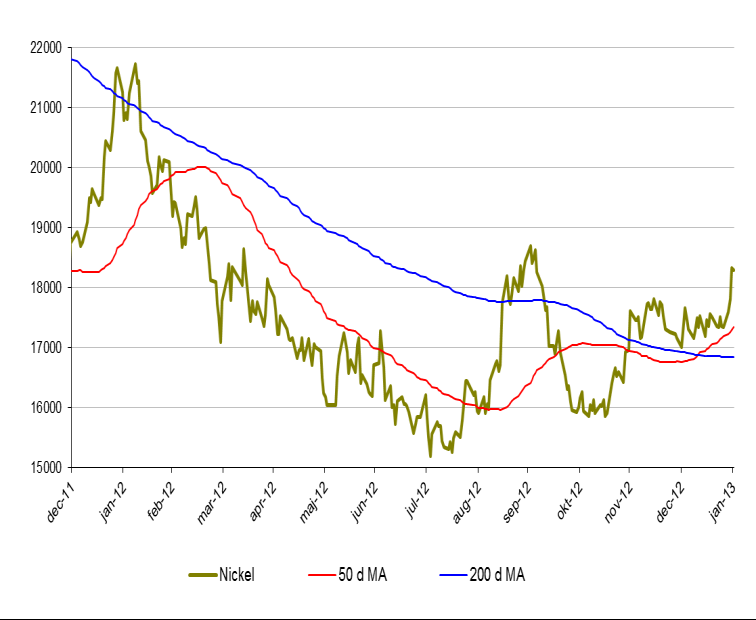
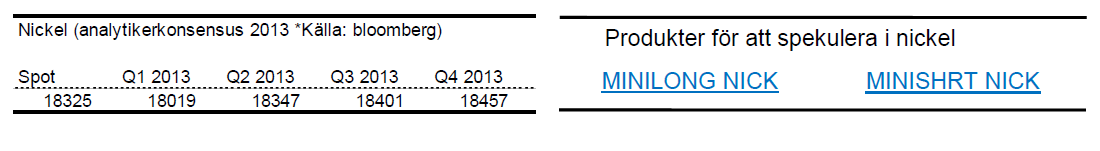
Nickel
- Nickel återhämtade nästan hela förra årets nedgång under januari. Upp 7,5 % totalt.
- Viktiga motståndsnivåer kring 18 400. Om detta område passeras är nästa nivå 22 000.
Råvaror – Jordbruk
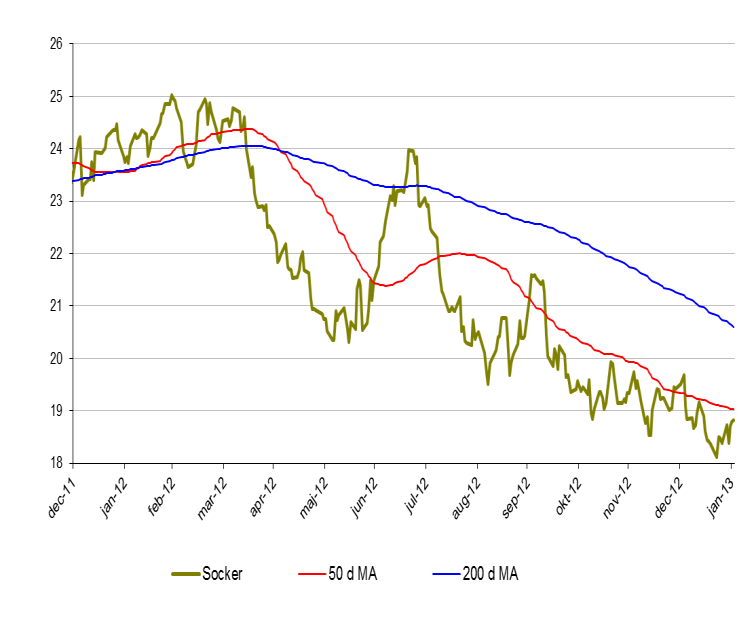
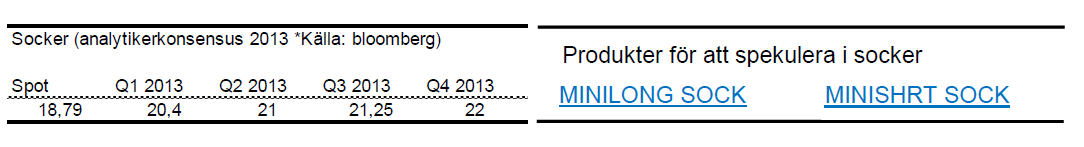
Socker
- Socker fortsätter i sin negativa trend. Ned 3 % i januari.
- Produktionen överstiger än konsumtionen kraftigt.
- Investerare ligger fortsatt i överhängande negativa positioner.
- Rapporter om att etanol ska åläggas en extra tullavgift i EU är inte positivt för socker som till viss del används för etanolproduktion.
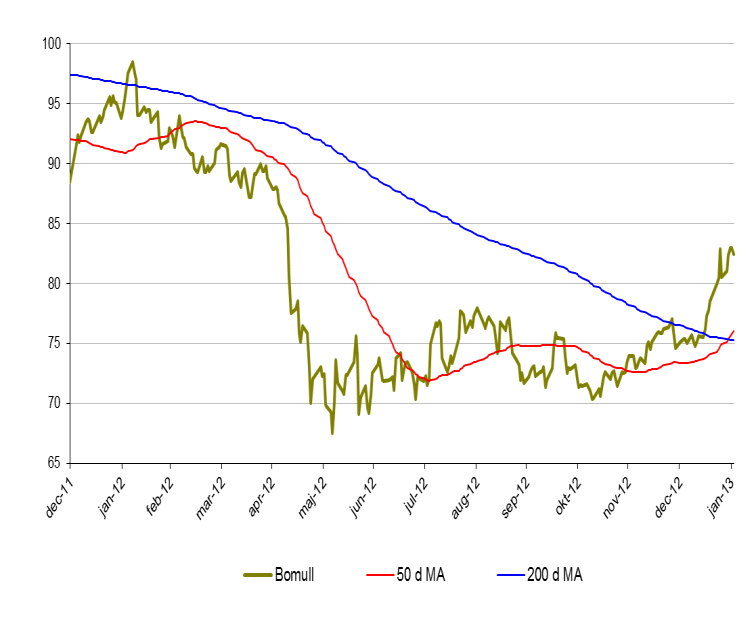
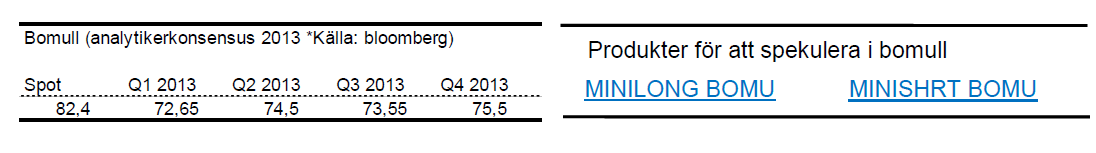
Bomull
- Bomull befinner sig i en kortsiktigt positiv trend. Sedan oktober förra året är bomull upp dryga 20 %.
- För januari är priset på bomull upp 11 %.
- Uppgången kan till stor härledas till en överaskande stark amerikansk och indisk export.
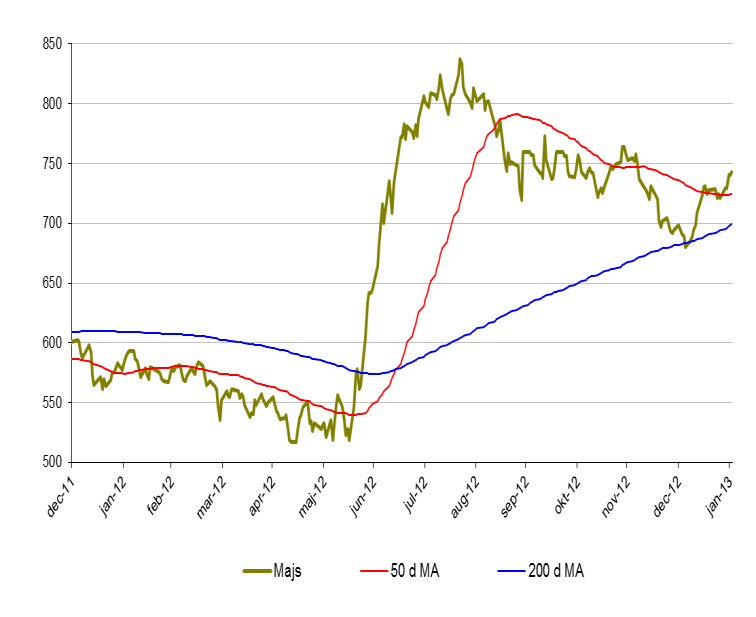
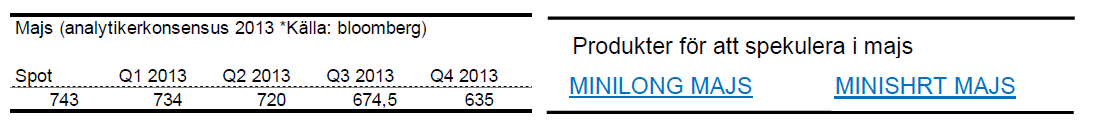
Majs
- För januari är majspriset upp 6,7 %.
- Uppgången kan dämpas då det spås att majsskörden kan bli mycket stor under sommaren 2013.
- Ytterligare faktorer som pekar på en avsvalnad kurs är lägre efterfrågan från etanol- och boskapsproducenter.
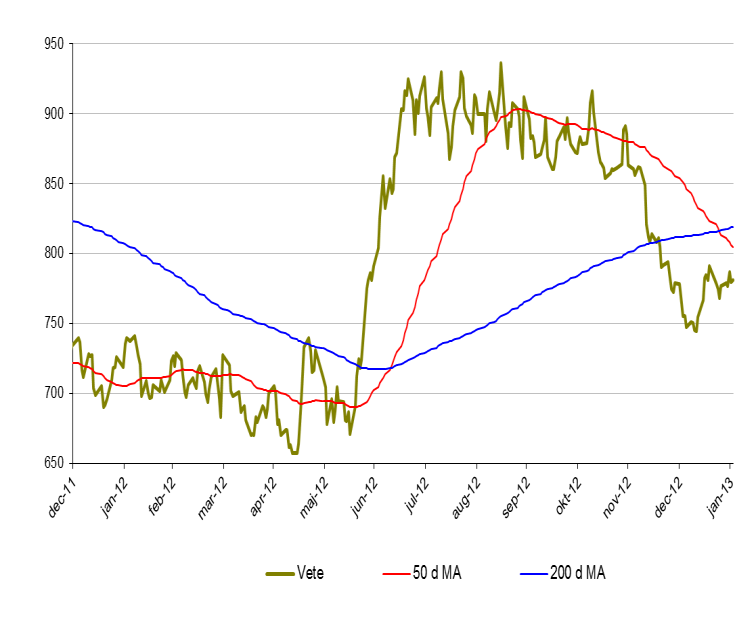
Vete
- Vete hade likt majs ett svängigt 2012.
- Under januari månad minskade priset på vete med 0,3 %.
- Den fortsatta utvecklingen för vete är osäker då det kommer tvetydiga rapporter om tillgång och efterfrågan.
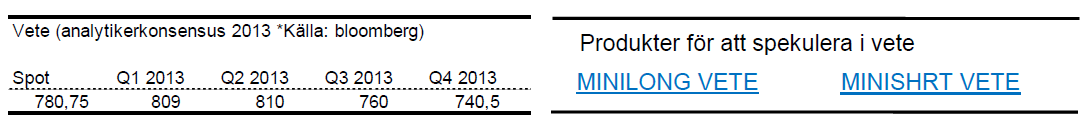
Apelsinjuice
- Apelsinjuice är i stort sett oförändrat under januari.
- Apelsinjuice befinner sig dock i ett mycket intressant läge där den negativa trenden nu verkar ha bytts mot det positiva.
- Viktiga nivåer kring 123 cents.
- Priset på apelsinjuice är fortfarande 70 % högre än botten 2009. Fallhöjden är således hög. Mycket hög.
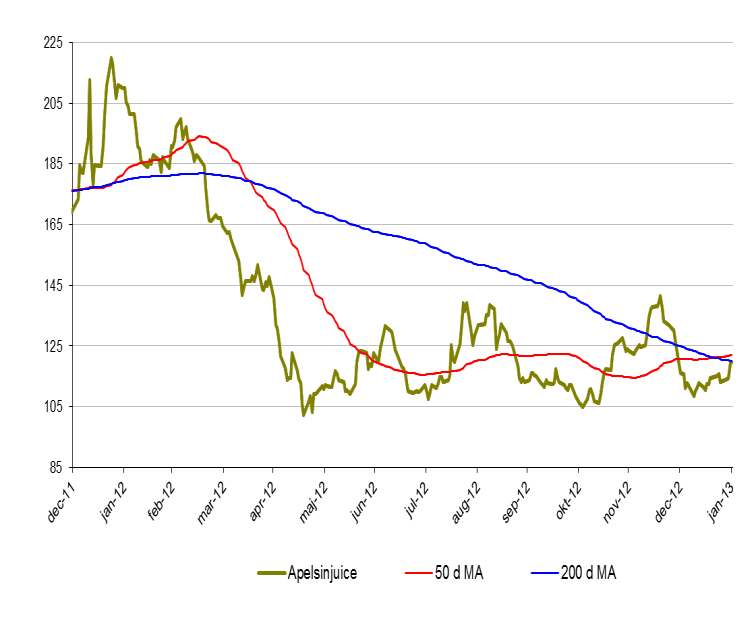
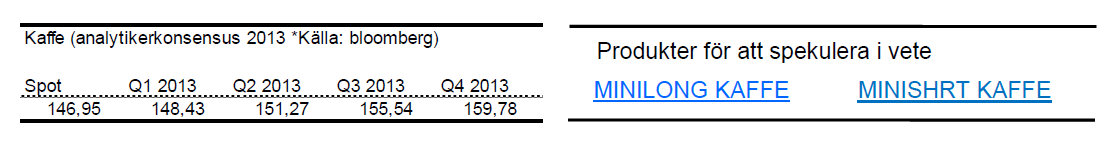
Kaffe
- Kaffe utvecklades under januari svagt uppåt. + 0,6 %.
- Kaffe kan mycket väl utvecklas positivt framöver till följd av låg produktion ibland annat Guatemala. Plantorna har i dessa regioner angripits av mögel vilket dämpar tillgången.
[box]Denna uppdatering är producerat av SIP Nordic och publiceras i samarbete och med tillstånd på Råvarumarknaden.se[/box]
Ansvarsbegränsning
Detta produktblad utgör endast marknadsföring och har sammanställts av SIP Nordic Fondkommission AB.
Innehållet ger inte fullständig information avseende det finansiella instrumentet. Investerare uppmanas att del av prospekt och slutliga villkor, vilka finns tillgängliga på: www.rbsbank.se/markets, innan ett investeringsbeslut tas.
Förekommande exempel är simulerade och baseras på SIP Nordics egna beräkningar och antaganden, en person som använder andra data eller antaganden kan nå andra resultat. Administrativa avgifter och transaktionsavgifter påverkar den faktiska avkastningen.
Analys
OPEC+ will likely unwind 500 kb/d of voluntary quotas in October. But a full unwind of 1.5 mb/d in one go could be in the cards

Down to mid-60ies as Iraq lifts production while Saudi may be tired of voluntary cut frugality. The Brent December contract dropped 1.6% yesterday to USD 66.03/b. This morning it is down another 0.3% to USD 65.8/b. The drop in the price came on the back of the combined news that Iraq has resumed 190 kb/d of production in Kurdistan with exports through Turkey while OPEC+ delegates send signals that the group will unwind the remaining 1.65 mb/d (less the 137 kb/d in October) of voluntary cuts at a pace of 500 kb/d per month pace.

Signals of accelerated unwind and Iraqi increase may be connected. Russia, Kazakhstan and Iraq were main offenders versus the voluntary quotas they had agreed to follow. Russia had a production ’debt’ (cumulative overproduction versus quota) of close to 90 mb in March this year while Kazakhstan had a ’debt’ of about 60 mb and the same for Iraq. This apparently made Saudi Arabia angry this spring. Why should Saudi Arabia hold back if the other voluntary cutters were just freeriding? Thus the sudden rapid unwinding of voluntary cuts. That is at least one angle of explanations for the accelerated unwinding.
If the offenders with production debts then refrained from lifting production as the voluntary cuts were rapidly unwinded, then they could ’pay back’ their ’debts’ as they would under-produce versus the new and steadily higher quotas.
Forget about Kazakhstan. Its production was just too far above the quotas with no hope that the country would hold back production due to cross-ownership of oil assets by international oil companies. But Russia and Iraq should be able to do it.
Iraqi cumulative overproduction versus quotas could reach 85-90 mb in October. Iraq has however steadily continued to overproduce by 3-5 mb per month. In July its new and gradually higher quota came close to equal with a cumulative overproduction of only 0.6 mb that month. In August again however its production had an overshoot of 100 kb/d or 3.1 mb for the month. Its cumulative production debt had then risen to close to 80 mb. We don’t know for September yet. But looking at October we now know that its production will likely average close to 4.5 mb/d due to the revival of 190 kb/d of production in Kurdistan. Its quota however will only be 4.24 mb/d. Its overproduction in October will thus likely be around 250 kb/d above its quota with its production debt rising another 7-8 mb to a total of close to 90 mb.
Again, why should Saudi Arabia be frugal while Iraq is freeriding. Better to get rid of the voluntary quotas as quickly as possible and then start all over with clean sheets.
Unwinding the remaining 1.513 mb/d in one go in October? If OPEC+ unwinds the remaining 1.513 mb/d of voluntary cuts in one big go in October, then Iraq’s quota will be around 4.4 mb/d for October versus its likely production of close to 4.5 mb/d for the coming month..
OPEC+ should thus unwind the remaining 1.513 mb/d (1.65 – 0.137 mb/d) in one go for October in order for the quota of Iraq to be able to keep track with Iraq’s actual production increase.
October 5 will show how it plays out. But a quota unwind of at least 500 kb/d for Oct seems likely. An overall increase of at least 500 kb/d in the voluntary quota for October looks likely. But it could be the whole 1.513 mb/d in one go. If the increase in the quota is ’only’ 500 kb/d then Iraqi cumulative production will still rise by 5.7 mb to a total of 85 mb in October.
Iraqi production debt versus quotas will likely rise by 5.7 mb in October if OPEC+ only lifts the overall quota by 500 kb/d in October. Here assuming historical production debt did not rise in September. That Iraq lifts its production by 190 kb/d in October to 4.47 mb/d (August level + 190 kb/d) and that OPEC+ unwinds 500 kb/d of the remining quotas in October when they decide on this on 5 October.

U.S. commercial crude inventories posted a marginal draw last week, falling by 0.6 million barrels to 414.8 million barrels. Inventories remain 4% below the five-year seasonal average, but the draw is far smaller than last week’s massive 9.3-million-barrel decline. Higher crude imports (+803,000 bl d WoW) and steady refinery runs (93% utilization) helped keep the crude balance relatively neutral.

Yet another drawdown indicates commercial crude inventories continue to trend below the 2015–2022 seasonal norm (~440 million barrels), though at 414.8 million barrels, levels are now almost exactly in line with both the 2023 and 2024 trajectory, suggesting stable YoY conditions (see page 3 attached).
Gasoline inventories dropped by 1.1 million barrels and are now 2% below the five-year average. The decline was broad-based, with both finished gasoline and blending components falling, indicating lower output and resilient end-user demand as we enter the shoulder season post-summer (see page 6 attached).
On the diesel side, distillate inventories declined by 1.7 million barrels, snapping a two-week streak of strong builds. At 125 million barrels, diesel inventories are once again 8% below the five-year average and trending near the low end of the historical range.
In total, commercial petroleum inventories (excl. SPR) slipped by 0.5 million barrels on the week to ish 1,281.5 million barrels. While essentially flat, this ends a two-week streak of meaningful builds, reflecting a return to a slightly tighter situation.
On the demand side, the DOE’s ‘products supplied’ metric (see page 6 attached), a proxy for implied consumption, softened slightly. Total demand for crude oil over the past four weeks averaged 20.5 million barrels per day, up just 0.9% YoY.
Summing up: This week’s report shows a re-tightening in diesel supply and modest draws across the board, while demand growth is beginning to flatten. Inventories remain structurally low, but the tone is less bullish than in recent weeks.


Brent crude rose 1.6% yesterday. After trading in a range of USD 66.1 – 68.09/b it settled at USD 67.63/b. A level which we are well accustomed to see Brent crude flipping around since late August. This morning it is trading 0.5% higher at USD 68/b. The market was expecting an increase of 230 kb/d in Iraqi crude exports from Kurdistan through Turkey to the Cheyhan port but that has so far failed to materialize. This probably helped to drive Brent crude higher yesterday. Indications last evening that US crude oil inventories likely fell 3.8 mb last week (indicative numbers by API) probably also added some strength to Brent crude late in the session. The market continues to await the much heralded global surplus materializing as rising crude and product inventories in OECD countries in general and the US specifically.
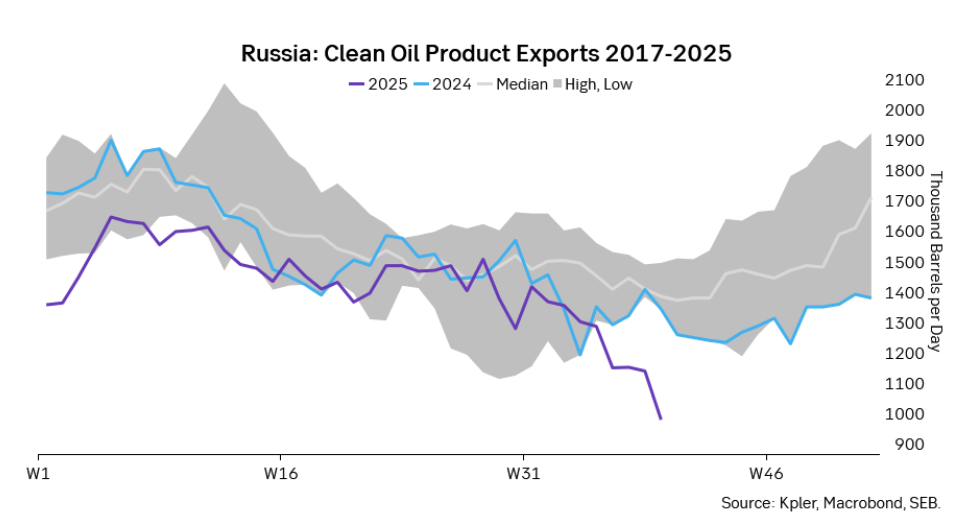
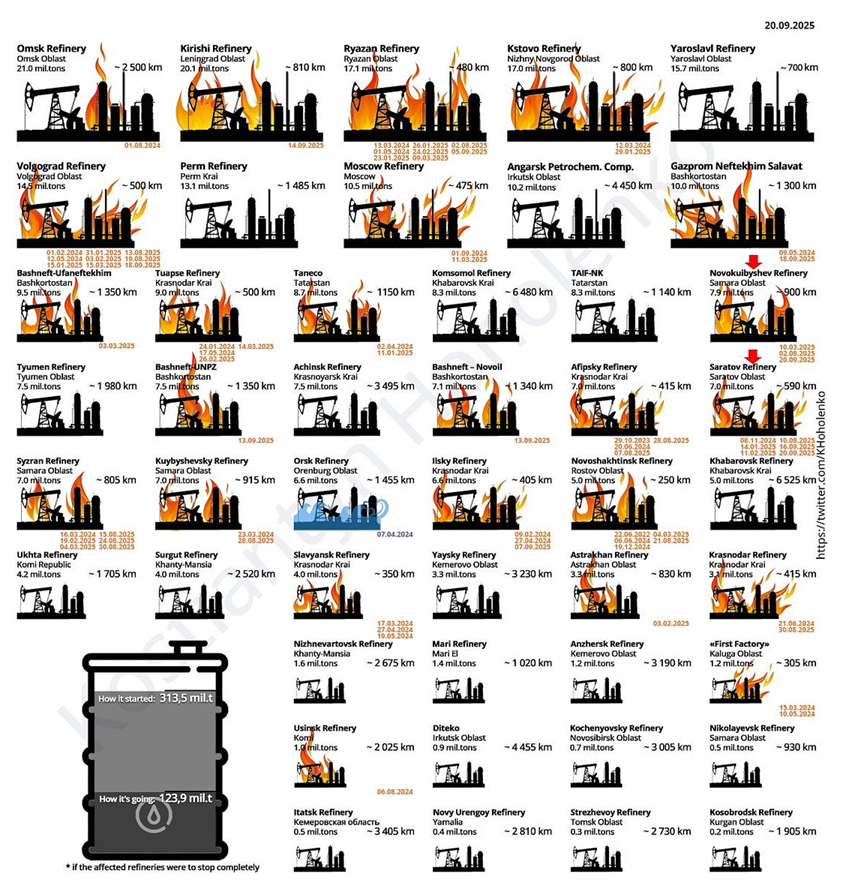
The oil market is starting to focus increasingly on the successful Ukrainian attacks on Russian oil infrastructure. Especially the attacks on Russian refineries. Refineries are highly complex and much harder to repair than simple crude oil facilities like export pipelines, ports and hubs. It can take months and months to repair complex refineries. It is thus mainly Russian oil products which will be hurt by this. First oil product exports will go down, thereafter Russia will have to ration oil product consumption domestically. Russian crude exports may not be hurt as much. Its crude exports could actually go up as its capacity to process crude goes down. SEB’s Emerging Market strategist Erik Meyersson wrote about the Ukrainian campaign this morning: ”Are Ukraine’s attacks on Russian energy infrastructure working?”. Phillips P O’Brian published an interesting not on this as well yesterday: ”An Update On The Ukrainian Campaign Against Russian Refineries”. It is a pay-for article, but it is well worth reading. Amongst other things it highlights the strategic focus of Ukraine towards Russia’s energy infrastructure. A Ukrainian on the matter also put out a visual representation of the attacks on twitter. We have not verified the data representation. It needs to be interpreted with caution in terms of magnitude of impact and current outage.
Complex Russian oil refineries are sitting ducks in the new, modern long-range drone war. Ukraine is building a range of new weapons as well according to O’Brian. The problem with attacks on Russian refineries is thus on the rise. This will likely be an escalating problem for Russia. And oil products around the world may rise versus the crude oil price while the crude oil price itself may not rise all that much due to this.
Russian clean oil product exports as presented by SEB’s Erik Meyersson in his note this morning.
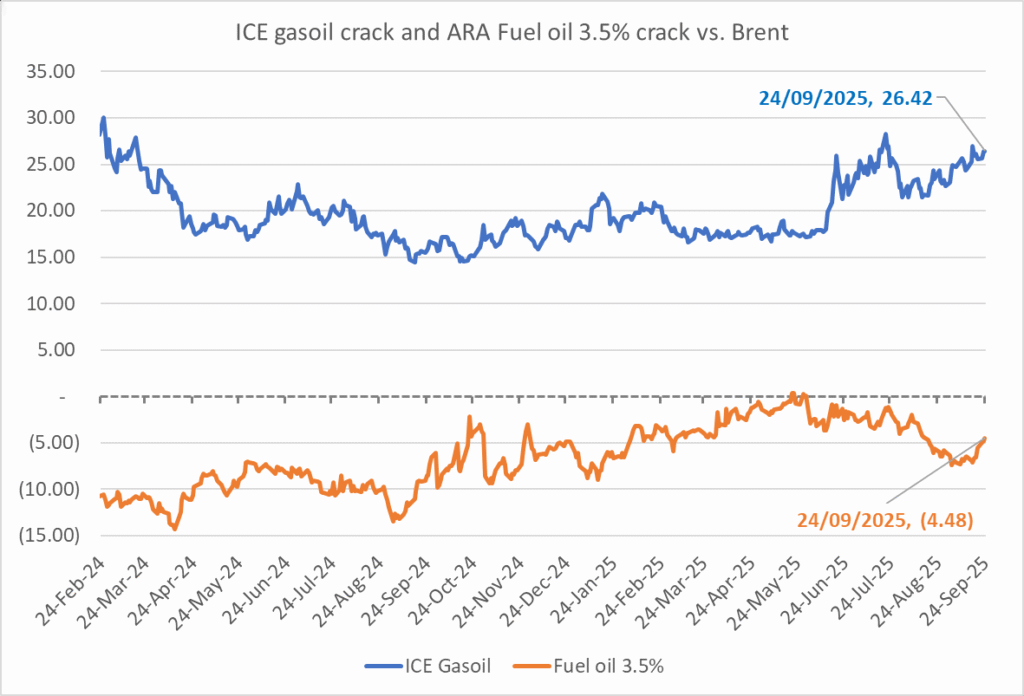
The ICE Gasoil crack and the 3.5% fuel oil crack has been strengthening. The 3.5% crack should have weakened along with rising exports of sour crude from OPEC+, but it hasn’t. Rather it has moved higher instead. The higher cracks could in part be due to the Ukrainian attacks on Russian oil refineries.
Ukrainian inhabitants graphical representation of Ukrainian attacks on Russian oil refineries on Twitter. Highlighting date of attacks, size of refineries and distance from Ukraine. We have not verified the detailed information. And you cannot derive the amount of outage as a consequence of this.

OPEC+ will likely unwind 500 kb/d of voluntary quotas in October. But a full unwind of 1.5 mb/d in one go could be in the cards

Blykalla och amerikanska Oklo inleder ett samarbete

Fortsatt stabilt elpris – men dubbelt så dyrt som i fjol

Ett samtal om guld, olja, koppar och stål

Mixat oktoberväder påverkar elpriset

Eurobattery Minerals satsar på kritiska metaller för Europas självförsörjning

Mahvie Minerals i en guldtrend

Guldpriset kan närma sig 5000 USD om centralbankens oberoende skadas

OPEC signalerar att de inte bryr sig om oljepriset faller kommande månader

Aktier i guldbolag laggar priset på guld
-
 Nyheter4 veckor sedan
Eurobattery Minerals satsar på kritiska metaller för Europas självförsörjning
-
 Nyheter3 veckor sedan
Mahvie Minerals i en guldtrend
-
 Nyheter4 veckor sedan
Guldpriset kan närma sig 5000 USD om centralbankens oberoende skadas
-
 Nyheter4 veckor sedan
OPEC signalerar att de inte bryr sig om oljepriset faller kommande månader
-
 Nyheter3 veckor sedan
Aktier i guldbolag laggar priset på guld
-
Analys3 veckor sedan
Volatile but going nowhere. Brent crude circles USD 66 as market weighs surplus vs risk
-

 Nyheter3 veckor sedan
Kinas elproduktion slog nytt rekord i augusti, vilket även kolkraft gjorde
-
 Nyheter2 veckor sedan
Tyskland har så höga elpriser att företag inte har råd att använda elektricitet