

Analys
SIP Nordic – Råvaruguiden – april 2013

 Kopparstyrd tågtidtabell
Jag tillhör skaran av de hundratusentals människor som varje dag sätter sig på ett tåg för att ta mig in till jobbet. Den senaste tiden har dessa irriterande tågförseningarna blivit fler och fler. Det är dock inte ”oväntat” snöoväder som varit orsaken de flesta gångerna utan kopparstölder.
Koppar är en mycket använd industrimetall som används lite varstans i vårt samhälle, däribland ledningar som används i tågtrafiken. Om en kopparledning rivs av kan det leda till timslånga förseningar och i många fall inställda tåg.
Högre kopparpris tenderar att attrahera personer vars respekt för lag och ordning inte är jättehögt. Med ett högre kopparpris kommer ökade stölder och fler tågförseningar.
Studier visar att det faktiskt finns ett samband mellan världspriset på koppar och kopparstölder. Under sensommaren 2011 då kopparpriset föll nästan 20 % minskade även antal kopparstölder dramatiskt, med upp till 40 % färre stölder under denna period. Sedan dess står kopparpriset högre och jag står allt oftare på perrongen och lyssnar på meddelanden om inställda tåg. Ett ytterst irriterande samband.
Jag ser dock lite ljusare på min framtida pendlartid. Lagren av koppar är de största på nästan tio år och spekulanter radar nu upp sig för att köpa kontrakt för nedgång. Någon som kan tala för en nedgång i kopparpriset.
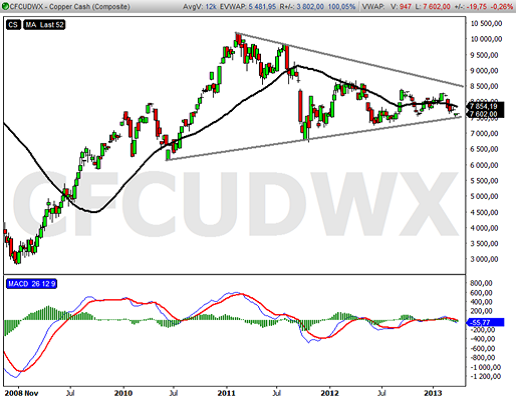
Jag frågade Tobbe Rosén om hans tekniska syn på koppar och han skrev
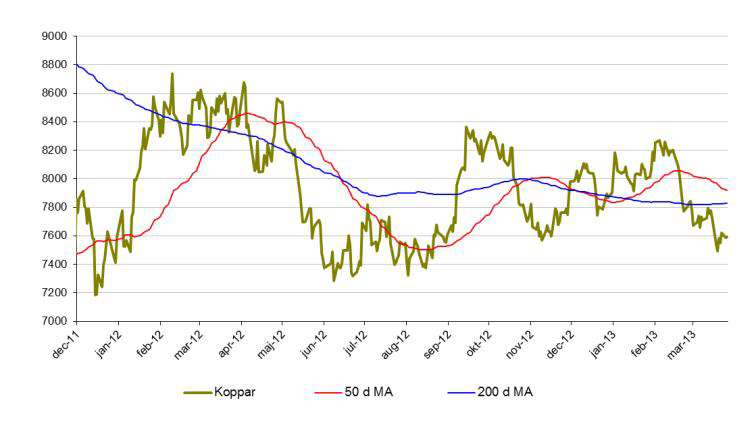
”Priset på koppar har fallit sedan toppen i början av 2011 och befinner sig i ett lågvollaläge som går mot sitt slut. Det mest troliga är att utbrottet sker på ovansidan men det avtagande momentumet indikerar en viss svaghet. Oavsett om utbrottet sker uppåt eller nedåt är det väl värt att följa.”
Fundamental analys talar alltså för att kopparpriset ska ned. Den tekniska analysen visar också på en viss svaghet.
För att jag ska slippa att bli stående på perrongen i framtiden så hoppas jag verkligen att analysen är rätt.
Alexander Frick
Råvaror – Energi
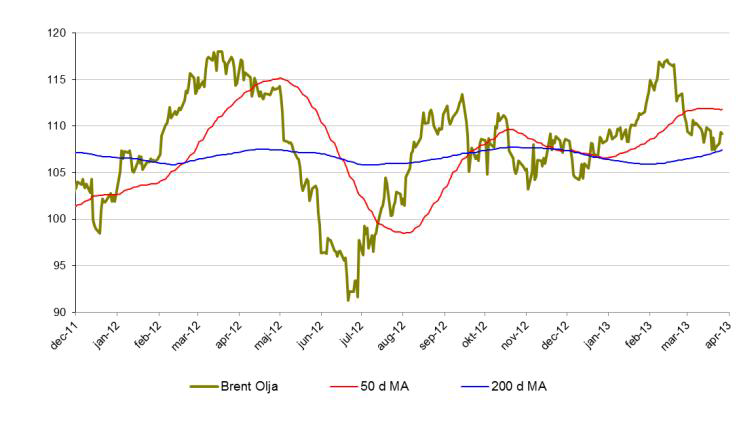
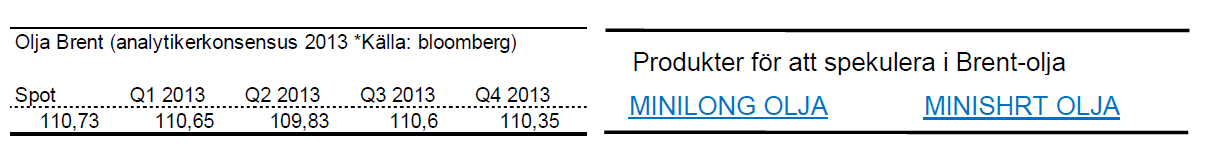
Brent olja
- Det har blivit dags att summera det första kvartalet för råvarorna och brent har åkt berg och dalbana.
- För året är brentoljan ned drygt 1 %.
- Sedan toppen i början av februari har brent tappat 8 %.
- Minskad import från USA samt ökade lager bidrar till brentoljans nedgång.
- Uttalande från Ben Bernanke (FED) om en paus i stimulanspaket påverkar även priset på olja negativt.
- Bland spekulanter (bland annat fonder) ökas de långa positionerna vilket kan indikera att en vändning uppåt är på väg.
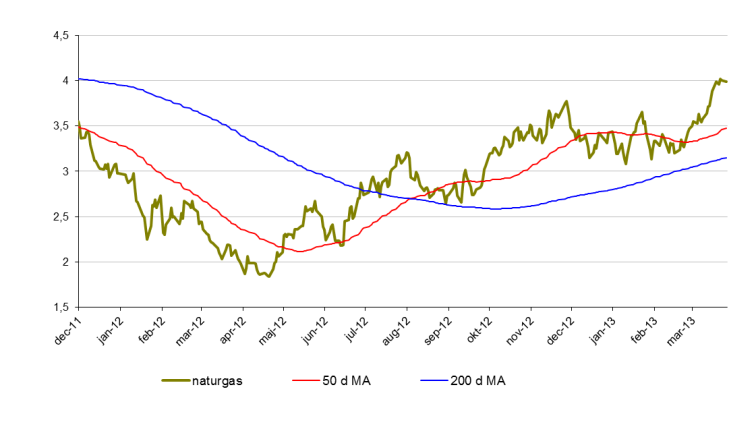
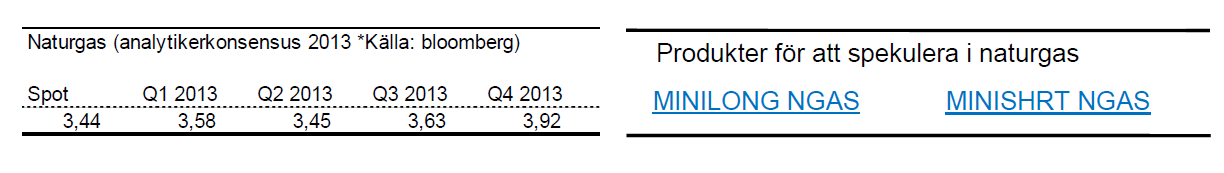
Naturgas
- Naturgas har startat året starkt. Upp nästan 17 % för året.
- I princip hela uppgången har skett under mars månad.
- Kallt väder i USA bidrar uppgången.
- Naturgas testar nu en viktig nivå kring 4$. Om Kursen etablerar sig över denna nivå kan vi mycket väl se högre kurser framöver.
Råvaror – Metaller
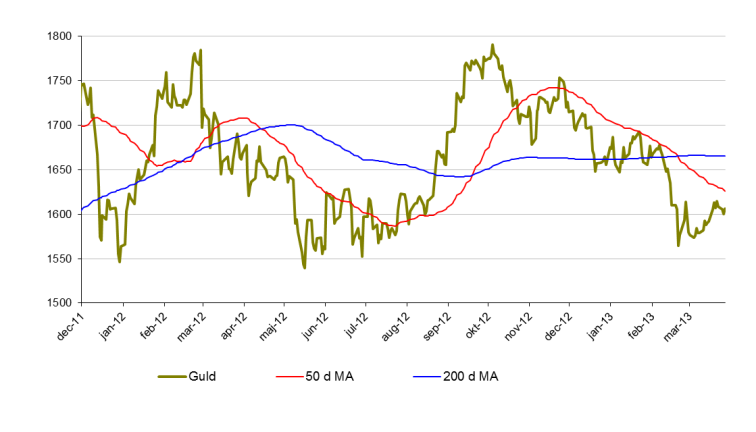
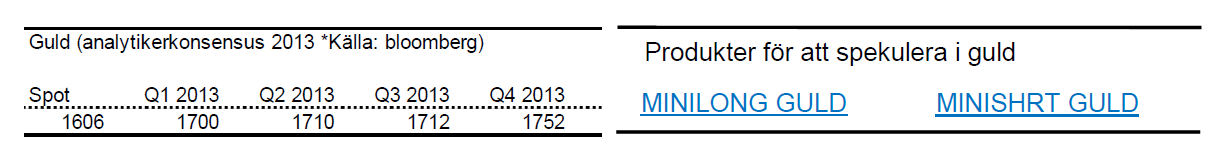
Guld
- Guld befinner sig i ett otroligt spännande läge. Sedan årets början är guld ned nära 3 %.
- Många väntade sig en större reaktion på krisen i Cypern.
- Under mars månad är guld dock endast upp 1,5 %.
- Riskaptiten är fortsatt hög varför guldet mycket väl kan fortsätta att falla.
- Vi såg även sett s.k. dödskors i guld i februari vilket betyder att 50 dagars medelvärde skär 200 dagars uppifrån. Detta brukar kunna tolkas som en signal om nedgång.
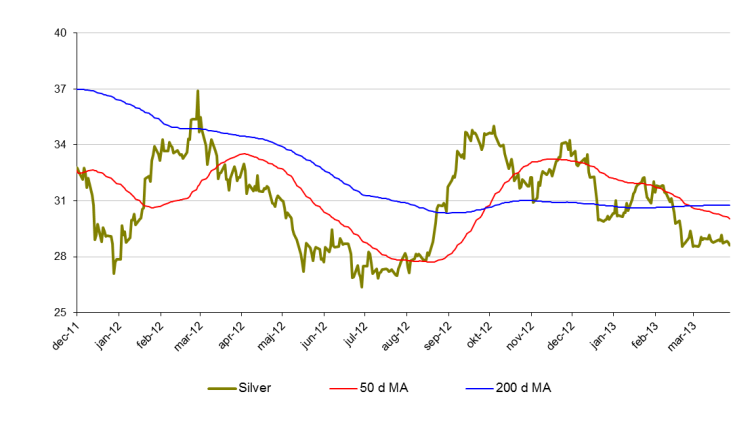
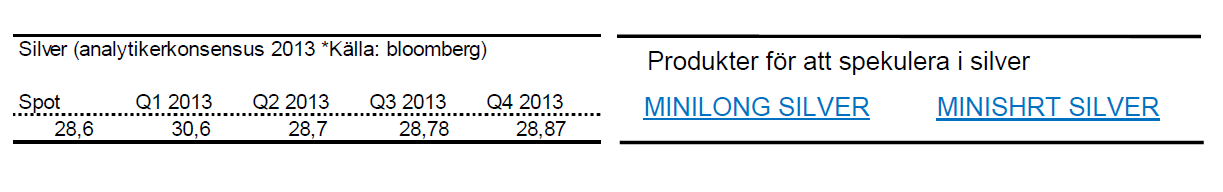
Silver
- Silver har den senaste månaden stabiliserats kring 28,5$ med mycket små rörelser.
- För året är silver ned 6,5 %.
- Likt guld tar silver stryk av att riskaptiten ökat och behovet av en ”säker hamn” är svalt.
- Tecken på framförallt en starkare amerikansk ekonomi driver priset på silver nedåt.
- Motståndsområde kring 29,5$ måste tas ut för att silver ska bli intressant för uppgång.
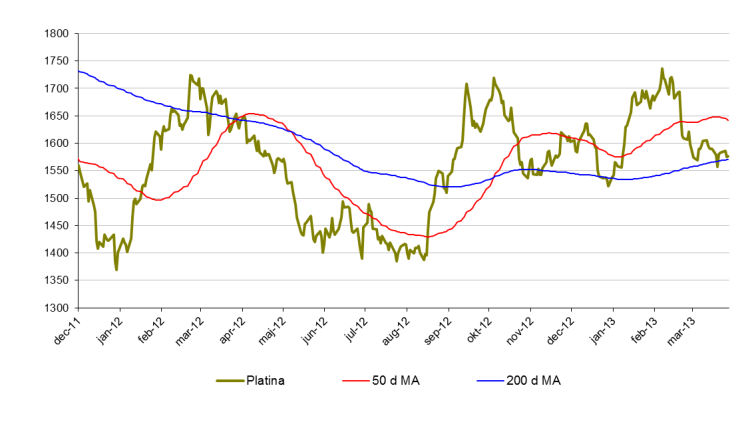
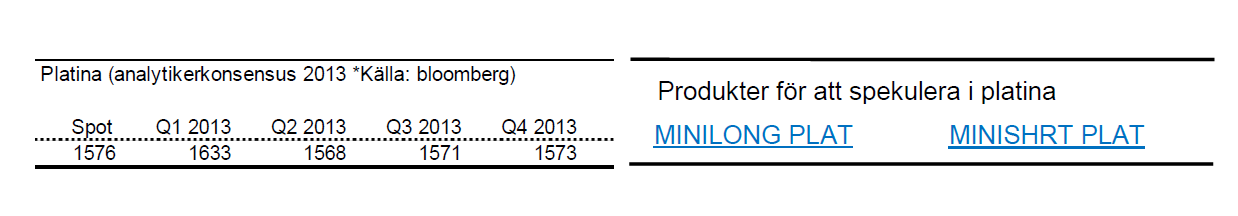
Platina
- Platina är fortsatt på plus för året. 3,5 % sedan sista december.
- Man bör dock komma ihåg att platina tappat nästan 10 % sedan i början av februari.
- Platina handlas återigen under guldet och en pairtrade likt den jag beskrev i februari kan åter vara intressant.
- Stödzon runt 1550$ är intressant att bevaka.
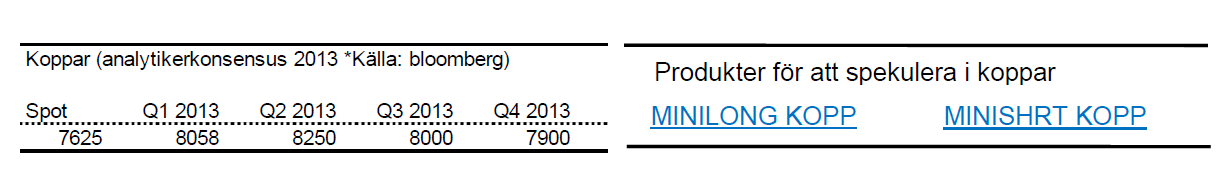
Koppar
- För året är koppar ned 4 % och det finns mycket som talar för att tappet ska fortsätta.
- Lagren av koppar är det största på nästan 10 år samtidigt som fler och fler spekulanter köper korta positioner.
- Debaclet i Cypern sätter även sina spår i kopparpriset.
- Positiv konsumtionsstatistik från Kina hjälper även föga eftersom lagren är så höga.
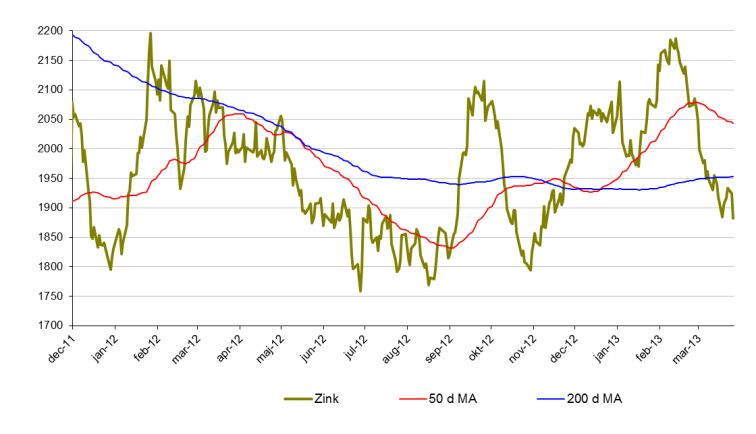
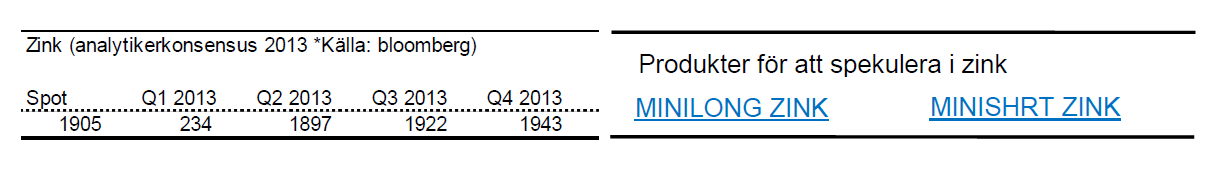
Zink
- Priset på zink dyker. För året är zinkpriset ned knappa 10 %.
- Likt koppar har Cypernkrisen satt sina spår.
- Zink handlas snart i regionen kring en rad stöd (1800$). Rekyler där kan vara intressanta att bevaka.
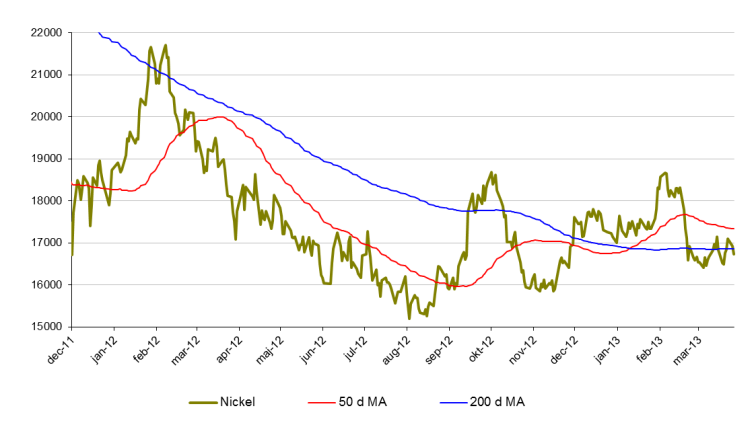
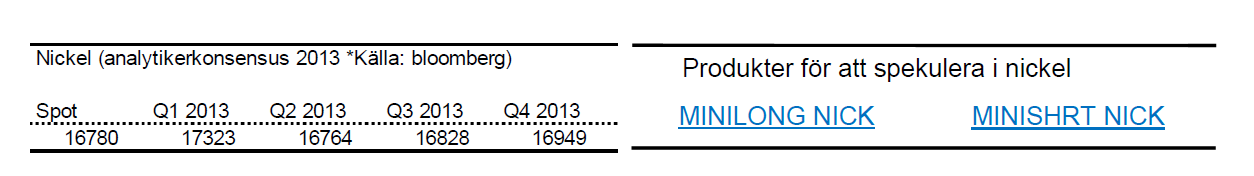
Nickel
- Nickel är för året ned drygt 2,5 %.
- Under februari tappade nickel nästan 11 %.
- Nickel presterade sämst av alla basmetaller under 2012. Slutsiffran blev -8 % för 2012.
- Nickelmarknaden är fortsatt mättad med ökande lager.
- Många stora projekt inom nickelproduktion är redan finansierade och irreversibla vilket kommer att öka tillgången av nickel ytterligare.
Råvaror – Jordbruk
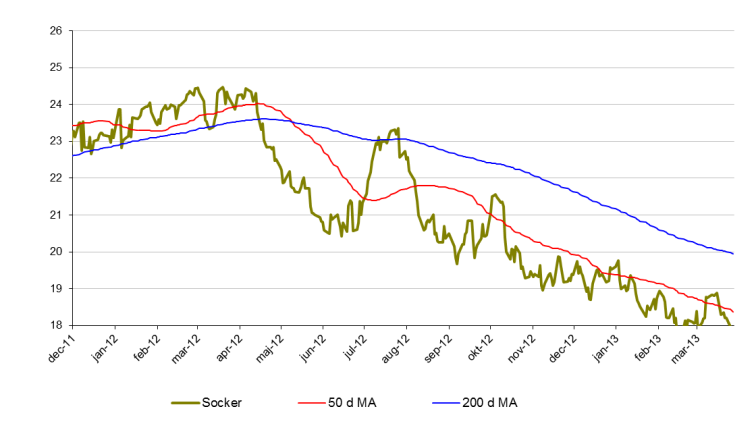
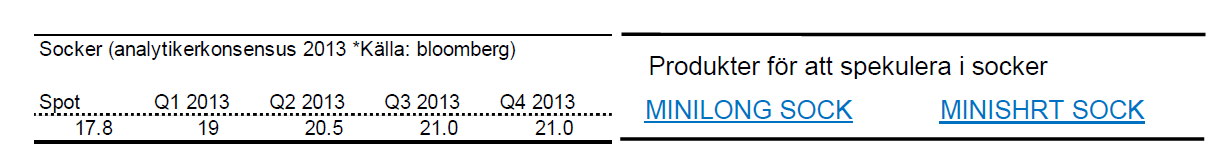
Socker
- Sockers kräftgång fortsätter. Sedan oktober förra året är sockerpriset ned 18 %.
- För året är sockerpriset ned drygt 8 %.
- En anledning till det fortsatta prisfallet är att nuvarande nivåer inte motiverar sockerproduktion. Andra grödor eller etanol ses som mer attraktiva.
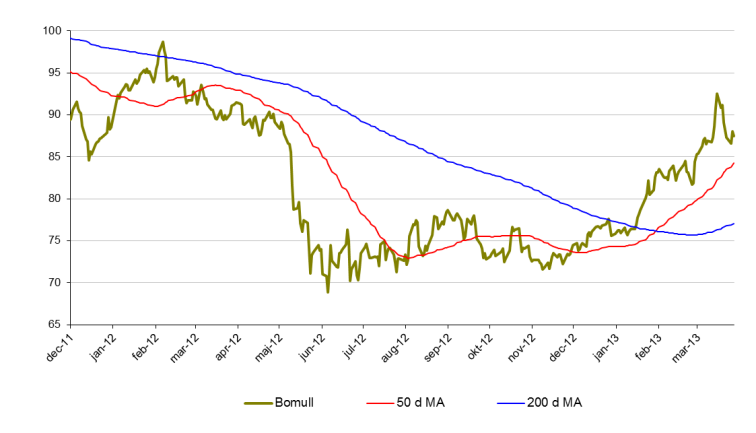
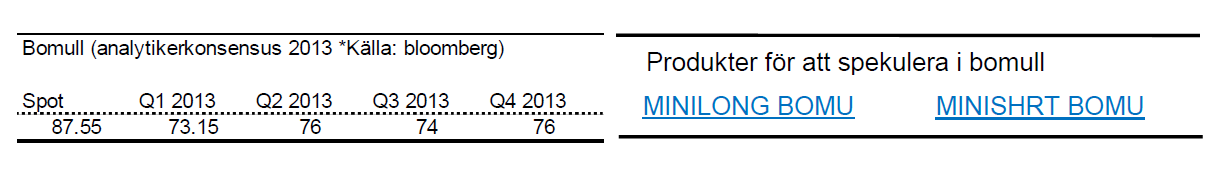
Bomull
- Bomullspriset utvecklas starkt under början av 2013.
- För året är priset på bomull upp 17,3 %.
- Under mars månad är bomull upp 5,2 %.
- Sedan november 2012 är priset på bomull upp 26 %.
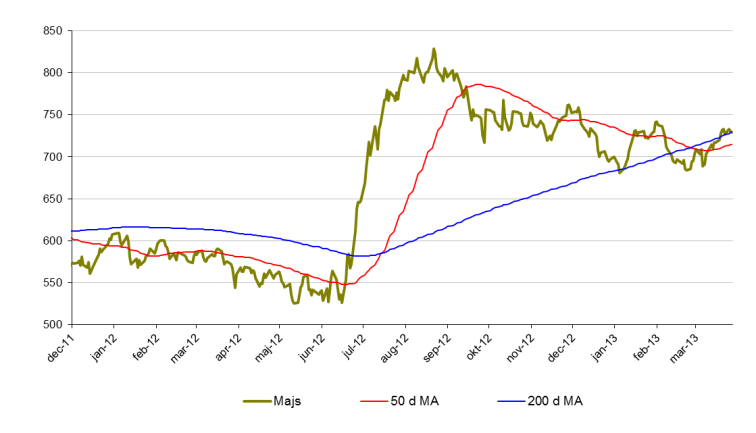
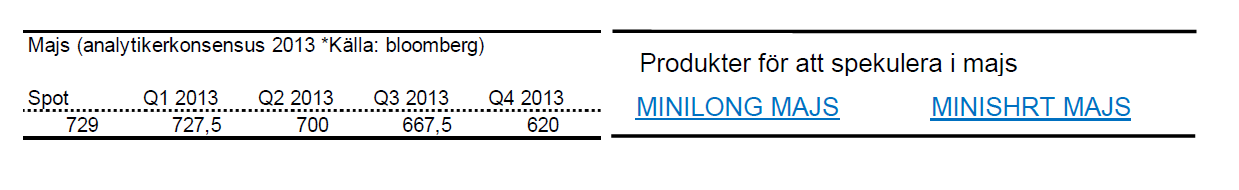
Majs
- Priset på majs har återigen vänt uppåt.
- För året är priset på majs upp nästan 6 %.
- Sedan förra årets extremtorka har majs legat i en negativ trend. Denna trend är nu bruten till följd av en period av torrare väder.
- Stora skördar väntas dock och vädret ser ut att bli bättre.
- Följ således majs med försiktighet.
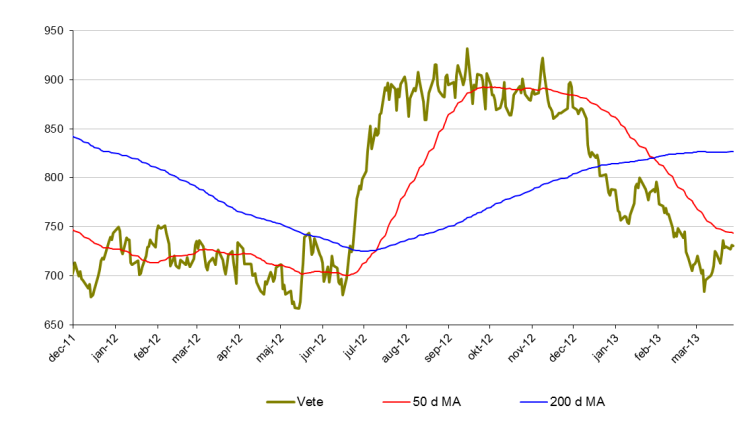
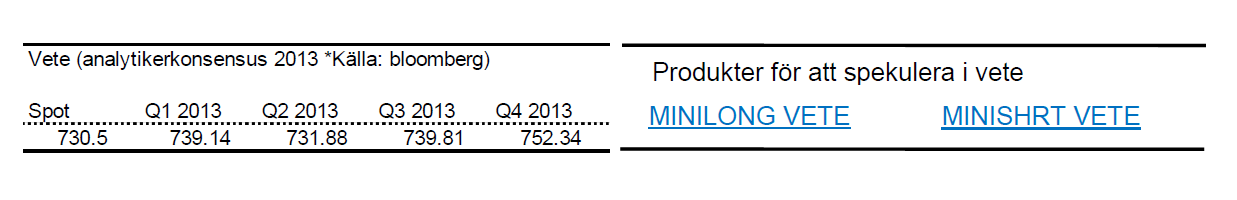
Vete
- Likt majs rekylerade vete upp över den negative trendlinje som funnits sedan förra sommaren.
- Försiktighet gäller även här.
- För året är vete ned 5 %.
- Under mars månad steg priset på vete med 3,5 %.
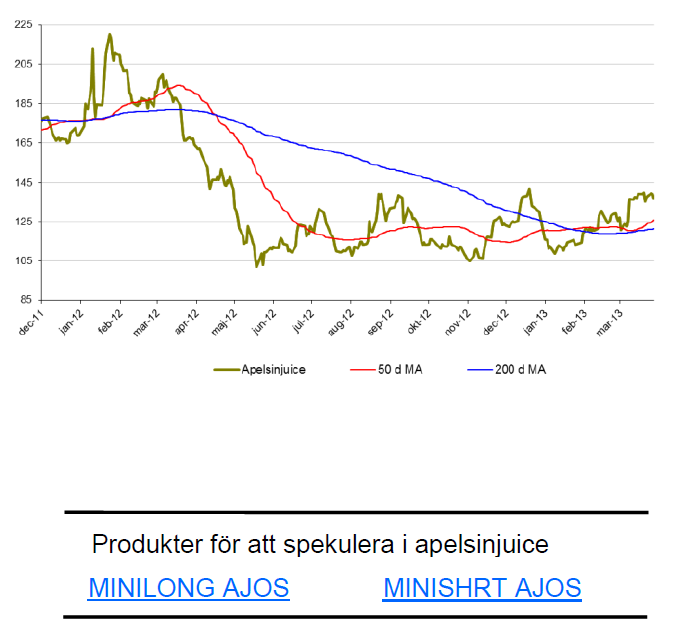
Apelsinjuice
- Vi har länge bevakat apelsinjuice i Tradingklubben.
- Apelsinjuice känns svårtippad och 143-nivån bör brytas innan vi intresserar oss för uppgång.
- För året är apelsinjuice upp 7 %.
- Priset på apelsinjuice är fortfarande 70-80 % högre än botten 2009. Fallhöjden är således hög. Mycket hög.
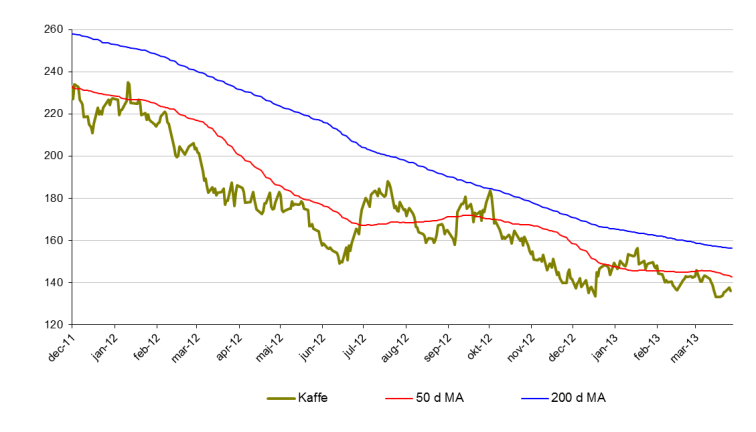
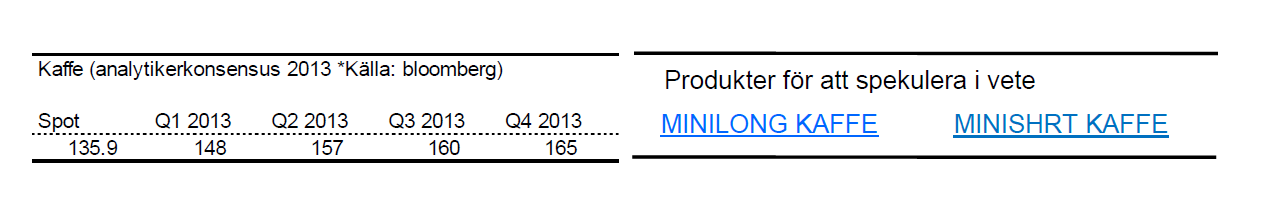
Kaffe
- Kaffe ligger fortfarande i en långsiktigt nedåtgående trend.
- För året är kaffe ned 7 %.
- Det är ökade lager som driver priset nedåt.
- Viktigt stödområde kring 135$.
[box]Denna uppdatering är producerat av SIP Nordic och publiceras i samarbete och med tillstånd på Råvarumarknaden.se[/box]
Ansvarsbegränsning
Detta produktblad utgör endast marknadsföring och har sammanställts av SIP Nordic Fondkommission AB.
Innehållet ger inte fullständig information avseende det finansiella instrumentet. Investerare uppmanas att del av prospekt och slutliga villkor, vilka finns tillgängliga på: www.rbsbank.se/markets, innan ett investeringsbeslut tas.
Förekommande exempel är simulerade och baseras på SIP Nordics egna beräkningar och antaganden, en person som använder andra data eller antaganden kan nå andra resultat. Administrativa avgifter och transaktionsavgifter påverkar den faktiska avkastningen.

Rebounding along with most markets. But concerns over solidity of Gaza peace may also contribute. Brent crude fell 0.8% yesterday to $61.91/b and its lowest close since May this year. This morning it is bouncing up 0.9% to $62.5/b along with a softer USD amid positive sentiment with both equities and industrial metals moving higher. Concerns that the peace in Gaza may be less solid than what one might hope for also yields some support to Brent. Bets on tech stocks are rebounding, defying fears of trade war. Money moving back into markets. Gold continues upwards its strong trend and a softer dollar helps it higher today as well.

US crude & products probably rose 5.6 mb last week (API) versus a normal seasonal decline of 2.4 mb. The US API last night partial and thus indicative data for US oil inventories. Their data indicates that US crude stocks rose 7.4 mb last week, gasoline stocks rose 3.0 mb while Distillate stocks fell 4.8 mb. Altogether an increase in commercial crude and product stocks of 5.6 mb. Commercial US crude and product stocks normally decline by 2.4 mb this time of year. So seasonally adjusted the US inventories rose 8 mb last week according to the indicative numbers by the API. That is a lot. Also, the counter seasonal trend of rising stocks versus normally declining stocks this time of year looks on a solid pace of continuation. If the API is correct then total US crude and product stocks would stand 41 mb higher than one year ago and 6 mb higher than the 2015-19 average. And if we combine this with our knowledge of a sharp increase in production and exports by OPEC(+) and a large increase in oil at sea, then the current trend in US oil inventories looks set to continue. So higher stocks and lower crude oil prices until OPEC(+) switch to cuts. Actual US oil inventory data today at 18:00 CET.
US commercial crude and product stocks rising to 1293 mb in week 41 if last nights indicative numbers from API are correct.

Crude oil soon coming to a port near you. OPEC has lifted production sharply higher this autumn. At the same time demand for oil in the Middle-East has fallen as we have moved out of summer heat and crude oil burn for power for air-conditioning. The Middle-East oil producers have thus been able to lift exports higher on both accounts. Crude oil and condensates on water has shot up by 177 mb since mid-August. This oil is now on its way to ports around the world. And when they arrive, it will likely help to lift stocks onshore higher. That is probably when we will lose the last bit of front-end backwardation the the crude oil curves. That will help to drive the front-month Brent crude oil price down to the $60/b line and revisit the high $50ies/b. Then the eyes will be all back on OPEC+ when they meet in early November and then again in early December.
Crude oil and condensates at sea have moved straight up by 177 mb since mid-August as OPEC(+) has produced more, consumed less and exported more.

When it starts to move lower it moves rather quickly. Gaza, China, IEA. Brent crude is down 2.1% today to $62/b after having traded as high as $66.58/b last Thursday and above $70/b in late September. The sell-off follows the truce/peace in Gaze, a flareup in US-China trade and yet another bearish oil outlook from the IEA.
A lasting peace in Gaze could drive crude oil at sea to onshore stocks. A lasting peace in Gaza would probably calm down the Houthis and thus allow more normal shipments of crude oil to sail through the Suez Canal, the Red Sea and out through the Bab-el-Mandeb Strait. Crude oil at sea has risen from 48 mb in April to now 91 mb versus a pre-Covid normal of about 50-60 mb. The rise to 91 mb is probably the result of crude sailing around Africa to be shot to pieces by the Houthis. If sailings were to normalize through the Suez Canal, then it could free up some 40 mb in transit at sea moving onshore into stocks.
The US-China trade conflict is of course bearish for demand if it continues.
Bearish IEA yet again. Getting closer to 2026. Credibility rises. We expect OPEC to cut end of 2025. The bearish monthly report from the IEA is what it is, but the closer we get to 2026, the more likely the IEA is of being ball-park right in its outlook. In its monthly report today the IEA estimates that the need for crude oil from OPEC in 2026 will be 25.4 mb/d versus production by the group in September of 29.1 mb/d. The group thus needs to do some serious cutting at the end of 2025 if it wants to keep the market balanced and avoid inventories from skyrocketing. Given that IEA is correct that is. We do however expect OPEC to implement cuts to avoid a large increase in inventories in Q1-26. The group will probably revert to cuts either at its early December meeting when they discuss production for January or in early January when they discuss production for February. The oil price will likely head yet lower until the group reverts to cuts.
Dubai: The Mid-East anchor dragging crude oil lower. Surplus emerging in Mid-East pricing. Crude oil prices held surprisingly strong all through the summer. A sign and a key source of that strength came from the strength in the front-end backwardation of the Dubai crude oil curve. It held out strong from mid-June and all until late September with an average 1-3mth time-spread premium of $1.8/b from mid-June to end of September. The 1-3mth time-spreads for Brent and WTI however were in steady deterioration from late June while their flat prices probably were held up by the strength coming from the Persian Gulf. Then in late September the strength in the Dubai curve suddenly collapsed. Since the start of October it has been weaker than both the Brent and the WTI curves. The Dubai 1-3mth time-spread now only stands at $0.25/b. The Middle East is now exporting more as it is producing more and also consuming less following elevated summer crude burn for power (Aircon) etc.
The only bear-element missing is a sudden and solid rise in OECD stocks. The only thing that is missing for the bear-case everyone have been waiting for is a solid, visible rise in OECD stocks in general and US oil stocks specifically. So watch out for US API indications tomorrow and official US oil inventories on Thursday.
No sign of any kind of fire-sale of oil from Saudi Arabia yet. To what we can see, Saudi Arabia is not at all struggling to sell its oil. It only lowered its Official Selling Prices (OSPs) to Asia marginally for November. A surplus market + Saudi determination to sell its oil to the market would normally lead to a sharp lowering of Saudi OSPs to Asia. Not yet at least and not for November.
The 5yr contract close to fixed at $68/b. Of importance with respect to how far down oil can/will go. When the oil market moves into a surplus then the spot price starts to trade in a large discount to the 5yr contract. Typically $10-15/b below the 5yr contract on average in bear-years (2009, 2015, 2016, 2020). But the 5yr contract is usually pulled lower as well thus making this approach a moving target. But the 5yr contract price has now been rock solidly been pegged to $68/b since 2022. And in the 2022 bull-year (Brent spot average $99/b), the 5yr contract only went to $72/b on average. If we assume that the same goes for the downside and that 2026 is a bear-year then the 5yr goes to $64/b while the spot is trading at a $10-15/b discount to that. That would imply an average spot price next year of $49-54/b. But that is if OPEC doesn’t revert to cuts and instead keeps production flowing. We think OPEC(+) will trim/cut production as needed into 2026 to prevent a huge build-up in global oil stocks and a crash in prices. But for now we are still heading lower. Into the $50ies/b.
Some rebound but not much. Brent crude rebounded 1.5% yesterday to $65.47/b. This morning it is inching 0.2% up to $65.6/b. The lowest close last week was on Thursday at $64.11/b.
The curve structure is almost as week as it was before the weekend. The rebound we now have gotten post the message from OPEC+ over the weekend is to a large degree a rebound along the curve rather than much strengthening at the front-end of the curve. That part of the curve structure is almost as weak as it was last Thursday.
We are still on a weakening path. The message from OPEC+ over the weekend was we are still on a weakening path with rising supply from the group. It is just not as rapidly weakening as was feared ahead of the weekend when a quota hike of 500 kb/d/mth for November was discussed.
The Brent curve is on its way to full contango with Brent dipping into the $50ies/b. Thus the ongoing weakening we have had in the crude curve since the start of the year, and especially since early June, will continue until the Brent crude oil forward curve is in full contango along with visibly rising US and OECD oil inventories. The front-month Brent contract will then flip down towards the $60/b-line and below into the $50ies/b.
At what point will OPEC+ turn to cuts? The big question then becomes: When will OPEC+ turn around to make some cuts? At what (price) point will they choose to stabilize the market? Because for sure they will. Higher oil inventories, some more shedding of drilling rigs in US shale and Brent into the 50ies somewhere is probably where the group will step in.
There is nothing we have seen from the group so far which indicates that they will close their eyes, let the world drown in oil and the oil price crash to $40/b or below.
The message from OPEC+ is also about balance and stability. The world won’t drown in oil in 2026. The message from the group as far as we manage to interpret it is twofold: 1) Taking back market share which requires a lower price for non-OPEC+ to back off a bit, and 2) Oil market stability and balance. It is not just about 1. Thus fretting about how we are all going to drown in oil in 2026 is totally off the mark by just focusing on point 1.
When to buy cal 2026? Before Christmas when Brent hits $55/b and before OPEC+ holds its last meeting of the year which is likely to be in early December.
Brent crude oil prices have rebounded a bit along the forward curve. Not much strengthening in the structure of the curve. The front-end backwardation is not much stronger today than on its weakest level so far this year which was on Thursday last week.

The front-end backwardation fell to its weakest level so far this year on Thursday last week. A slight pickup yesterday and today, but still very close to the weakest year to date. More oil from OPEC+ in the coming months and softer demand and rising inventories. We are heading for yet softer levels.


Spotpriset på guld över 4300 USD och silver över 54 USD
Crude oil soon coming to a port near you

Guld och silver stiger hela tiden mot nya höjder
The Mid-East anchor dragging crude oil lower

Samtal om sällsynta jordartsmetaller, guld och silver

OPEC+ missar produktionsmål, stöder oljepriserna

Ett samtal om guld, olja, fjärrvärme och förnybar energi
Guld nära 4000 USD och silver 50 USD, därför kan de fortsätta stiga
Are Ukraine’s attacks on Russian energy infrastructure working?

Goldman Sachs höjer prognosen för guld, tror priset når 4900 USD
-
 Nyheter3 veckor sedan
OPEC+ missar produktionsmål, stöder oljepriserna
-
 Nyheter3 veckor sedan
Ett samtal om guld, olja, fjärrvärme och förnybar energi
-
 Nyheter2 veckor sedan
Guld nära 4000 USD och silver 50 USD, därför kan de fortsätta stiga
-
Analys3 veckor sedan
Are Ukraine’s attacks on Russian energy infrastructure working?
-
 Nyheter1 vecka sedan
Goldman Sachs höjer prognosen för guld, tror priset når 4900 USD
-

 Nyheter2 veckor sedan
Blykalla och amerikanska Oklo inleder ett samarbete
-

 Nyheter4 veckor sedan
Guldpriset uppe på nya höjder, nu 3750 USD
-
Nyheter2 veckor sedan
Ett samtal om guld, olja, koppar och stål