Analys
SHB Råvaruplanket 19 september 2012
 Centralbankerna har sista ordet
Bottenfiske lönade sig
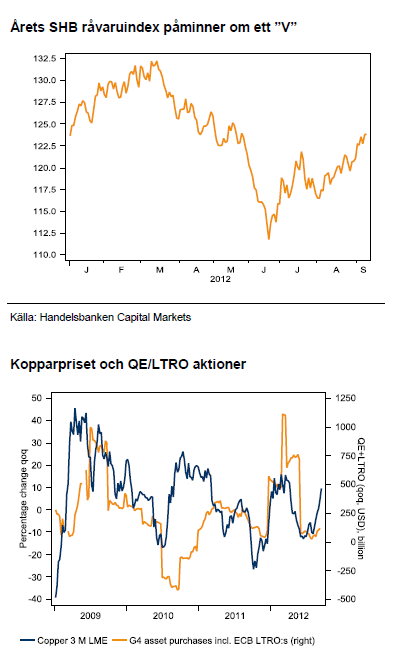
För ett kvartal sedan hittade vi mycket som pekade på att vi var nära botten i det negativa sentimentet. Det ser alltid som mörkast ut innan det vänder – och så var det även den gången. Vi trodde att olja, bas- och ädelmetaller skulle stiga från låga nivåer. Ett kvartal senare står de flesta råvaror 15-20 % högre i pris och årets utveckling påminner om ett ”V”.
Goda utsikter trots fladdrig realekonomi
Högre priser på råvaror och nedreviderade utsikter för de stora ekonomierna skapar förnimmelser av en marknad likt ett korthus. Vi lutar oss dock mot att Kina intensifierat stimulansvågen och att centralbankerna åter satt ner foten både genom mycket prat men till slut även handling, viktigast genom QE3. Perioder med lättare penningpolitik har under de senaste åren gett en råvarumarknad som ”glider uppåt”. Med stimulanser i luften tror vi att breda råvaruindex kommer stiga under resten av året. I en sådan miljö, med ett starkare Kina och stimulanspengar i systemet, förväntar vi oss att bas- och ädelmetaller kommer stiga mer än olja och spannmål. Guld har fått styrfart uppåt på utsikterna om frikostig penningpolitik i USA och Europa och vi intensifierar vår tro på ett stigande guldpris.
Oljerallyt drivet av ”en perfekt storm”
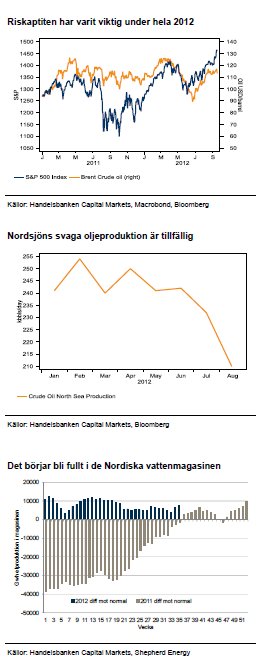
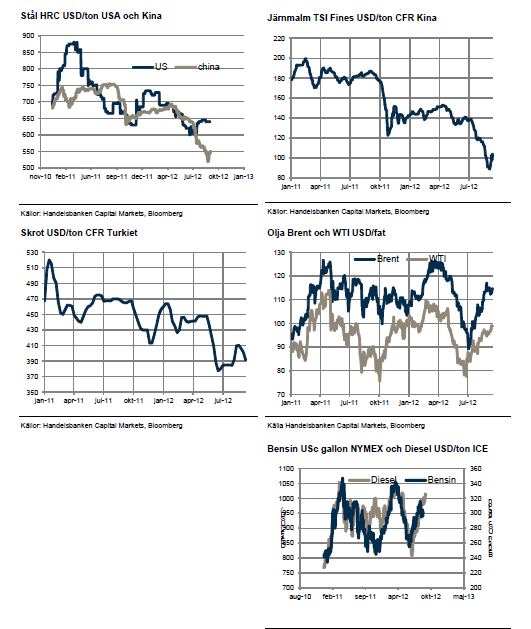
Strejken i Norge, stundande orkansäsong på Atlanten, konflikten mellan Israel och Iran samt ökad riskvilja på finansiella marknaden är oberoende händelser som snabbt drivit upp oljan från årslägsta omkring midsommar. Vi tycker att underliggande fundamenta är väl balanserad och ser inte högre oljepriser med mindre än en krigshandling från Israel mot Iran – vilket vi håller som osannolikt före valet i USA.
Vete har nått toppen
Efter den amerikanska torkans inverkan på vetepriset har mycket elände prisats in i grödan som, trots allt, har goda lagernivåer. Vi tror på lägre priser.
Basmetaller
Kinas nedgång är inprisad
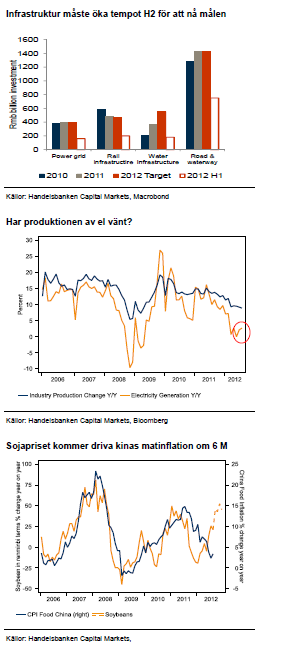
Det kan tyckas udda att vi håller basmetallerna bland det mest köpvärda i råvaru-universum just nu när ekonomer reviderat ner kinas tillväxtutsikter och Kina konsumerar 45 % av den globala produktionen av dessa konjunkturkänsliga metaller. Svaga globala tillväxtutsikter och en inbromsning i Kina är dock knappast en överraskning för någon längre. Kinas inköpschefsindex har kretsat omkring 50 i 12 månader nu. Fysiska handlare har haft gott om tid att sälja av lager av metall medan hedgefonder har kunnat ta positioner för en fallande marknad under lång tid. Därmed är också ett sämre Kina inprisat i dagens låga nivåer på basmetaller. Ett tydligt tecken på det är att basmetallerna inte föll när svag kinesisk makrodata för augusti släpptes.
Ny våg av stimulanser
Den kinesiska ekonomin har inte responderat speciellt väl på de stimulanser som har annonserats. Förklaringen är enkel; efterfrågan på krediter är klart lägre och därför får inte centralbankens likviditetsinjektioner lika stor effekt som under tidigare cykler. Vi tänker oss att de kinesiska ledarna har blivit tagna på sängen av den starka inbromsningen, delvis därför att de – som många andra- underskattat eurokrisens styrka och därmed underskattat exportbortfallets påverkan på BNP. Ledarna har helt enkelt hamnat bakom kurvan i ambitionen att styra ekonomin. I kölvattnet ser vi att ytterligare stimulansåtgärder annonserats. Denna gång dock inte i form av ökade krediter utan i form av infrastruktur projekt. Den medicin som fungerade så väl 2009. På längre sikt skapar detta mer av samma problem som man redan har men på kort sikt hjälper det ekonomin att hålla farten uppe.
Se upp för sojaprisdriven inflation
Sommarens värmebölja i USA har drivit upp priserna på bland annat sojabönor. Kina är världens största importör med en självförsörjningsgrad på låga 15 %. Kinas inflation drivs till stor del av livsmedelspriserna där soja är den enskilt viktigaste komponenten. I grafen till höger ses det starka sambandet mellan förändringar i sojapriset och kinas matinflation. Vi flaggar för att Kina står inför en kraftigt ökande importerad inflation från den stundande globala matpriskrisen simultant som inhemska stimulanser bidrar till inflationen. Två oberoende händelser som kommer verka för att mönstret med en allt starkare inhemsk konjunkturcykel i Kina håller på att växa fram -först stimulans sedan inflation.
Lång basmetallkorgen och lång nickel
Energi
USA ovilligt att stödja Israel
Under hela året har oljan handlats upp och ner på konflikten mellan Israel och Iran. Israel vill undanröja Irans möjligheter att anrika uran till halter dugliga för kärnvapen. Sanktionerna från USA och Europa gör att Iran nu har mycket svårt att exportera olja och därmed har produktionen fallit. I dag är det bara Indien och Kina som köper Irans olja.
Nyligen uttryckte Israels premiärminister, Netanyahu frustration över att USA sagt att man har ett år på sig att agera före Iran lyckats utveckla kärnvapen. Uttalandet är den första publika indikationen på att Washington och Israel inte drar jämt om hur Tehran ska hanteras. Israel fokuserar på riskerna kring att Iran skaffar sig möjligheterna att bygga kärnvapen medan USA avvaktar i fall de verkligen bygger kärnvapen. Vi tror inte att Israel vågar gå i krig med Iran utan stöd från USA, vilket israelerna verkar ha svårt att få under den rådande presidentvalskampanjen i USA. Mot den bakgrunden tycker vi att Brent handlas på höga nivåer med en stor riskpremie som snabbt kan pysa ut.
Utbudsstörningar i Nordsjön
Brent handlas FOB Shetlandsöarna. Utbudsstörningar i Nordsjön har haft en kraftig inverkan på priset under september. Dessa är av tillfällig art, Nordsjön kommer öka med 25 % i oktober och vi ser mer nedsida än uppsida i Brentpriset rent fundamentalt. Att centralbankerna står på gasen väger dock på uppsidan. Vi upprepar vår prognos för H2 på 110 USD.
Nu handlar SHB Power mot Q1 terminspris
Alla grundläggande fundamenta talar för låga elpriser; mycket vatten i magasinen inför vintern, låga kolpris, lågt pris på utsläppsrätter och en situation för kärnkraften som ser ovanligt bra ut. Dessa fundamenta är också inprisat i terminskurvan som handlas på riktigt låga nivåer. Vi ser därför att den samlade bilden talar för att risken ligger för högre elpriser den här vintern. Vad som krävs för att ge priset styrfart uppåt är ett omslag i väderprognosen, från nu rådande blöta läge med mycket vatten i magasinen. I grafen till höger är noll ett normalår för vattenmagasinen, definierat som senaste fem årens medelvärde för vattenståndet.
Lång El
Ädelmetaller
ECB och Fed har riggat för guld-rally
Vi har trott på stigande guld- och silverpriser sedan i april då vi såg den upptornande skuldkrisen och svaga amerikanska ekonomin som goda skäl för investarere att söka sig till de ädla värdebevarande metallerna.
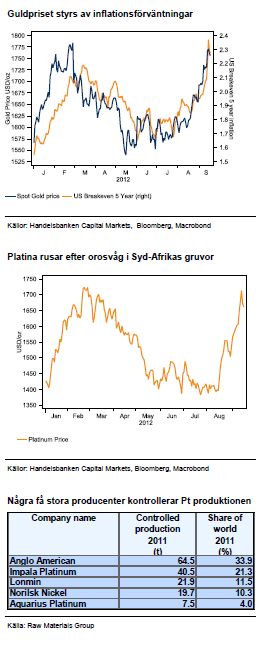
Under de senaste veckorna har EMU:s stödfond ESM kommit i ordning, ECB har signalerat oändliga interventioner och ovanpå detta lanserade Fed QE3. När det gäller Fed är det anmärkningsvärt vad den centralbanken har utfäst sig att göra. Man ska fortsätta eller öka stimulansåtgärderna fram till att utsikterna för arbetsmarknaden förbättras påtagligt förutsatt att centralbankens inflationsmål möts. Inflationsförväntningarna hoppade också upp kraftigt efter Feds besked och guldet har handlats hand i hand med förväntningarna, se bild upp till höger.
Åtgärderna från centralbankerna skapar den sedvanliga ”chock och bävan”-effekten. Tillgångspriserna stiger när centralbankernas balansräkning växer. Den enkla förklaringen lyder: mer risk för skattebetalarna betyder mindre risk för privat sektor. Guld och silver gynnas särskilt i egenskap av traditionellt skydd mot inflation. Guld har stigit 70 % under Feds två tidigare QE perioder då man hållit lånekostnaderna låga och köpt obligationer för 2,3 triljoner USD. Nu ska Fed köpa obligationer för 40 miljarder USD i månaden och hålla räntorna låga till 2015. Vi tror därför på högre guld och silverpriser.
Platina-brist efter strejkerna
Oron i Syd-afrikas platinagruvor har fått platinapriset att rusa. Vågen av uppror startade i gruvan Marikana som ägs av Lonmin och Anglo. Produktionen har nu varit stängd i fem veckor efter att polis öppnat eld mot gruvarbetare. Anglo har stängt fem andra gruvschakt för att kunna garantera säkerheten för arbetskraften, som består av 26 000 personer. Gold Fields är en annan producent som haft två strejker som avlöst varandra.
Platinagruvorna i Syd-afrika är dåligt mekaniserade har dålig infrastruktur och är därför arbetskraftintensiva. I början på året hade Impala en strejk som varade i 6 veckor vilket då fick priset att rusa. Vi tror att orosvågen kommer att fortsätta och konsekvenserna av den kommer försämra produktionen i Syd-afrika som står för 76 % av den globala produktionen.
Lång guld och ädelmetallkorgen
Jordbruk
Torkan har satt sina spår
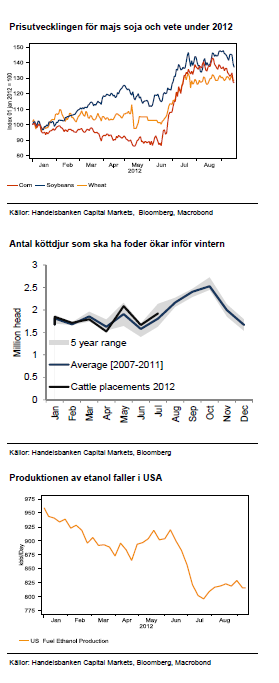
Efter en vinter och vår som såg mycket lovande ut för årets grödor så kom den värsta torkan i USA på mannaminne och förstörde mellan 12-15 % av den amerikanska soja- och majsskörden. Bristen på majs driver upp priset på vete som kan ersätta majs som djurfoder.
I den senaste rapporten från amerikanska jordbruksdepartementet fanns dock få justeringar för vete, soja och majs. Vi tror nu att det mesta från den fundamentala bilden kring årets skörd är känt och marknaden för soja börjar se ”toppig” ut med minskande export de senaste veckorna, trots det har terminerna stigit i pris. Vi tror att priserna kommer vara höga baserat på den strama marknaden men tror att terminskurvan kommer att skifta nedåt.
Framför oss ligger nu sådd av höstvete i USA, Europa och kring Svarta Havet, skörd av höstvete i Australien och sedan skörd av höstvete, soja och majs i Argentina och Brasilien efter nyår.
”Demand destruction” för majs
Efterfrågan på spannmål må vara inelastisk när vi människor konsumerar spannmålsbaserad mat. För djurfoder och etanoltillverkning är däremot kalkylerna avgörande för efterfrågan. Vi ser nu att en stor mängd köttdjur slaktas ut, framför allt i USA därför att fodret har blivit för dyrt med nuvarande köttpriser. Vi ser också att USAs etanolproduktion saktar ner även om marginalen åter blivit positiv med dagens höga pris på råolja som driver upp priset på bensin.
Starkt för soja svagt för vete
Starkast fundamenta har fortfarande soja där kinas import ligger kring rekord varje månad, trots höga priser. Kina har förmodligen nått sitt inhemska produktionstak och importen stiger för varje år. Soja har också längst till dess att odlingsåret avslutas med skörd i Argentina i februari. Svagast fundamenta finner vi för vete där utgående lager är bra och med mindre substitutionsdrivet stöd från majs så har vete stor fallhöjd sett över de kommande 6 månaderna. Det kanske bästa tecknet på att spannmålsmarknaden är ”toppig” är att den inte ”orkar” stiga ens när normalt prisdrivande data kommer ut.
Kort vete
Spreaden: Kort majs lång live cattle
Data
[box]SHB Råvaruplanket är producerat av Handelsbanken och publiceras i samarbete och med tillstånd på Råvarumarknaden.se[/box]
Ansvarsbegränsning
Detta material är producerat av Svenska Handelsbanken AB (publ) i fortsättningen kallad Handelsbanken. De som arbetar med innehållet är inte analytiker och materialet är inte oberoende investeringsanalys. Innehållet är uteslutande avsett för kunder i Sverige. Syftet är att ge en allmän information till Handelsbankens kunder och utgör inte ett personligt investeringsråd eller en personlig rekommendation. Informationen ska inte ensamt utgöra underlag för investeringsbeslut. Kunder bör inhämta råd från sina rådgivare och basera sina investeringsbeslut utifrån egen erfarenhet.
Informationen i materialet kan ändras och också avvika från de åsikter som uttrycks i oberoende investeringsanalyser från Handelsbanken. Informationen grundar sig på allmänt tillgänglig information och är hämtad från källor som bedöms som tillförlitliga, men riktigheten kan inte garanteras och informationen kan vara ofullständig eller nedkortad. Ingen del av förslaget får reproduceras eller distribueras till någon annan person utan att Handelsbanken dessförinnan lämnat sitt skriftliga medgivande. Handelsbanken ansvarar inte för att materialet används på ett sätt som strider mot förbudet mot vidarebefordran eller offentliggörs i strid med bankens regler.
Analys
Also OPEC+ wants to get compensation for inflation

Brent crude has fallen USD 3/b since the peak of Iran-Israel concerns last week. Still lots of talk about significant Mid-East risk premium in the current oil price. But OPEC+ is in no way anywhere close to loosing control of the oil market. Thus what will really matter is what OPEC+ decides to do in June with respect to production in Q3-24 and the market knows this very well. Saudi Arabia’s social cost-break-even is estimated at USD 100/b today. Also Saudi Arabia’s purse is hurt by 21% US inflation since Jan 2020. Saudi needs more money to make ends meet. Why shouldn’t they get a higher nominal pay as everyone else. Saudi will ask for it

Brent is down USD 3/b vs. last week as the immediate risk for Iran-Israel has faded. But risk is far from over says experts. The Brent crude oil price has fallen 3% to now USD 87.3/b since it became clear that Israel was willing to restrain itself with only a muted counter attack versus Israel while Iran at the same time totally played down the counterattack by Israel. The hope now is of course that that was the end of it. The real fear has now receded for the scenario where Israeli and Iranian exchanges of rockets and drones would escalate to a point where also the US is dragged into it with Mid East oil supply being hurt in the end. Not everyone are as optimistic. Professor Meir Javedanfar who teaches Iranian-Israeli studies in Israel instead judges that ”this is just the beginning” and that they sooner or later will confront each other again according to NYT. While the the tension between Iran and Israel has faded significantly, the pain and anger spiraling out of destruction of Gaza will however close to guarantee that bombs and military strifes will take place left, right and center in the Middle East going forward.
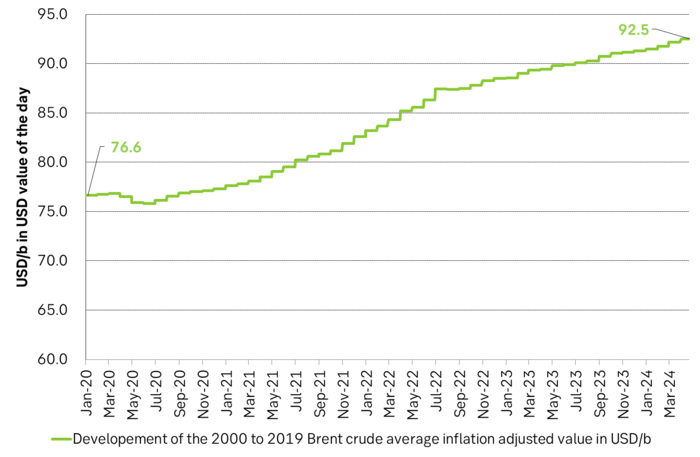
Also OPEC+ wants to get paid. At the start of 2020 the 20 year inflation adjusted average Brent crude price stood at USD 76.6/b. If we keep the averaging period fixed and move forward till today that inflation adjusted average has risen to USD 92.5/b. So when OPEC looks in its purse and income stream it today needs a 21% higher oil price than in January 2020 in order to make ends meet and OPEC(+) is working hard to get it.
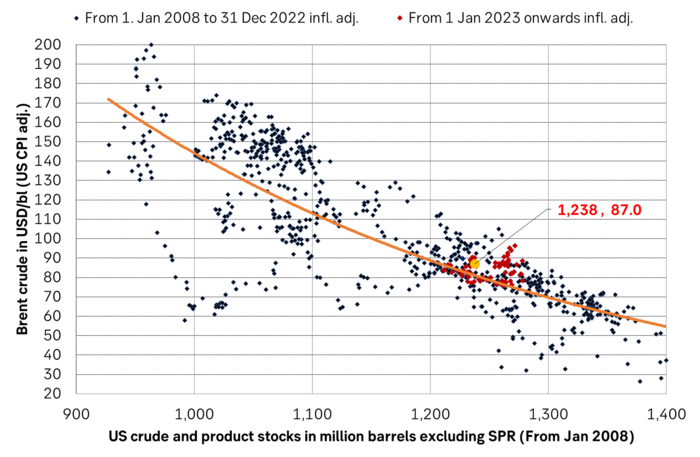
Much talk about Mid-East risk premium of USD 5-10-25/b. But OPEC+ is in control so why does it matter. There is much talk these days that there is a significant risk premium in Brent crude these days and that it could evaporate if the erratic state of the Middle East as well as Ukraine/Russia settles down. With the latest gains in US oil inventories one could maybe argue that there is a USD 5/b risk premium versus total US commercial crude and product inventories in the Brent crude oil price today. But what really matters for the oil price is what OPEC+ decides to do in June with respect to Q3-24 production. We are in no doubt that the group will steer this market to where they want it also in Q3-24. If there is a little bit too much oil in the market versus demand then they will trim supply accordingly.
Also OPEC+ wants to make ends meet. The 20-year real average Brent price from 2000 to 2019 stood at USD 76.6/b in Jan 2020. That same averaging period is today at USD 92.5/b in today’s money value. OPEC+ needs a higher nominal price to make ends meet and they will work hard to get it.
Inflation adjusted Brent crude price versus total US commercial crude and product stocks. A bit above the regression line. Maybe USD 5/b risk premium. But type of inventories matter. Latest big gains were in Propane and Other oils and not so much in crude and products
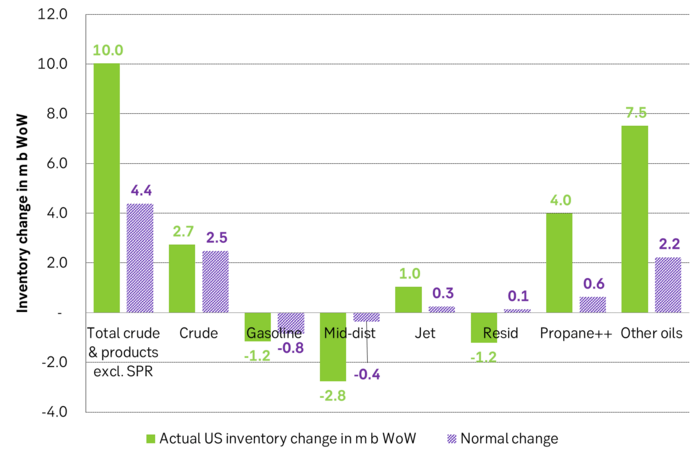
Total US commercial crude and product stocks usually rise by 4-5 m b per week this time of year. Gains have been very strong lately, but mostly in Propane and Other oils

Last week’s US inventory data. Big rise of 10 m b in commercial inventories. What really stands out is the big gains in Propane and Other oils
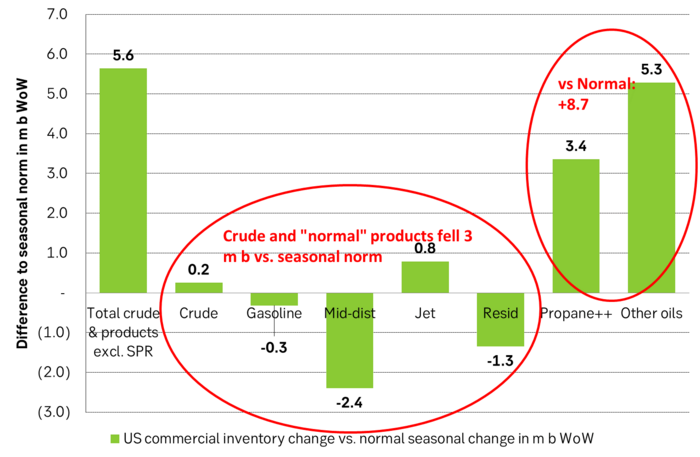
Take actual changes minus normal seasonal changes we find that US commercial crude and regular products like diesel, gasoline, jet and bunker oil actually fell 3 m b versus normal change.
Analys
Nat gas to EUA correlation will likely switch to negative in 2026/27 onward

Historically positive Nat gas to EUA correlation will likely switch to negative in 2026/27 onward

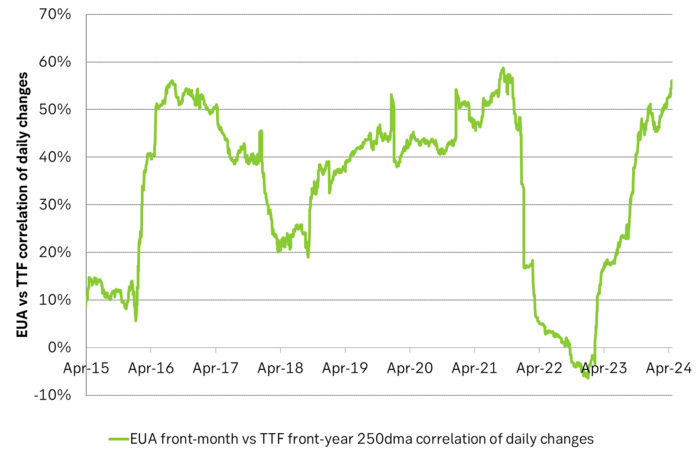
Historically there has been a strong, positive correlation between EUAs and nat gas prices. That correlation is still fully intact and possibly even stronger than ever as traders increasingly takes this correlation as a given with possible amplification through trading action.
The correlation broke down in 2022 as nat gas prices went ballistic but overall the relationship has been very strong for quite a few years.
The correlation between nat gas and EUAs should be positive as long as there is a dynamical mix of coal and gas in EU power sector and the EUA market is neither too tight nor too weak:
Nat gas price UP => ”you go black” by using more coal => higher emissions => EUA price UP
But in the future we’ll go beyond the dynamically capacity to flex between nat gas and coal. As the EUA price moves yet higher along with a tightening carbon market the dynamical coal to gas flex will max out. The EUA price will then trade significantly above where this flex technically will occur. There will still be quite a few coal fired power plants running since they are needed for grid stability and supply amid constrained local grids.
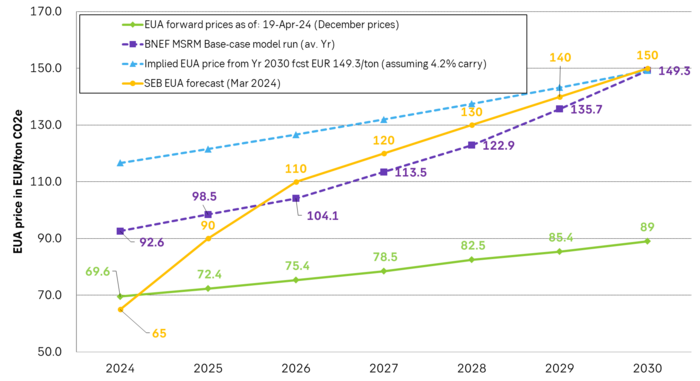
As it looks now we still have such overall coal to gas flex in 2024 and partially in 2025, but come 2026 it could be all maxed out. At least if we look at implied pricing on the forward curves where the forward EUA price for 2026 and 2027 are trading way above technical coal to gas differentials. The current forward pricing implications matches well with what we theoretically expect to see as the EUA market gets tighter and marginal abatement moves from the power sector to the industrial sector. The EUA price should then trade up and way above the technical coal to gas differentials. That is also what we see in current forward prices for 2026 and 2027.
The correlation between nat gas and EUAs should then (2026/27 onward) switch from positive to negative. What is left of coal in the power mix will then no longer be dynamically involved versus nat gas and EUAs. The overall power price will then be ruled by EUA prices, nat gas prices and renewable penetration. There will be pockets with high cost power in the geographical points where there are no other alternatives than coal.
The EUA price is an added cost of energy as long as we consume fossil energy. Thus both today and in future years we’ll have the following as long as we consume fossil energy:
EUA price UP => Pain for consumers of energy => lower energy consumption, faster implementation of energy efficiency and renewable energy => lower emissions
The whole idea with the EUA price is after all that emissions goes down when the EUA price goes up. Either due to reduced energy consumption directly, accelerated energy efficiency measures or faster switch to renewable energy etc.
Let’s say that the coal to gas flex is maxed out with an EUA price way above the technical coal to gas differentials in 2026/27 and later. If the nat gas price then goes up it will no longer be an option to ”go black” and use more coal as the distance to that is too far away price vise due to a tight carbon market and a high EUA price. We’ll then instead have that:
Nat gas higher => higher energy costs with pain for consumers => weaker nat gas / energy demand & stronger drive for energy efficiency implementation & stronger drive for more non-fossil energy => lower emissions => EUA price lower
And if nat gas prices goes down it will give an incentive to consume more nat gas and thus emit more CO2:
Cheaper nat gas => Cheaper energy costs altogether, higher energy and nat gas consumption, less energy efficiency implementations in the broader economy => emissions either goes up or falls slower than before => EUA price UP
Historical and current positive correlation between nat gas and EUA prices should thus not at all be taken for granted for ever and we do expect this correlation to switch to negative some time in 2026/27.
In the UK there is hardly any coal left at all in the power mix. There is thus no option to ”go black” and burn more coal if the nat gas price goes up. A higher nat gas price will instead inflict pain on consumers of energy and lead to lower energy consumption, lower nat gas consumption and lower emissions on the margin. There is still some positive correlation left between nat gas and UKAs but it is very weak and it could relate to correlations between power prices in the UK and the continent as well as some correlations between UKAs and EUAs.
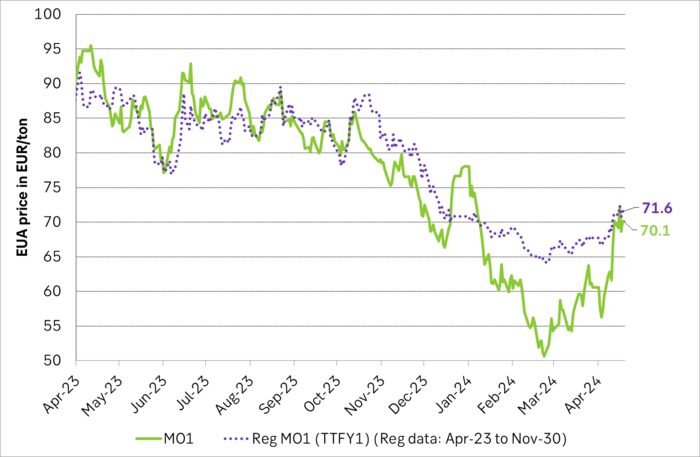
Correlation of daily changes in front month EUA prices and front-year TTF nat gas prices, 250dma correlation.
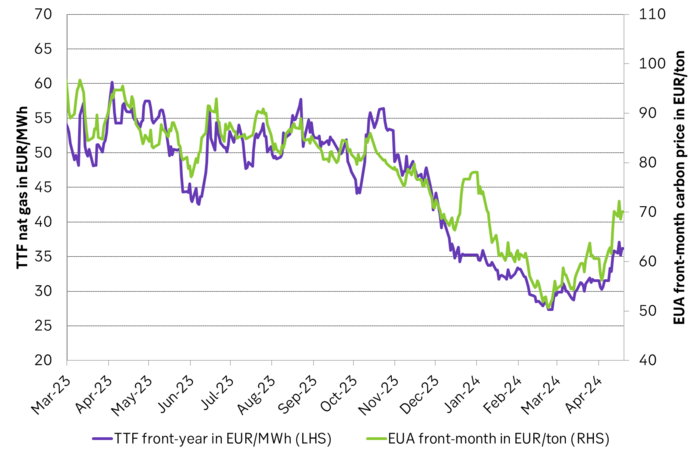
EUA price vs front-year TTF nat gas price since March 2023
Front-month EUA price vs regression function of EUA price vs. nat gas derived from data from Apr to Nov last year.
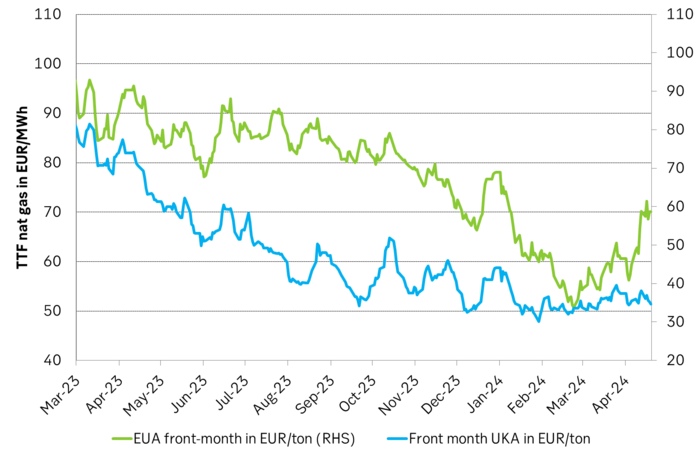
The EUA price vs the UKA price. Correlations previously, but not much any more.
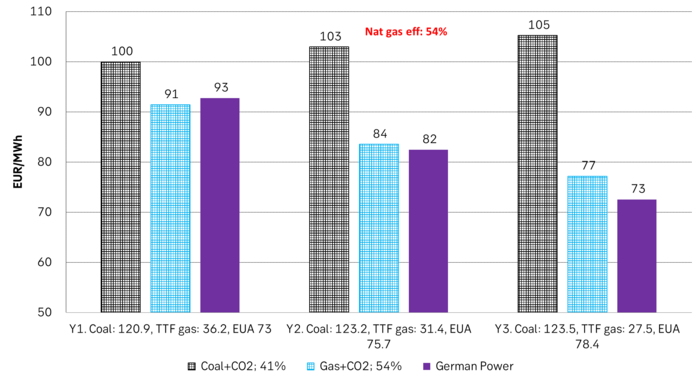
Forward German power prices versus clean cost of coal and clean cost of gas power. Coal is totally priced out vs power and nat gas on a forward 2026/27 basis.
Forward price of EUAs versus technical level where dynamical coal to gas flex typically takes place. EUA price for 2026/27 is at a level where there is no longer any price dynamical interaction or flex between coal and nat gas. The EUA price should/could then start to be negatively correlated to nat gas.
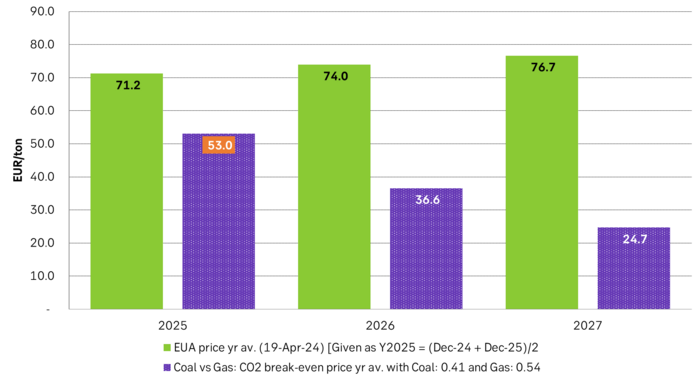
Forward EAU price vs. BNEF base model run (look for new update will come in late April), SEB’s EUA price forecast.
Analys
Fear that retaliations will escalate but hopes that they are fading in magnitude

Brent crude spikes to USD 90.75/b before falling back as Iran plays it down. Brent crude fell sharply on Wednesday following fairly bearish US oil inventory data and yesterday it fell all the way to USD 86.09/b before a close of USD 87.11/b. Quite close to where Brent traded before the 1 April attack. This morning Brent spiked back up to USD 90.75/b (+4%) on news of Israeli retaliatory attack on Iran. Since then it has quickly fallen back to USD 88.2/b, up only 1.3% vs. ydy close.

The fear is that we are on an escalating tit-for-tat retaliatory path. Following explosions in Iran this morning the immediate fear was that we now are on a tit-for-tat escalating retaliatory path which in the could end up in an uncontrollable war where the US unwillingly is pulled into an armed conflict with Iran. Iran has however largely diffused this fear as it has played down the whole thing thus signalling that the risk for yet another leg higher in retaliatory strikes from Iran towards Israel appears low.
The hope is that the retaliatory strikes will be fading in magnitude and then fizzle out. What we can hope for is that the current tit-for-tat retaliatory strikes are fading in magnitude rather than rising in magnitude. Yes, Iran may retaliate to what Israel did this morning, but the hope if it does is that it is of fading magnitude rather than escalating magnitude.
Israel is playing with ”US house money”. What is very clear is that neither the US nor Iran want to end up in an armed conflict with each other. The US concern is that it involuntary is dragged backwards into such a conflict if Israel cannot control itself. As one US official put it: ”Israel is playing with (US) house money”. One can only imagine how US diplomatic phone lines currently are running red-hot with frenetic diplomatic efforts to try to defuse the situation.
It will likely go well as neither the US nor Iran wants to end up in a military conflict with each other. The underlying position is that both the US and Iran seems to detest the though of getting involved in a direct military conflict with each other and that the US is doing its utmost to hold back Israel. This is probably going a long way to convince the market that this situation is not going to fully blow up.
The oil market is nonetheless concerned as there is too much oil supply at stake. The oil market is however still naturally concerned and uncomfortable about the whole situation as there is so much oil supply at stake if the situation actually did blow up. Reports of traders buying far out of the money call options is a witness of that.
-

 Nyheter3 veckor sedan
Guldpriset når nytt all time high och bryter igenom 2300 USD
-
 Nyheter4 veckor sedan
Lundin Mining får köprekommendation av BMO
-

 Nyheter4 veckor sedan
Vertikal prisuppgång på kakao – priset toppar nu 9000 USD
-

 Nyheter3 veckor sedan
Centralbanker fortsatte att köpa guld under februari
-

 Nyheter4 veckor sedan
Kaffepriserna stiger på lågt utbud och stark efterfrågan
-
 Nyheter2 veckor sedan
USAs stigande konsumtion av naturgas
-

 Nyheter2 veckor sedan
Kakaomarknaden är extrem för tillfället
-

 Nyheter3 veckor sedan
Hur mår den svenska skogsbraschen? Två favoritaktier


