

Analys
SHB Råvarubrevet 8 mars 2013

 Råvaror allmänt
Råvaruraset planar ut
Efter en period av negativa överraskningar i världsekonomin börjar den amerikanska industrisektorn se ljusare ut. Överraskningsindex i USA brukar normalt skena söderut efter att ekonomer blivit överoptimistiska efter en tid med allt bättre data. Så är det inte denna gången och mönstret liknar mest 2010. Då som nu huvudsakligen drivet av en urstark börs. Hursomhelst nalkas budgetåtstramningar när USA trillar ner för budgetstupet och i Europa tilltar oron efter det oklara politiska läget i Italien. Under förra veckan kulminerade de kraftiga negativa reaktionerna på kinesiska myndigheters ambition att dämpa prisuppgången på fastigheter. Byggbolagen på Shanghaibörsen hade det kraftigaste raset på en dag sedan finanskrisen och råvarumarknaden prisade in lägre efterfrågan till byggsektorn i framför allt basmetaller.
Återigen har det visat sig hur viktigt sentimentet är i Kina för råvarornas utveckling. Under denna vecka har de nya ledarna tillträtt och i talet som avgående premiärministern Wen Jiabao höll så kan man efter 30 sidors självberömmelse åt det kinesiska kommunistpartiet utläsa att tillväxtmålet för 2013 ligger kvar på 7,5 %. Detta var en positiv signal för marknaden och fick Shanghaibörsen att vända uppåt.
Basmetallerna
Fortsatt svajigt för basmetallerna
Basmetaller fortsätter svaja omkring i tekniska intervall, något starkare i början av veckan då Fed:s Yellen var duvaktig och fick ner dollarn något samtidigt som bättre signaler från Kina kom med ett bibehållet tillväxtmål. Skarpt stigande lager för basmetallerna väger i den negativa vågskålen och dämpar alla tendenser till rally.
Under första veckan i mars är zink och aluminium de basmetaller som fortsatt vara svaga medan nickel och koppar visat på svag styrka. Under de senaste tre månaderna har lagren för koppar klättrat till toppnivåerna efter finanskrisen. Vi tror att basmetallerna kommer konsolideras för att söka ny riktning efter senaste raset under februari.
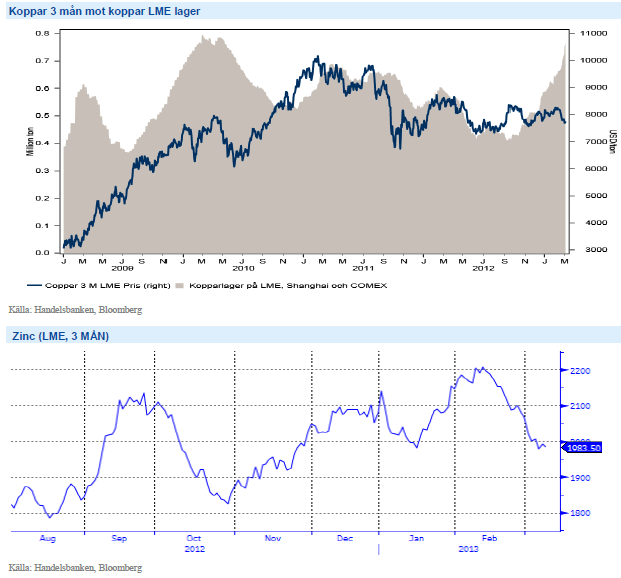
Trots nedgången under veckan tror vi på högre priser på basmetaller och ser istället möjlighet till ”buy on dip”. Vi tror på: BASMET H
Ädelmetaller
Guru eller dödskors; ska guldet bli till sand?
Under veckan som gått har vi kunnat läsa om en guru (okänd för oss) som hävdar att ingen tror på guldpriset, och därför är guld köpvärt. Även vårt eget inlägg om den tekniska signalen ”dödskorset” har blivit flitigt citerat. Dödskorset ska teoretiskt indikera en prisnedgång i antågande. Ytterligare en musikalisk referens poppar upp; Vem ska jag tro på?
Om vi börjar med guru-resonemanget, d.v.s. ingen tror på guldet, alltså ska det stiga (minsta motståndets lag). Detta gäller ENBART om ”allas” positioner reflekterar den rådande vyn, det är alltför förenklande att bara lyssna på folks åsikter för att avgöra vad som är den ”motsatta” vyn (the contrarian). Det vi ser i våra flöden indikerar inte alls att folk sålt ut sitt guld. Att vara contrarian just nu är kanske inte att tro på en nedgång, utan kanske att tro på en riktigt rejäl nedgång? Vad är rätt värde på guld? Det vi vet när det gäller guld är att ingen ”behöver” guld på samma sätt som vi behöver olja, koppar, spannmål och så vidare, utan vi har guld som en värdebevarare. Det innebär att värdet sätts enligt principen ”tavelvärdering”, dvs. värdet är vad nästa köpare är beredd att betala. Om alla skulle bestämma sig för att det inte är värt dagens pris, då finns det inget ”golv” för priset på det sätt som det finns i andra råvaror, där det oftast utgörs av marginalkostnaden för ny produktion. Så, hur långt kan det falla om det börjar falla på riktigt? Vi vet inte, men det värt att påminna om att för tio år sedan kostade ett uns drygt 300 dollar, idag kostar det strax under 1 600 dollar. Och guldet är likadant idag som då, och allt guld som utvunnits sedan dess finns fortfarande. Vilket för övrigt gäller allt guld som någonsin utvunnits.
Februari månad hade det största utflödet ur ETF guld sedan det populära fenomen att investera i guld via börshandlade fonder startade för ca 10 år sedan. Vi vände vår förut positiva syn på guld till negativ i början av februari. Det finns flera argument för att vi inte längre tror på högre guldpriser. Sammanfattningsvis kan man säga att de alla går under temat att investerare nu söker ”tillväxt före likviditet”.
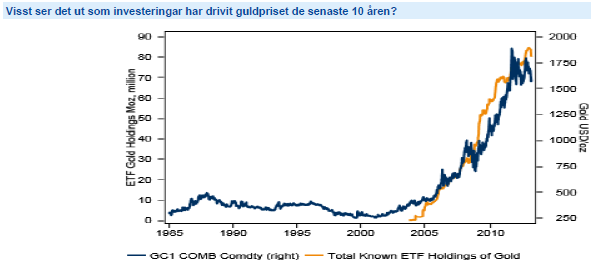
Starkare dollar och högre räntor blir utmanande för guldet samtidigt som inflationen väntas vara låg under året. Vi tror på: GULD S H
Energi
Ökad politisk risk på oljemarknaden
Under veckan gick Venezuelas president Chavez bort och även om det inte hade någon omedelbar effekt på oljepriset så ökar det den politiska risken på oljemarknaden. Den starke ledaren lämnar ett politiskt vakuum efter sig som adderar svag riskpremie i oljepriset. Ett läckage på Cormorant Alpha plattformen i Nordsjön har tvingat pipelines ur funktion och drivit på brentoljan. Andra faktorer som gett stöd åt oljepriset i veckan är att Kinas tillväxtmål för 2013 ligger kvar på 7,5 % men också en förbättring i den amerikanska ekonomin. För övrigt inga större rörelser på oljepriset den senaste veckan. Vi kan notera data om ökade lager på råoljan med 3,8m fat (väntat + 0,53m fat), minskade destillatlager med 3,8m fat (väntat – 0,9m fat) samt minskade bensinlager med 0,6m fat (väntat – 0.7m fat).
Stilla på elmarknaden även denna vecka där kontraktet Q2 2013 handlas upp 0.4 procent. Vikande kol och utsläppsrätter balanseras av torrare och kallare väderprognoser. Efter en period med 1.5TWh nederbörd över normalt i Norden ser det åter lite värre ut för den totala energibalansen som p.g.a. ett högtrycksbetonat väder nu förväntas landa på ca -15,7 TWh mot slutet av nästa vecka, vilket kan ge bra skjuts till elpriset. Vi ligger kvar med en neutral syn. I övrigt rullar vi idag över från Q2 till Q3 kontraktet i SHB Power Index.
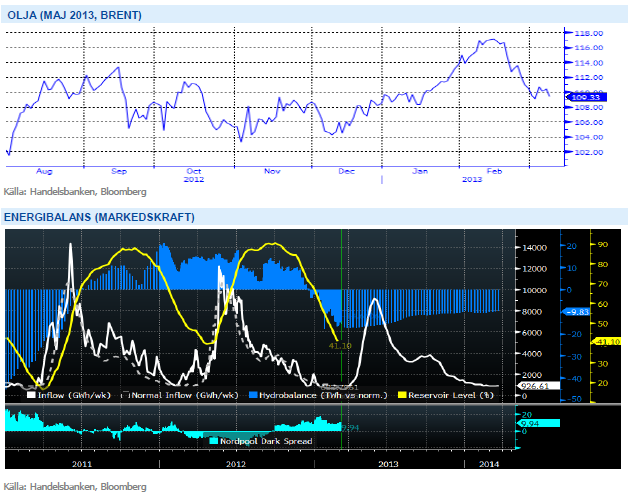
Den råvarugrupp som är mest beroende av den globala konjunkturen är Energi och med en starkare konjunktur ser vi positivt på utvecklingen för denna sektor. Vi tror på: ENERGI H
Livsmedel
Stark export ger stöd åt sojabönor
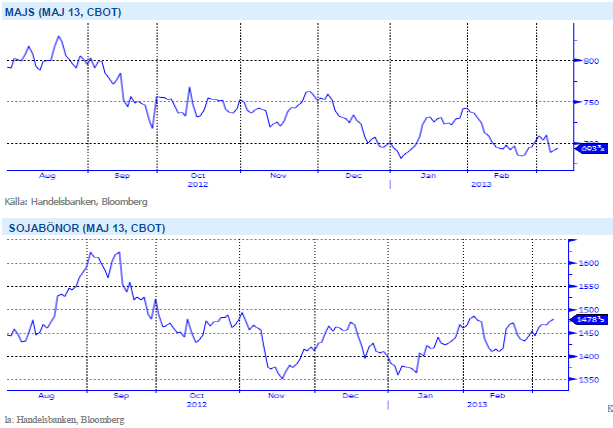
Priserna på majs i Chicago har gått ned under veckan, även denna vecka delvis som följd av att nederbörd förbättrat förutsättningen för pågående/kommande majssådd i USA. En del regioner vill fortfarande ha mycket mer nederbörd men helt klart är oron nu mindre än för några veckor sedan. Även i Argentina har väderleken förbättrats och det talas nu allt mindre om oro för torrt väder. Inga större förändringar väntas i morgondagens WASDE-rapport från USDA – amerikanska majslager beräknas justeras upp marginellt som följd av fortsatt låg exporttakt och globala lager spås istället bli något nedjusterade.
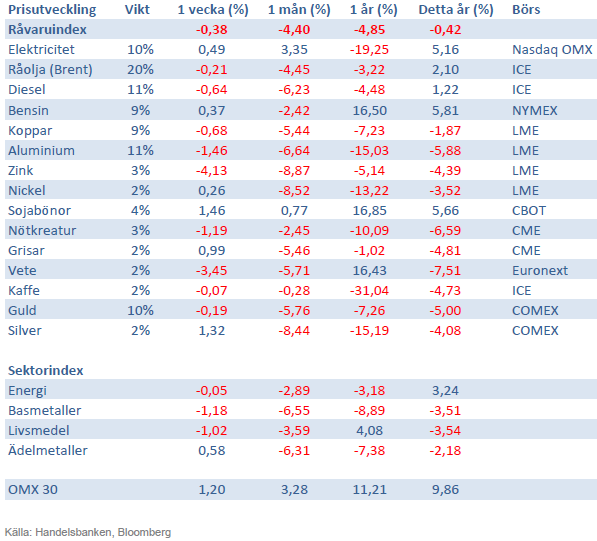
Priserna på sojabönor i Chicago noteras upp något sedan förra veckan, delvis fortsatt påverkat av stark amerikansk export. I Brasilien fortsätter skörden utan större problem. I bland annat regionerna Bahia och Mato Grosso Do Sul är avkastningen lite lägre än väntat och produktionsnivån för Sydamerika bör justeras ned i dagens WASDE-rapport. Rapporten bör även innehålla nedjusterade lagersiffror för USA som följd av den alltjämt starka exporten. Stark efterfrågan och låga lagernivåer ger stöd och på kort sikt är det svårt att se en nedsida för sojan. Faller USDA:s prognos väl in för årets skörd i USA lär vi dock få se klart lägre priser längre fram på året, grödan ska dock först sås och mycket kan hända innan skörd.
Vi behåller vår negativa syn för soja, majs och vete, trots riskerna för torrt väder i USA. Normal väderlek bör ge press på spannmålspriserna. Vi tror på: LIVSMEDEL S H
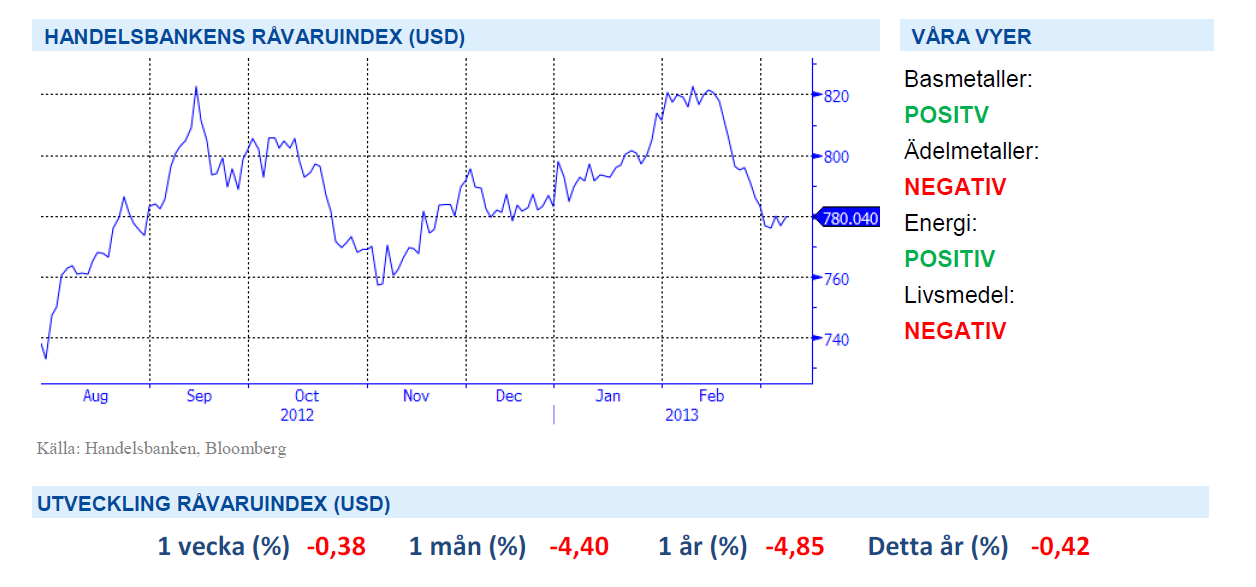
Handelsbankens Råvaruindex
Handelsbankens råvaruindex består av de underliggande indexen för respektive råvara. Vikterna är bestämda till hälften från värdet av global produktion och till hälften från likviditeten i terminskontrakten.
[box]SHB Råvarubrevet är producerat av Handelsbanken och publiceras i samarbete och med tillstånd på Råvarumarknaden.se[/box]
Ansvarsbegränsning
Detta material är producerat av Svenska Handelsbanken AB (publ) i fortsättningen kallad Handelsbanken. De som arbetar med innehållet är inte analytiker och materialet är inte oberoende investeringsanalys. Innehållet är uteslutande avsett för kunder i Sverige. Syftet är att ge en allmän information till Handelsbankens kunder och utgör inte ett personligt investeringsråd eller en personlig rekommendation. Informationen ska inte ensamt utgöra underlag för investeringsbeslut. Kunder bör inhämta råd från sina rådgivare och basera sina investeringsbeslut utifrån egen erfarenhet.
Informationen i materialet kan ändras och också avvika från de åsikter som uttrycks i oberoende investeringsanalyser från Handelsbanken. Informationen grundar sig på allmänt tillgänglig information och är hämtad från källor som bedöms som tillförlitliga, men riktigheten kan inte garanteras och informationen kan vara ofullständig eller nedkortad. Ingen del av förslaget får reproduceras eller distribueras till någon annan person utan att Handelsbanken dessförinnan lämnat sitt skriftliga medgivande. Handelsbanken ansvarar inte för att materialet används på ett sätt som strider mot förbudet mot vidarebefordran eller offentliggörs i strid med bankens regler.


Selling down on a ”deal”. Brent crude fell 6.2% last week with accelerated weakness towards the end of the week. Close of the week at $87.33/b and low of the week (and on Friday) of $85.8/b. Brent is falling another 4% this morning to $83.7/b on confirmation by Iran that a MoU text has been reached and that it will be signed on Friday this week.

So what is this ”deal” worth? Talk on the desk here this morning is that it is much like ”putting lipstick on a pig” where Trump has to sell this at home as a victory where ”the SoH has reopened”, the nuclear issue will be ironed out over the coming 60 days (or maybe 600 days?) and US consumers are getting a lower gasoline price and maybe US republicans survives the midterm elections.
The importance for Iran is that it emerges as the defacto winner of this war in the eyes of the non-US public world. That Iran now onwards is the ”ruler of the SoH” (combo of geography and new weapons systems like drones) or more softer: ”the guarantor of safe passage through the SoH”.
Iran doesn’t need nuclear weapons any more. Nuclear deterrence doesn’t work any more. Ukraine has made many attacks deep into Russia without being nuked in return. Plenty of Iranian ballistic rockets blasts over Israel but Iran wasn’t nuked in return.
There is no trust between the US and Iran. We don’t know all the details yet of the MoU. But what we do know is that there is no trust between the US and Iran what so ever. This is probably more like a descriptive text on how they can cooperate in a way where both sides keeps tactical leverage. Neither side makes irreversible concessions. Violations can be punished quickly. Cooperation produces immediate benefits.
This is a fragile structure. It can easily break down. There may be details which cannot be overcome. To be seen on Friday. The US has to show that it is willing put enough force behind managing and restraining Israel versus Hezbollah in Lebanon. We have seen that Netanyahu hasn’t listened all that much to Trump’s directives and wishes. This could be a major obstacle.
A gradual reopening is tactically preferable for Iran. A tactical leverage for Iran right now is that global oil stocks have been drawn down towards painful and increasingly dangerous levels with increasing risks for oil price spikes in mid-July to August. This together with US midterm elections on 3 November gives tactical leverage to Iran. Iran probably doesn’t want to fully give up on that leverage. A rapid, full reopening where global stocks are able to refill over the coming 60 days will significantly erode that leverage. If Iran reinstates a closure of the SoH after 60 days (if talks break down again), then the effect won’t be that impactful in terms of prices and the US midterm elections.
So a gradual and partial reopening where global markets gets the oil they need while they are unable to rebuild stocks could be a practical middle way for both parties. Trump can sell it as ”the SoH has reopened” and get affordable gasoline for US consumers. Iran can sell it as ”the SoH has fully reopened, but there is some friction” so flow is only 60-80% of normal.
Not much real demand destruction below $100/b. What we do know is that there is not much real price pain demand destruction for oil globally at an oil price below $100/b. A lot of demand-shock destruction. Fear. But demand should now come roaring back towards normal with fear for exceptionally high prices now is rapidly receding.
Sudden China demand destruction due to EVs? Bullocks. EV share of total Chinese carpool now around 13%. Share of new sales of EVs has reached 50%. This is a very gradual process. It doesn’t make oil demand fall like a rock over night. When EV new sales share reaches 100%, then the gasoline car pool will contract by some 5-10% per year. But that is only gasoline. Sudden reduction in Chinese oil demand is more about shock and risk.
Chinese crude oil imports will come roaring back. At what price? Today’s ”neutral” oil price is $70/b. That is the five year price which has steadily traded around the $70/b mark over the past 3-4 years. With still a risky picture one would think that China and the rest of the world will be big buyers of oil in the range of $70-85/b.
Global demand will likely snap back towards normal, forecasted demand and growth at such prices.
Physical reopening is a gradual process. The physical and practical reopening of the SoH will likely be gradual rather than sudden. And that probably suites Iran tactically as well.
Brent M1 price versus the Brent 5-yr (today’s ”normal” price)

Market is starting to take US/Iran headlines with a pinch of salt. Brent crude rose $2.8/b yesterday to an official close of $112.1/b. But after that it traded as low as $108.05/b before ending late night at around $109.7/b. Through the day it traded in a range of $106.87 – 112.72/b amid a flurry of news or rumors from Iran and the US. ”US temporary sanctions during negotiations” (falls alarm). ”We will bomb Iran” (not anyhow),… etc. While the market is still fluctuating to this kind of news flow, it is starting to take such headlines with a pinch of salt.
We’ll see. Maybe, maybe not. The Brent M1 contract is trading at $110.2/b this morning which very close to the average ticks through yesterday of $110.4/b.
Trump with bearish, verbal intervention whenever Brent trades above $110/b it seems. What seems to be a pattern is that Trump states something like ”very good negotiations going on with Iran”, ”New leaders in Iran are great,..”, ”Great progress in negotiations,…”, ”Deal in sight,..” etc whenever the Brent M1 contract trades above $110/b. An effort to cool the market. These hot air verbal interventions from Trump used to have a heavy bearish impact on prices, but they now seems to have less and less effect unless they are backed by reality.
As far as we can see there has been no real progress in the negotiations between the US and Iran with both sides still standing by their previous demands.
Iran is getting stronger while the cease fire lasts making a return to war for Trump yet harder. Iran is naturally in constant preparation for a return to war given Trump’s steady threats of bombing Iran again. Iran is naturally doing what ever is possible to prepare for a return to war. And every day the cease fire lasts it is better prepared. This naturally makes it more and more difficult and dangerous for the US to return to warring activity versus Iran as the consequences for energy infrastructure in the Persian Gulf will be more and more severe the longer the cease fire lasts. Israel seems to see it this way as well. That the war is not won and that current frozen state of a cease fire gives Iran opportunity to rebuild military and politically.
Global inventories are drawing down day by day. How much? In the meantime the Strait of Hormuz stays closed. There is varying measures and estimates of how much global inventories are drawing down. Our rough estimate, back of the envelope, is that global inventories are drawing down by at least some 10 mb/d or about 300 mb/d in a balance between loss of supply versus demand destruction. Other estimates we see are a monthly draw of 250-270 mb/d. The IEA only ’measured’ a draw in global observable stocks of 117 mb in April with oil on water rising 53 mb while on shore stocks fell 170 mb. But global stocks are hard to measure with large invisible, unmeasured stocks. As such a back of the envelope approach may be better.
Oil products is what the world is consuming. Oil product prices likely to rise while product stocks fall. Strategic Petroleum Reserves (SPR) are predominantly crude oil. Discharging oil from OECD SPR stocks, a sharp reduction in Chinese crude imports and a reduction in global refinery throughput of 6-7 mb/d has helped to keep crude oil markets satisfactorily supplied. But global inventories are drawing down none the less. And oil products is really what the world is consuming. So if global refinery throughput stays subdued, then demand will eventually have to match the supply of oil products. The likely path forward this summer is a steady draw down in jet fuel, diesel and gasoline. Higher prices for these. Then, if possible, higher refinery throughput and higher usage of crude in response to very profitable refinery margins. And lastly sharper draw in crude stocks and higher prices for these. But some 6 mb/d of oil products used to be exported through the Strait of Hormuz. And it may not be so easy to ramp up refinery activity across the world to compensate. Especially as Ukraine continues to damage Russian refineries as well as Russian crude production and export facilities.
Watch oil product stocks and prices as well as Brent calendar 2027. What to watch for this summer is thus oil product inventories falling and oil product premiums to crude rising. Another measure to watch is the Brent crude 2027 contract as it rises steadily day by day as the Strait of Hormuz stays closed and global oil inventories decline. The latter is close to the highest level since the start of the war and keeps rising.
The Brent M1 contract and the Brent 2027 prices and current price of jet fuel in Europe (ARA). All in USD/b

Our back of the envelope calculation of the global shortage created by the closure of the Strait of Hormuz. Note that 3.5 mb/d of discharge from SPR is also a draw. Note also that ’Forced demand loss’ of 2.5 mb/d is probably temporary and will fall back towards zero as logistics are sorted out leaving ’Price demand loss’ to do the job of balancing the market. Thus a shortfall of at least 9 mb/d created by the closure. More if SPR discharge is included and more if Forced demand loss recedes.

Brent is climbing higher. Front-month is at USD 106.3/bl this morning, close to a weekly high and a USD 9/bl jump from Mondays open. This is the move we flagged as a risk earlier in the week: the market shifting from ”a deal is around the corner” to ”this is going to take longer than we thought”.

Analyst Commodities, SEB
During April, rest-of-year Brent remained remarkably stable around USD 90/bl. A stability which rested on one single assumption: the SoH reopens around 1 May. That assumption is now slowly falling apart.
As we highlighted yesterday: every week of delay beyond 1 May adds (theoretically) ish USD 5/bl to the rest-of-year average, as global inventories draw 100 million barrels per week. i.e., a mid-May reopening implies rest-of-year Brent closer to USD 100/bl, and anything pushing into June or July takes us meaningfully higher.
What’s changed in the last 48 hours:
#1: The US military has formally warned that clearing suspected sea mines from SoH could take up to six months. That is a completely different timescale from what the financial market is pricing. Even a political deal tomorrow does not immediately reopen the strait.
#2: Trump has shifted his tone from urgency to ”strategic patience”. In yesterday’s press conference: ”Don’t rush me… I want a great deal.” The market is reading this as a president no longer feeling pressured by timelines, with the naval blockade running in the background.
#3: So far, the military activity is escalating, not de-escalating. Axios reports Iran is laying more mines in SoH. The US 3rd carrier strike group (USS George H.W. Bush) is arriving with two countermine vessels. Trump yesterday ordered the US Navy to destroy any Iranian boats caught laying mines. While CNN reports that the Pentagon is actively drawing up plans to strike Iranian SoH capabilities and individual Iranian military leaders if the ceasefire collapses. i.e., NOT a attitude consistent with an imminent deal!
Spot crude and product prices eased off the early-April highs on a combination of system rerouting and deal optimism. Both now weakening. Goldman estimates April Gulf output is reduced by 14.5 mbl/d, or 57% of pre-war supply, a number that keeps getting worse the longer this drags on.
Demand-side adaptation is ongoing: S. Korea has cut its Middle East crude dependence from 69% to 56% by pulling more from the Americas and Africa, and Japan is kicking off a second round of SPR releases from 1 May. But SPRs are finite.
Ref. to the negotiations, we should not bet on speed. The current Iranian leadership is dominated by genuine hardliners willing to absorb economic pain and run the clock to extract concessions. That is not a setup for a rapid resolution. US/Israeli media briefings keep framing the delay as ”internal Iranian divisions”, the reality is more complicated and points toward weeks and months, not days.
Our point is that the complexity is large, and higher prices have only just started (given a scenario where the negotiations drag out in time). The market spent April leaning on the USD 90/bl rest-of-year assumption; that case is diminishing by the hour. If ”early May reopening” is replaced by ”June, July or later” over the next week or two, both crude and products have meaningful room to reprice higher from here. There is a high risk being short energy and betting on any immediate political resolution(!).


Vattenfalls och Industrikrafts kärnkraftsbolag Videberg Kraft har valt Rolls-Royce SMR
Selling down on a ”deal”

Sommarväder skapar prisrally på elbörsen
Oil product price pain is set to rise as the Strait of Hormuz stays closed into summer

Solkraften pressar elpriserna dagtid
Oil product price pain is set to rise as the Strait of Hormuz stays closed into summer
Sommarväder skapar prisrally på elbörsen
Vattenfalls och Industrikrafts kärnkraftsbolag Videberg Kraft har valt Rolls-Royce SMR
Selling down on a ”deal”
-
Analys4 veckor sedan
Oil product price pain is set to rise as the Strait of Hormuz stays closed into summer
-
Nyheter2 veckor sedan
Sommarväder skapar prisrally på elbörsen
-
 Nyheter2 dagar sedan
Vattenfalls och Industrikrafts kärnkraftsbolag Videberg Kraft har valt Rolls-Royce SMR
-
Analys2 dagar sedan
Selling down on a ”deal”