

Analys
SEB Jordbruksprodukter, 11 mars 2013

 WASDE-rapporten i fredags ledde inte till några stora kursrörelser. Gammal skörd av vete handlas nu under majsen.
Odlingsväder
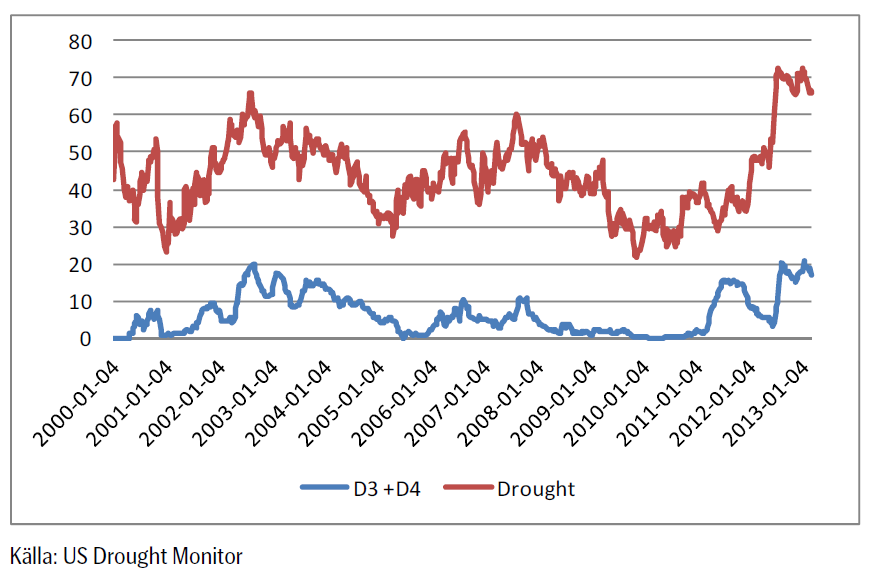
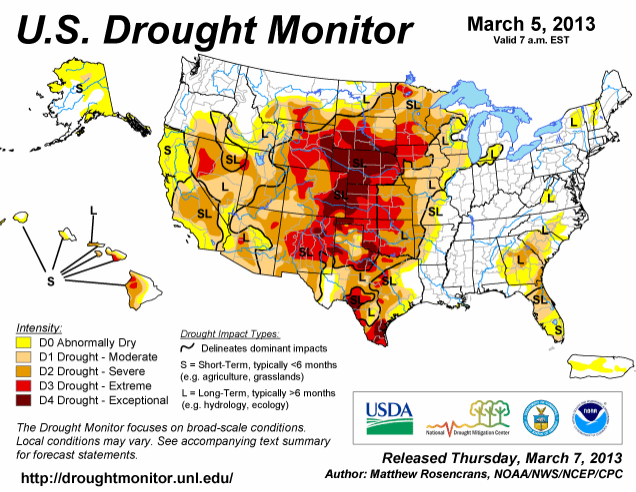
Trots att den allmänna uppfattningen är att torkan har avtagit i USA – det har ju regnat i Kansas – var torkan faktiskt något värre den senaste veckan, enligt US Drought Monitor. Ibland sägs det skämtsamt att nederbörden på La Salle Street är helt avgörande. Chicagobörsen ligger där.
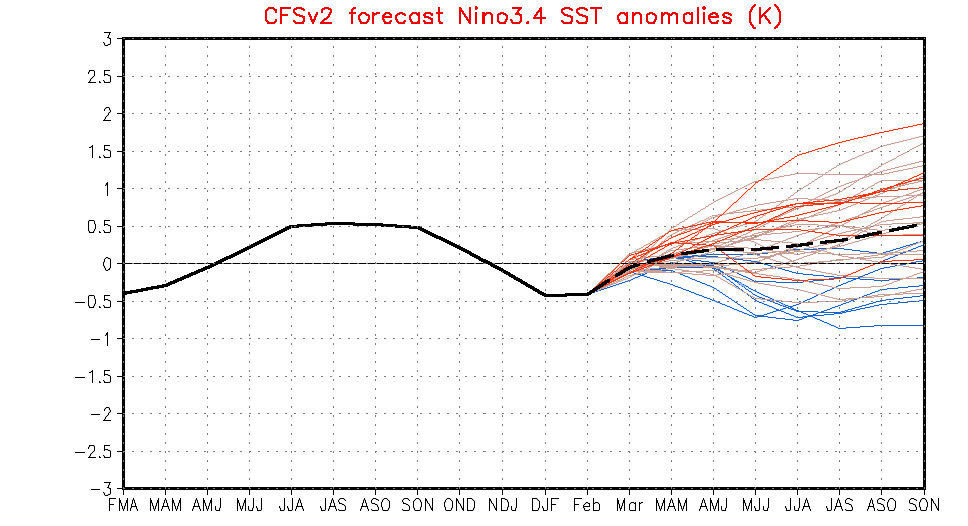
Ensembleprognosen för ENSO (El Niño / La Niña) väntas vara neutral under hela odlingssäsongen på norra halvklotet, enligt NOAA:s klimatmodell.
Vete
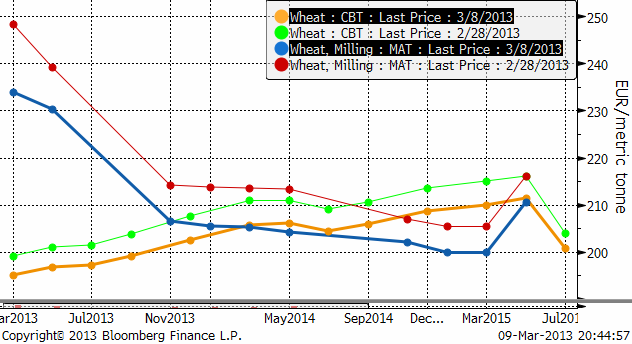
Priset på november (2013) kontraktet slutade 1% lägre än förra veckan, efter att ha börjat med ett kraftigt prisfall ner till 210 euro innan rekylen uppåt kom. 210 euro är ett tekniskt stöd. Bryts detta på uppsidan i veckan som kommer, är prisfallet från början av december troligen hejdat för ett tag framöver. Men det mest sannolika är att priset vänder ner igen för ett nytt test av 210-nivån.
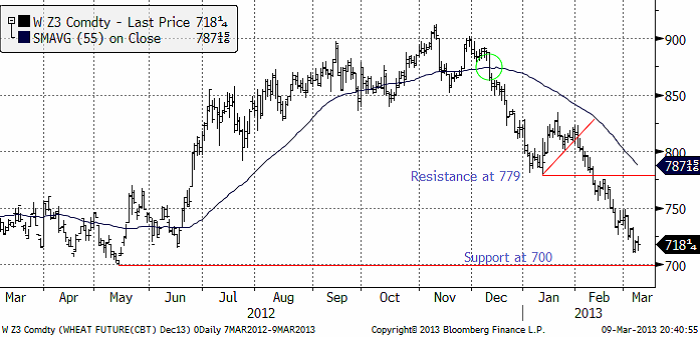
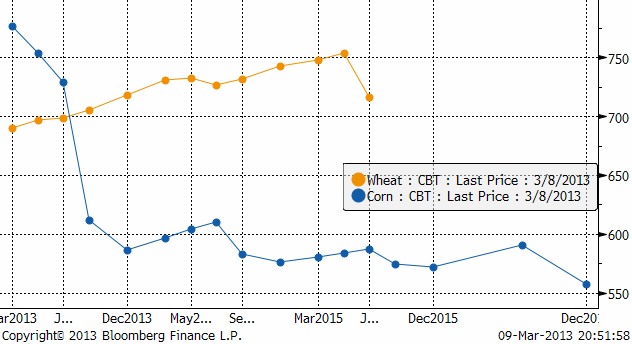
Nedan ser vi decemberkontraktet på CBOT, som inte lyckades rekylera upp lika mycket som Matif, efter att ha inlett veckan med prisfall. Det finns en gammal stödnivå på 755, som även fungerade i veckan som gick. Det finns också ett motstånd på 779 cent. Däremellan ligger nu marknaden. Frågan är vilket av stödet eller motståndet som ska brytas. Vi skulle gissa att stödet bryts, baserat på hur kursutvecklingen brukar bli när det är så här. Det finns i så fall potential för priset att falla ner mot 700 cent, eller strax däröver, det vill säga in i det prisintervall som vetet handlade i under förra våren.
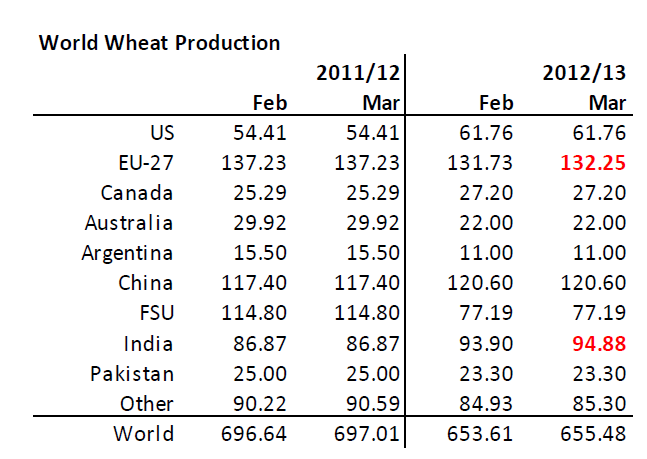
I fredags kväll publicerade det amerikanska jordbruksdepartementet USDA sin månatliga WASDE-rapport. Produktionen i år väntas nu bli 1.9 mt högre än tidigare. Uppjusteringarna gjordes för EU-27 (i Litauen med 500,000 ton) och i Indien. Indien har haft bra väder efter sommarens dåliga monsun. USDA borde kanske ha passat på att sänka Argentinas skörd med 1 mt, men gjorde det inte. Praktiskt taget ingen tror längre att skörden blir 11 mt i Argentina.
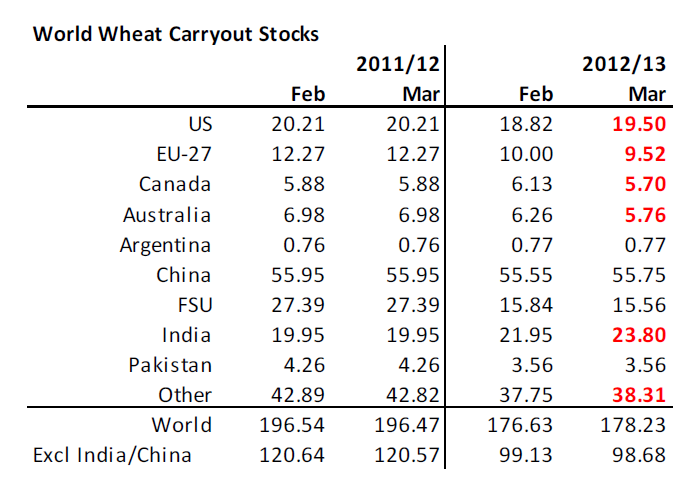
Nedan ser vi utgående lager. Högre utgående lager på global basis, framförallt i Indien, som man inte räknar med ska exportera det extra väntade tillskottet. Eftersom Indien och Kina är länder som har förhållandevis stora lager och som gärna av matsäkerhetsskäl håller stora lager, är det intressant att studera globala lager UTAN dessa länder. Då ser vi faktiskt att USDA räknar med LÄGRE lager, inte högre. Detta på grund av lägre lager i EU-27 (när man inte trodde det var möjligt), i Kanada och i Australien.
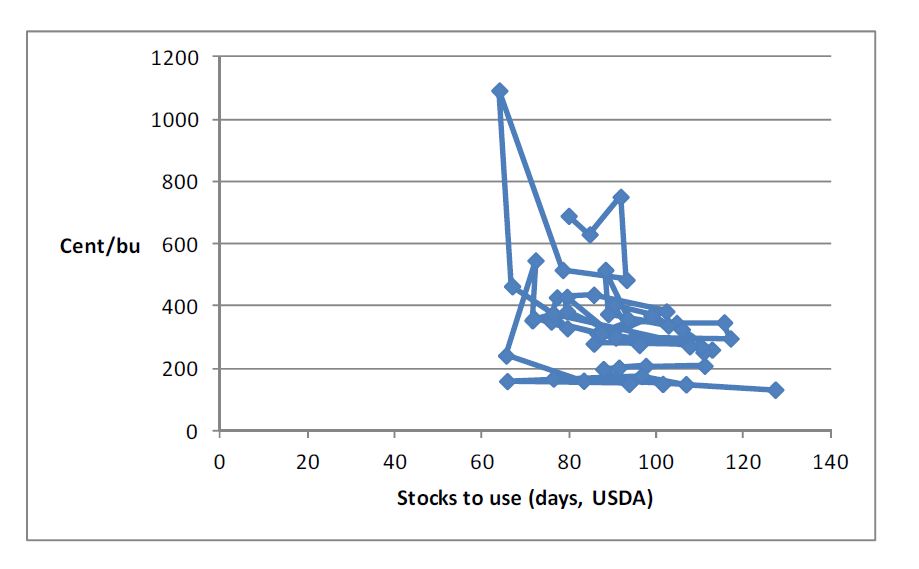
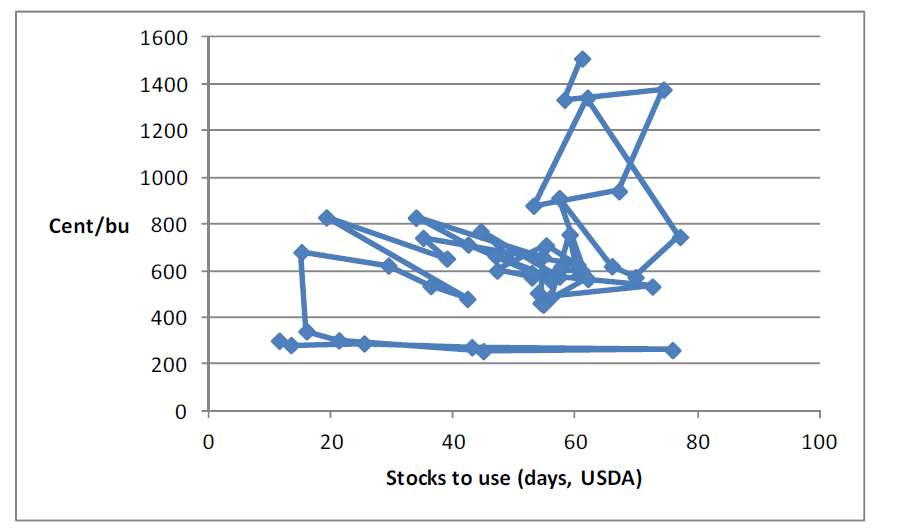
Marknaden tog rapporten, som det varit så mycket spanning inför, med en lättnadens suck. Det var inga stora förändringar. Priset föll något lite på rapporten. Nedan ser vi förhållandet mellan pris och lager sedan 1960; varje punkt är ett rapporttillfälle i mars, för varje år sedan dess. Fredagens rapport är den sista punkten, vid ca 700 cent. Vi ser att priset i förhållande till lager inte avviker från förhållandet de senaste åren. Vi måste dra slutsatsen att priset är rätt idag. Om något skulle priset faktiskt kunna vara lite högre, i synnerhet om vi betänker att Argentinas skörd inte kommer att bli 11 mt, i alla fall enligt argentinarna själva.
Ser vi till terminskurvorna för Matif och Chicago, ser vi att priserna har fallit över hela linjen.
Märkligt nog har vetepriset (för gammal skörd, maj, t ex) fallit så mycket att det blivit billigare än majs. Vi ser det i diagrammet nedan.
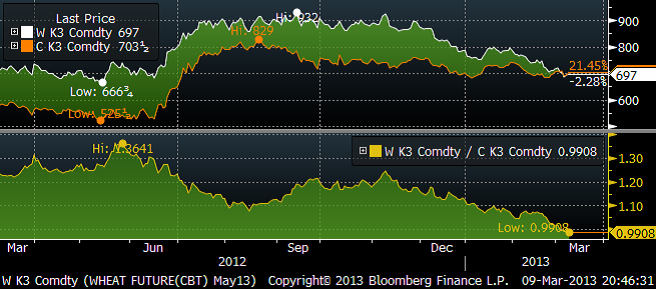
Det finns rapporter från USA att majs ersätts med vete i såväl två etanolfabriker som allmänt i foderblandningar. Detta gör att USDA:s foderefterfrågan i WASDE-rapporten kan vara helt underskattad. Nedan ser vi terminskurvorna för vete och majs. Notera att priserna för majs är omräknade från cent / 56 pund till cent / 60 bushels. När man handlar majsterminer på börsen handlar man dem i cent per bushel och en majs-bushel är 56 pund, medan en bushel vete är 60 pund. Maj-leverans för majs ligger alltså på 754 och vete på 697. Det är en jättestor skillnad när man dessutom betänker att vete innehåller betydligt mer värdefullt protein än majs.
I Brasilien har sådden av den andra skörden påbörjats nu. De senaste åren har sådden börjat i mars. Eftersom det har regnat en hel del, går sådden långsamt. Detta gynnar veteodlingen eftersom den kan sås senare än majs. I Paraná, som är tidigt ute, är 51% av arealen sådd. Där är 6% sådd med vete, hittills, men man kan förvänta sig att den andelen ökar med tiden.
Crop ratings i USA är fortsatt riktigt dåliga och man väntar sig en stor skörd av majs som ska reparera all brist i lagren. Vi tror att priset på vete ur fundamentalt perspektiv kan ha fallit för mycket de senaste månaderna och att priset borde vara högre, inte lägre. Momentum i marknaden är nedåtriktat, så prisfallet måste stanna av först. Sedan är det möjligt att en rekyl uppåt kan komma till stånd.
Maltkorn
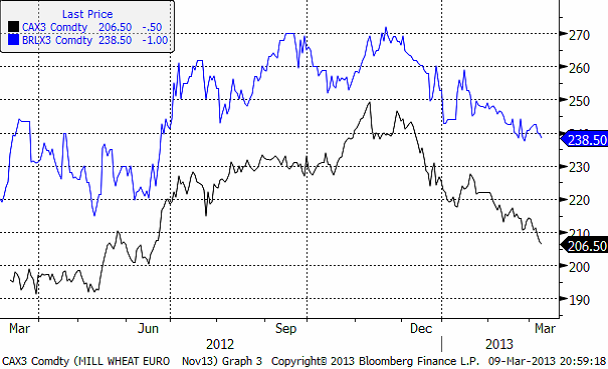
Priset på maltkorn med leverans i november har fallit i synk med prisfallet på kvarnvete, som vi ser i nedanstående diagram. Eftersom prisrörelserna är så synkroniserade är det många som prissäkrar via den mycket likvidare terminsmarknaden på kvarnvete än den tämligen illikvida och därmed riskablare marknaden för maltkorn.
Majs
Majspriset (december 2013) har sjunkit betydligt försiktigare än vetet. I förra veckobrevet, som kom för ungefär en månad sedan, skrev vi att vi trodde att priset skulle gå ner till ca 530 cent. Marknaden har ännu inte nått dit. Det tolkar vi som ett styrketecken. WASDE-rapporten något lägre produktion, främst i Argentina och Sydafrika. Argentinas skörd ligger fortfarande över vad konsensus är bland andra. Brasiliens skörd ligger å andra sidan på 72.5 mt. Conab i Brasilien estimerar 76 mt.
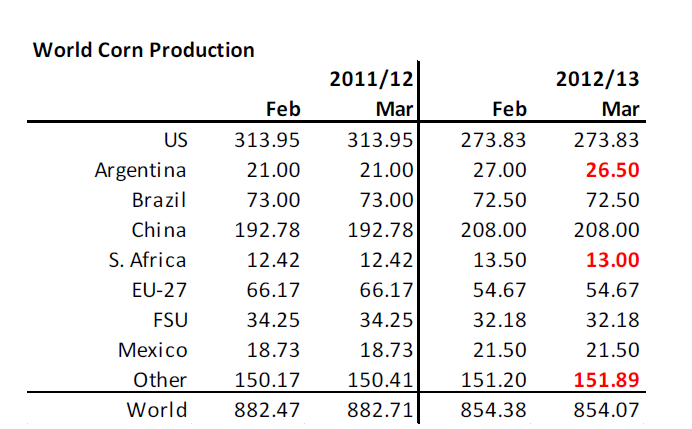
Nedan ser vi estimatet för utgående lager. Det är något lägre lager, framförallt i Brasilien (och där kan USDA ha fel med flera miljoner ton om Conab har rätt).
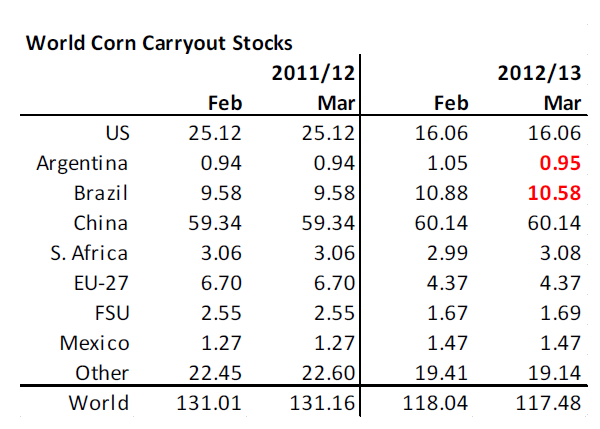
Pris i förhållande till lager är naturligtvis ”off the charts”, fast egentligen inte. Globala lager är så ansträngda att priset har potential att röra sig kraftigt såväl uppåt som nedåt. Som vi noterat ligger priset på majs för gammal skörd över priset för gammal skörd av vete. Efter skörd ska naturligtvis världens största rekordskörd tröskas i USA och därför är priserna mycket lägre.
Priserna i Sydamerika har hållit sig stabila. I Paraná hade 19% blivit skördat den 25 februari. För den andra skörden hade 51% blivit sått. I Rio Grande do Sul hade 45% av skörden blivit tröskad per den 28 februari enligt Emater, jordbruksbyrån i delstaten. Det är lite tidigare än förra årets 41%.
I Argentina har Bolsa de Rosario justerat ner skördeprognosen till 25.5 mt, vilket överensstämmer med Bolsa de Cereales, som tidigare förutspått 25 mt.
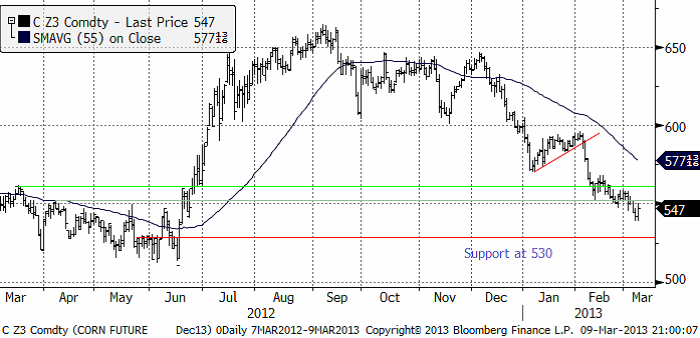
Nedan ser vi terminspriset (december). Vi ser att priset fallit ner till en nivå där det finns gott om tekniskt stöd. Vi tror att prisfallet är över och att priserna rör sig sidledes. Vädret i USA kommer att styra under våren.
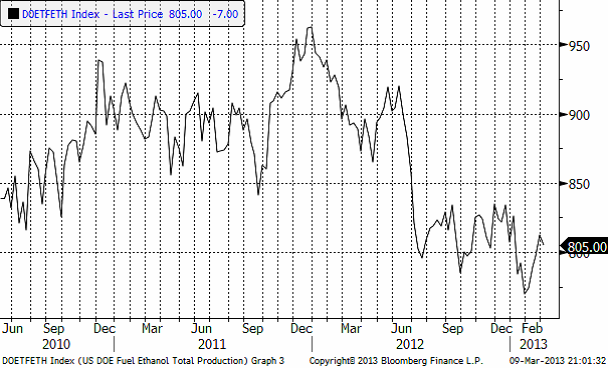
Veckovis etanolproduktion i USA ligger på samma nivå som efter sommaren, väl över de lägsta nivåerna under säsongen.
Vi har en neutral vy på majspriset och tror på sidledes rörelse när prisfallet nu torde ebba ut.
Sojabönor
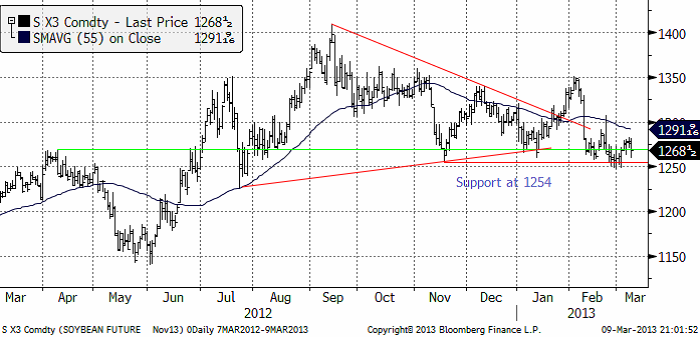
Sojabönorna (november 2013) har hållit stödet på 1254 cent per bushel. Den senaste tekniska signalen är dock faktiskt en säljsignal. Enligt den tekniska analysen borde vi få se en prisnedgång.
Den senaste veckan har styrkan i marknaden förklarats med fördröjning av lastningen av sojabönor i Brasilianska hamnar. Ny arbetslagstiftning i Brasilien som reglerar arbetstider och förhållanden för transport- och hamnarbetare har gjort att transportkostnaderna har ökat och lastningen gått långsammare. Vi har sett att det blivit en kö av fartyg utanför hamnarna som väntar på lastning. Detta har gjort att priset inne i landet har sjunkit eftersom priset där är exportpriset minus transportkostnad med följden att lantbrukarna väntar med att sälja sin vara. Hittills har ca 60% av sojaskörden sålts enligt CEPEA.
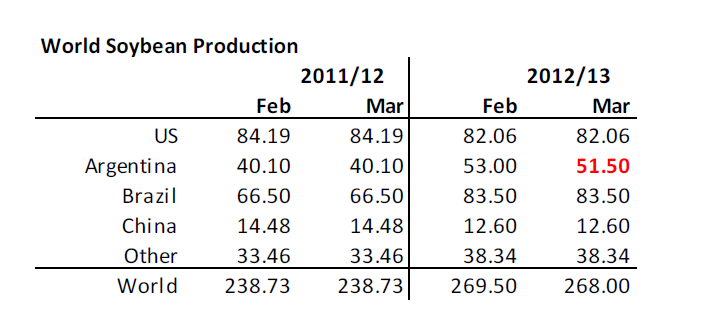
WASDE-rapporten visade på lägre global produktion, helt beroende på en nedjustering av Argentinas väntade skörd.
För att inte skicka “fel” signaler till marknaden, eller av någon annan anledning, justerade USDA också efterfrågan, i USA. Utgående lager är alltså oförändrade, som vi ser i nedanstående tabell.
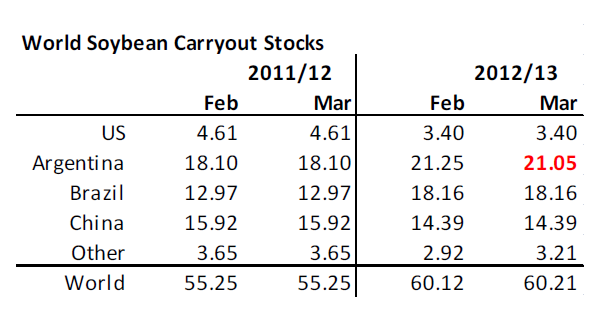
Nedan ser vi relationen mellan pris och utgående lager. Vi ser att priset om något ser ut att ligga högt.
I veckan som kommer får man hålla koll på om priset håller sig över det tekniska stödet vid 1254 eller om det bryts. Om det bryts vill vi vara korta sojabönor.
Raps
Rapspriset (november 2013) har fortsätt att röra sig ”sidledes”, såsom det gjort de tre senaste månaderna. Efter WASDE-rapporten och prisnedgången på sojabönor handlades även rapspriset ner.
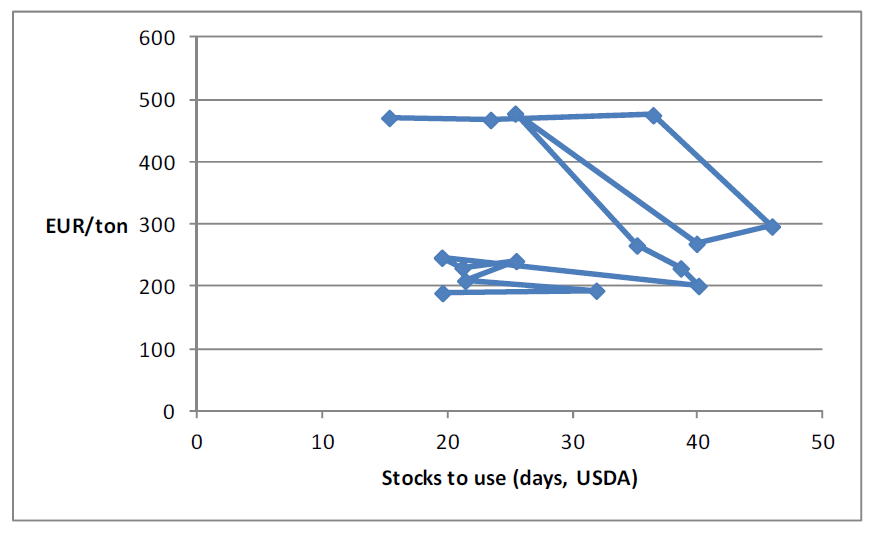
Rapsmarknaden har mindre utgående lager än sojabönorna. WASDE-rapporten anger utgående lager till motsvarande 15 dagars konsumtion. Det ska jämföras med förra årets 23 dagar. Som vi ser i diagrammet nedan väntar sig USDA mycket låga lager av rapsfrö som utgående lager nästa år i slutet av juni.
I förhållande till pris är relationen helt ur led, som vi ser i diagrammet nedan. Med så låga lager som USDA prognosticerar ligger priset för lågt. Det ”borde” ligga norr om 600 euro per ton.
Vi har haft en negativ vy på raps, men väljer nu att gå över till neutral rekommendation.
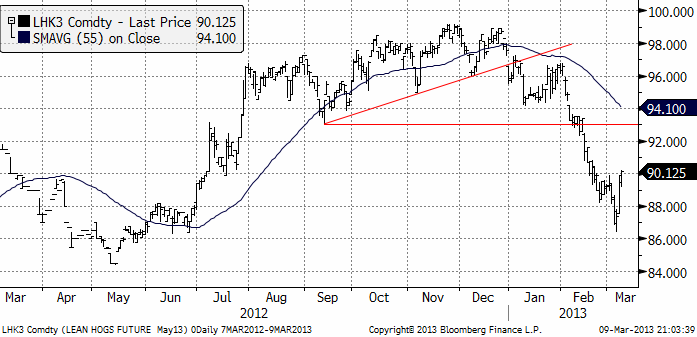
Gris
Grispriset (Maj 13) rekylerade upp kraftigt på rapporter om låga lager. Vi ser rekylen uppåt än så länge som en rekyl och inte som början på en trend uppåt.
Mjölk
Intresset för prissäkring av mjölk via terminer på mjölkprodukter är stort i Sverige. Ingen har än så länge gjort någon affär, men med tanke på hur fulla seminarierna är, är det sannolikt bara en tidsfråga innan den första anser sig förstå hur terminer fungerar och vilken nytta prissäkring kan ha för att hantera risk och för att tjäna pengar och den första affären görs.
SEB Commodities erbjuder ett litet ”prova-på” kontrakt som består av 0.5 ton Eurex-smör och 0.9 ton Eurex SMP. Ett paket som motsvarar 10 ton flytande mjölkråvara. Just nu är det underliggande värdet på ett sådant kontrakt drygt 33 000 kronor.
I kursdiagrammet nedan ser vi fyra kurvor, som förra veckan. Överst har vi smör i euro per ton, alla är i euro per ton. Den tunna röda linjen USDA:s notering för SMP i västra Europa. Den feta blå linjen är terminspriset på SMP på Eurex, som avser snittpriset på SMP i Tyskland, Holland och Frankrike. Den gröna linjen är Fonterras auktionspris på SMP.
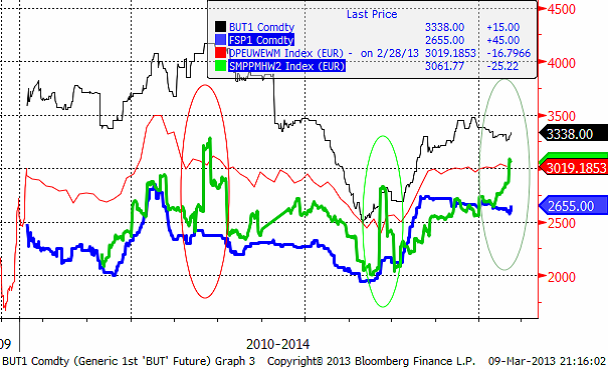
Det har uppmärksammats i mjölkbranschen i Sverige att Fonterra-priset har stigit kraftigt den senaste månaden. Den gröna kurvan pekar rakt uppåt. Vi ser dock inte alls någon sympati för denna hausse i de andra noteringarna. Jag misstror prisuppgången på Fonterra och tror inte att uppgången nu innehåller någon information alls om hur priset kommer att gå på andra mjölkmarknader. Det gör jag därför att vi har sett exakt samma avvikande beteende hos Fonterra-priset tidigare. I diagrammet ovan har jag ringat in de tre kursrusningar vi sett i Fonterrapriset och vi ser att det är Fonterrapriset som omotiverat stiger och därför faller tillbaka lika plötsligt som uppgången kom.
Jag vill hävda att den bästa indikatorn på rätt pris är Eurex-börsen. Den har dessutom den fördelen att vem som helst när som helst kan surfa in på Eurex och se vad priset är just vid det tillfället. Via länken kan man t ex se vad aktuellt pris är för terminer på SMP:
www.eurexchange.com/exchange-en/products/com/agr/14016/
På andra sidan Atlanten fortsätter mjölkpriset att falla, som vi ser nedan. Prisuppgången i mars månad kommer säkerligen att följas av prisfall. Det ser ut som om nedgången började i fredags och kommer att fortsätta i resten av veckan.
Vi har en klar säljrekommendation på mjölkterminer.
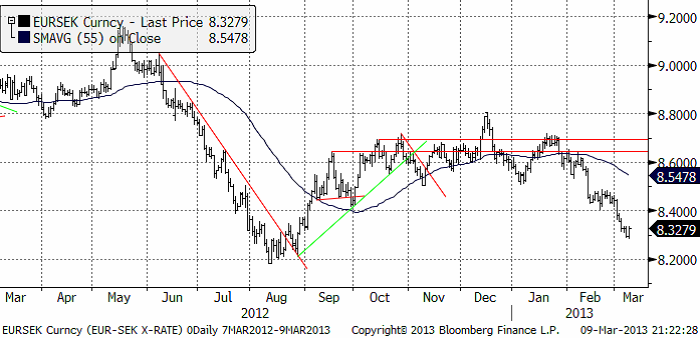
EURSEK
EURSEK faller. Eurokrisen har fått ny eld. 8.20 kr är nästa stöd.
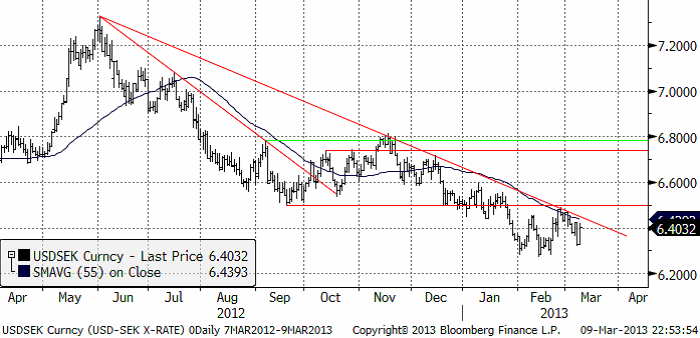
USDSEK
Dollarn håller sig stadigt under motståndslinjen i fallande trenden. Senast var priset uppe vid den och misslyckades med att bryta igenom, vilket brukar följas av nya kursfall.
[box]SEB Veckobrev Jordbruksprodukter är producerat av SEB Merchant Banking och publiceras i samarbete och med tillstånd på Råvarumarknaden.se[/box]
Disclaimer
The information in this document has been compiled by SEB Merchant Banking, a division within Skandinaviska Enskilda Banken AB (publ) (“SEB”).
Opinions contained in this report represent the bank’s present opinion only and are subject to change without notice. All information contained in this report has been compiled in good faith from sources believed to be reliable. However, no representation or warranty, expressed or implied, is made with respect to the completeness or accuracy of its contents and the information is not to be relied upon as authoritative. Anyone considering taking actions based upon the content of this document is urged to base his or her investment decisions upon such investigations as he or she deems necessary. This document is being provided as information only, and no specific actions are being solicited as a result of it; to the extent permitted by law, no liability whatsoever is accepted for any direct or consequential loss arising from use of this document or its contents.
About SEB
SEB is a public company incorporated in Stockholm, Sweden, with limited liability. It is a participant at major Nordic and other European Regulated Markets and Multilateral Trading Facilities (as well as some non-European equivalent markets) for trading in financial instruments, such as markets operated by NASDAQ OMX, NYSE Euronext, London Stock Exchange, Deutsche Börse, Swiss Exchanges, Turquoise and Chi-X. SEB is authorized and regulated by Finansinspektionen in Sweden; it is authorized and subject to limited regulation by the Financial Services Authority for the conduct of designated investment business in the UK, and is subject to the provisions of relevant regulators in all other jurisdictions where SEB conducts operations. SEB Merchant Banking. All rights reserved.

Wild moves yesterday. Brent crude traded to a high of $114.43/b and a low of $96.0/b and closed at $99.94/b yesterday.

US – Iran negotiations ongoing or not? What a day. Donald Trump announced that good talks were ongoing between Iran and the US and that the 48 hour deadline before bombing Iranian power plants and energy infrastructure was postponed by five days subject to success of ongoing meetings. Iranian media meanwhile stated that no meetings were ongoing at all.
Today we are scratching our heads trying to figure out what yesterday was all about.
Friends and family playing the market? Was it just Trump and his friends and family who were playing with oil and equity markets with $580m and $1.46bn in bets being placed by someone in oil and equity markets just 15 minutes before Trump’s announcement?
Was Trump pulling a TACO as he reached his political and economic pain point: Brent at $112/b, US Gas at $4/gal, SPX below 200dma and US 10yr above 4.4%?
Different Iranian factions with Trump talking with one of them? Are there real negotiations going on but with the US talking to one faction in Iran while another, the hardliners, are not involved and are denying any such negotiations going on?
Extending the ultimatum to attack and invade Kharg island next weekend? Or, is the five day delay of the deadline a tactical decision to allow US amphibious assault ships and marines to arrive in the Gulf in the upcoming weekend while US and Israeli continues to degrade Iranian military targets till then. And then next weekend a move by the US/Israel to attack and conquer for example the Kharg island?
We do not really know which it is or maybe a combination of these.
We did get some kind of TACO ydy. But markets have been waiting for some kind of TACO to happen and yesterday we got some kind of TACO. And Brent crude is now trading at $101.5/b as a result rather than at $112-114/b as it did no the high yesterday.
But what really matters in our view is the political situation on the ground in Iran. Will hardliners continue to hold power or will a more pragmatic faction gain power?
If the hardliners remain in power then oil pain should extend all the way to US midterm elections. The hardliners were apparently still in charge as of last week. Iran immediately retaliated and damaged LNG infrastructure in Qatar after Israel hit Iranian South Pars. The SoH was still closed and all messages coming out of Iran indicated defiance. Hardliners continues in power has a huge consequence for oil prices going forward. The regime has played its ’oil-weapon’ (closing or chocking the Strait of Hormuz). It is using it to achieve political goals. Deterrence: it needs to be so politically and economically expensive to attack Iran that it won’t happen again in the future. Or at least that the US/Israel thinks 10-times over before they attack again. The highest Brent crude oil closing price since the start of the war is $112.19/b last Friday. In comparison the 20-year inflation adjusted Brent price is $103/b. So Brent crude last Friday at $112.19/b isn’t a shockingly high price. And it is still far below the nominal high of $148/b from 2008 which is $220/b if inflation adjusted. So once in a lifetime Iran activates its most powerful weapon. The oil weapon. It needs to show the power of this weapon and it needs to reap political gains. Getting Brent to $112/b and intraday high of $119.5/b (9 March) isn’t a display of the power of that weapon. And it is not a deterrence against future attacks.
So if the hardliners remain in power in Iran, then the SoH will likely remain chocked all the way to US midterm elections and Brent crude will at a minimum go above the historical nominal high of $148/b from 2008.
Thus the outlook for the oil price for the rest of the year doesn’t depend all that much of whether Trump pulls a TACO or not. Stops bombing or not. It depends more on who is in charge in Iran. If it is the hardliners, then deterrence against future attacks via chocking of the SoH and high oil prices is the likely line of action. It is impacting the world but the Iranian ’oil-weapon’ is directed towards the US president and the the US midterm elections.
If a pragmatic faction gets to power in Iran, then a very prosperous future is possible. However, if power is shifting towards a more pragmatic faction in Iran then a completely different direction could evolve. Such a faction could possibly be open for cooperation with the US and the GCC and possibly put its issues versus Israel aside. Then the prosperity we have seen evolving in Dubai could be a possible future also for Iran.
So far it looks like the hardliners are fully in charge. As far as we can see, the hardliners are still fully in control in Iran. That points towards continued chocking of the SoH and oil prices ticking higher as global inventories (the oil market buffers) are drawn lower. And not just for a few more weeks, but possibly all the way to the US midterm elections.
A brief sigh of relief yesterday as oil infra at Kharg wasn’t damaged. But higher today. Brent crude dabbled around a bit yesterday in relief that oil infrastructure at Iran’s Kharg island wasn’t damaged. It traded briefly below the 100-line and in a range of $99.54 – 106.5/b. Its close was near the low at $100.21/b.
No easy victorious way out for Trump. So no end in sight yet. Brent is up 3.2% today to $103.4/b with no signs that the war will end anytime soon. Trump has no easy way to declare victory and mission accomplished as long as Iran is in full control of the Strait of Hormuz while also holding some 440 kg of uranium enriched to 60% and not far from weapons grade at 90%. As long as these two factors are unresolved it is difficult for Trump to pull out of the Middle East. Naturally he gets increasingly frustrated over the situation as the oil price and US retail gas prices keeps ticking higher while the US is tied into the mess in the Middle East. Trying to drag NATO members into his mess but not much luck there.
When commodity prices spike they spike 2x, 3x, 4x or 5x. Supply and demand for commodities are notoriously inflexible. When either of them shifts sharply, the the price can easily go to zero (April 2022) or multiply 2x, 3x, or even 5x of normal. Examples in case cobalt in 2025 where Kongo restricted supply and the price doubled. Global LNG in 2022 where the price went 5x normal for the full year average. Demand for tungsten in ammunition is up strongly along with full war in the middle east. And its price? Up 537%.
Why hasn’t the Brent crude oil price gone 2x, 3x, 4x or 5x versus its normal of $68/b given close to full stop in the flow of oil of the Strait of Hormuz? We are after all talking about close to 20% of global supply being disrupted. The reason is the buffers. It is fairly easy to store oil. Commercial operators only hold stocks for logistical variations. It is a lot of oil in commercial stocks, but that is predominantly because the whole oil system is so huge. In addition we have Strategic Petroleum Reserves (SPRs) of close to 2500 mb of crude and 1000 mb of oil products. The IEA last week decided to release 400 mb from global SPR. Equal to 20 days of full closure of the Strait of Hormuz. Thus oil in commercial stocks on land, commercial oil in transit at sea and release of oil from SPRs is currently buffering the situation.
But we are running the buffers down day by day. As a result we see gradually increasing stress here and there in the global oil market. Asia is feeling the pinch the most. It has very low self sufficiency of oil and most of the exports from the Gulf normally head to Asia. Availability of propane and butane many places in India (LPG) has dried up very quickly. Local prices have tripled as a result. Local availability of crude, bunker oil, fuel oil, jet fuel, naphtha and other oil products is quickly running down to critical levels many places in Asia with prices shooting up. Oman crude oil is marked at $153/b. Jet fuel in Singapore is marked at $191/b.
Oil at sea originating from Strait of Hormuz from before 28 Feb is rapidly emptied. Oil at sea is a large pool of commercial oil. An inventory of oil in constant move. If we assume that the average journey from the Persian Gulf to its destinations has a volume weighted average of 13.5 days then the amount of oil at sea originating from the Persian Gulf when the the US/Israel attacked on 28 Feb was 13.5 days * 20 mb/d = 269 mb. Since the strait closed, this oil has increasingly been delivered at its destinations. Those closest to the Strait, like Pakistan, felt the emptying of this supply chain the fastest. Propane prices shooting to 3x normal there already last week and restaurants serving cold food this week is a result of that. Some 50-60% of Asia’s imports of Naphtha normally originates from the Persian Gulf. So naphtha is a natural pain point for Asia. The Gulf also a large and important exporter of Jet fuel. That shut in has lifted jet prices above $200/b.
To simplify our calculations we assume that no oil has left the Strait since that date and that there is no increase in Saudi exports from Yanbu. Then the draining of this inventory at sea originated from the Persian Gulf will essentially look like this:
The supply chain of oil at sea originating from the Strait of Hormuz is soon empty. Except for oil allowed through the Strait of Hormuz by Iran and increased exports from Yanbu in the Red Sea. Not included here.

Oil at sea is falling fast as oil is delivered without any new refill in the Persian Gulf. Waivers for Russian crude is also shifting Russian crude to consumers. Brent crude will likely start to feel the pinch much more forcefully when oil at sea is drawn down another 200 mb to around 1000 mb. That is not much more than 10 days from here.

Oil and oil products are starting to become very pricy many places. Brent crude has still been shielded from spiking like the others.

Closing at highest since Aug 2022. Brent crude gained 9.2% yesterday. The trading range was limited to $95.2 – 101.85/b with a close at $100.46/b and higher than the Monday close of $98.96/b. Ydy close was the highest close since August 2022. This morning Brent is up 2% to $102.4/b and is trading at the highest intraday level since Monday when it high an intraday high of $119.5/b.
A military hit at Iran’s Kharg island would be a big, big bang for the oil price. The big, big risk for the weekend is that oil infrastructure could be damaged. For example Iran’s Kharg island which is Iran’s major oil export hub. If damaged we would have a longer lasting loss of supply stretching way beyond Trump’s announced ”two more weeks”. It will make the spot price spike higher and it will lift the curve. Brent crude 2027 swap would jump above $80/b immediately. An attack on Kharg island would naturally lead Iran to strike back at other oil infrastructures in the Gulf. Especially those belonging to countries who harbor US military bases. I.e. countries who essentially are supporting the attack by US and Israel towards Iran. Though if not in spirit, then in practical operational terms. An attack on Kharg island would not just lead to a lasting outage of supply from Iran until it would be repaired. It would immediately endanger other oil infrastructure in the region as well and additional lasting loss of supply.
No one in their right mind would dare to sit short oil over the coming weekend. Oil is thus set to close the week at a very strong note today.
Prepare for another 400 mb SPR release next week. This week’s announcement of a 400 mb release from Strategic Oil Reserves totally underwhelmed the market with the oil price going higher rather than lower following the announcement. For one it means that the market expects the war and the closure of the Strait of Hormuz to last longer than Trump’s recent announced ”two more weeks”. 400 mb only amounts to 20 days of lost supply to the world through Hormuz and we are already at day 14. So next week when we are getting close to the 20 day mark, we are likely to see another announcement of another 400 mb release of SPR stocks to the market. Preparing for the next 20 days of war.
Global oil logistics in total disarray. We have previously addressed the issue of the huge logistical web of the global oil market which is now in total disarray. The logistical disruption started to fry the oil market at the end of last week. Helped to spike the oil market on Monday. What we hear from our shipping clients is that the problems with supply of fuels locally in Korea, Singapore, India and Africa are getting worse with physical availability of fuels there drying up. It is getting increasingly difficult to find physical supply of bunker oil with local, physical prices shooting way higher than financial benchmarks. To the point that biofuels have become the cheap option many places. Availability of fuels in the US is still good. Not so surprising as the US is self-sufficient with crude and refineries.
The disruption in global oil logistics doesn’t seem to improve. Rather the opposite. If you cannot get fuel to run your ships, then how can you distribute fuels to where it is needed.
Buy Brent Dec-2026 calls with strike $150/b!! As the days goes by the oil price is ticking higher while Trump is getting one day closer to US midterm elections. Trump was betting that he could put this war to bead well before November. But that will probably not be up to him to decide. It will be up to Iran to decide when to reopen the Strait of Hormuz. It is very hard to imagine that Iran will let Trump easily off the hock after he has killed its Supreme Leader. This will likely go all the way to November. Buy Brent Dec-2026 calls with strike $150/b!!
Brent closed at highest since 2022 ydy. Will end this Friday at a very strong note! Consumers still dreaming of $60/b oil


Christian Kopfer om läget för oljan

Marknaden måste börja betrakta de höga kopparpriserna som det nya normala

Det fysiska spotpriset på brentolja har slagit nytt rekord

40 minuter med Javier Blas om hur världen verkligen påverkas av energikrisen

Efter tillväxten: Guldbrev satsar på expansion i Europa
40 minuter med Javier Blas om hur världen verkligen påverkas av energikrisen

Elpriserna fördubblas, stor osäkerhet inför sommaren

MP Materials, USA:s svar på Kinas dominans över sällsynta jordartsmetaller
Det fysiska spotpriset på brentolja har slagit nytt rekord

Studsvik har idag ansökt om att få bygga 1200-1600 MW kärnkraft i Valdemarsvik
-
 Nyheter2 veckor sedan
40 minuter med Javier Blas om hur världen verkligen påverkas av energikrisen
-
 Nyheter3 veckor sedan
Elpriserna fördubblas, stor osäkerhet inför sommaren
-
 Nyheter4 veckor sedan
MP Materials, USA:s svar på Kinas dominans över sällsynta jordartsmetaller
-
 Nyheter2 veckor sedan
Det fysiska spotpriset på brentolja har slagit nytt rekord
-
 Nyheter4 veckor sedan
Studsvik har idag ansökt om att få bygga 1200-1600 MW kärnkraft i Valdemarsvik
-
 Nyheter2 veckor sedan
Marknaden måste börja betrakta de höga kopparpriserna som det nya normala
-

 Nyheter4 veckor sedan
Matproduktion är beroende av gödsel, Gulfkriget skapar brist
-
Analys4 veckor sedan
TACO (or Whatever It Was) Sends Oil Lower — Iran Keeps Choking Hormuz