

Analys
SHB Råvarubrevet 8 mars 2013

 Råvaror allmänt
Råvaruraset planar ut
Efter en period av negativa överraskningar i världsekonomin börjar den amerikanska industrisektorn se ljusare ut. Överraskningsindex i USA brukar normalt skena söderut efter att ekonomer blivit överoptimistiska efter en tid med allt bättre data. Så är det inte denna gången och mönstret liknar mest 2010. Då som nu huvudsakligen drivet av en urstark börs. Hursomhelst nalkas budgetåtstramningar när USA trillar ner för budgetstupet och i Europa tilltar oron efter det oklara politiska läget i Italien. Under förra veckan kulminerade de kraftiga negativa reaktionerna på kinesiska myndigheters ambition att dämpa prisuppgången på fastigheter. Byggbolagen på Shanghaibörsen hade det kraftigaste raset på en dag sedan finanskrisen och råvarumarknaden prisade in lägre efterfrågan till byggsektorn i framför allt basmetaller.
Återigen har det visat sig hur viktigt sentimentet är i Kina för råvarornas utveckling. Under denna vecka har de nya ledarna tillträtt och i talet som avgående premiärministern Wen Jiabao höll så kan man efter 30 sidors självberömmelse åt det kinesiska kommunistpartiet utläsa att tillväxtmålet för 2013 ligger kvar på 7,5 %. Detta var en positiv signal för marknaden och fick Shanghaibörsen att vända uppåt.
Basmetallerna
Fortsatt svajigt för basmetallerna
Basmetaller fortsätter svaja omkring i tekniska intervall, något starkare i början av veckan då Fed:s Yellen var duvaktig och fick ner dollarn något samtidigt som bättre signaler från Kina kom med ett bibehållet tillväxtmål. Skarpt stigande lager för basmetallerna väger i den negativa vågskålen och dämpar alla tendenser till rally.
Under första veckan i mars är zink och aluminium de basmetaller som fortsatt vara svaga medan nickel och koppar visat på svag styrka. Under de senaste tre månaderna har lagren för koppar klättrat till toppnivåerna efter finanskrisen. Vi tror att basmetallerna kommer konsolideras för att söka ny riktning efter senaste raset under februari.
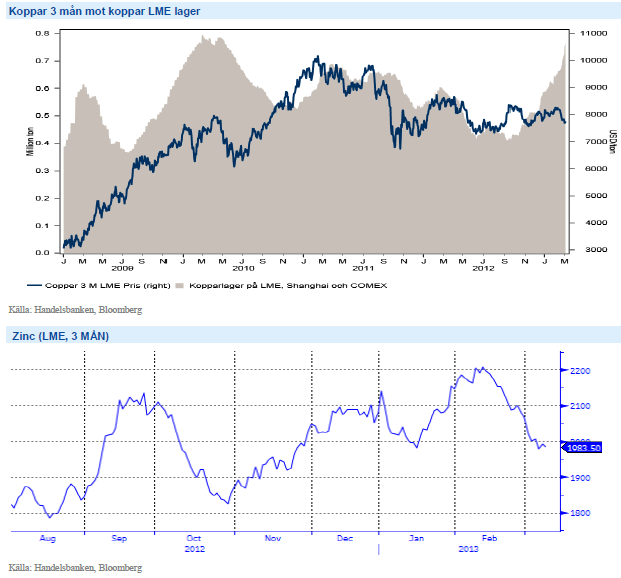
Trots nedgången under veckan tror vi på högre priser på basmetaller och ser istället möjlighet till ”buy on dip”. Vi tror på: BASMET H
Ädelmetaller
Guru eller dödskors; ska guldet bli till sand?
Under veckan som gått har vi kunnat läsa om en guru (okänd för oss) som hävdar att ingen tror på guldpriset, och därför är guld köpvärt. Även vårt eget inlägg om den tekniska signalen ”dödskorset” har blivit flitigt citerat. Dödskorset ska teoretiskt indikera en prisnedgång i antågande. Ytterligare en musikalisk referens poppar upp; Vem ska jag tro på?
Om vi börjar med guru-resonemanget, d.v.s. ingen tror på guldet, alltså ska det stiga (minsta motståndets lag). Detta gäller ENBART om ”allas” positioner reflekterar den rådande vyn, det är alltför förenklande att bara lyssna på folks åsikter för att avgöra vad som är den ”motsatta” vyn (the contrarian). Det vi ser i våra flöden indikerar inte alls att folk sålt ut sitt guld. Att vara contrarian just nu är kanske inte att tro på en nedgång, utan kanske att tro på en riktigt rejäl nedgång? Vad är rätt värde på guld? Det vi vet när det gäller guld är att ingen ”behöver” guld på samma sätt som vi behöver olja, koppar, spannmål och så vidare, utan vi har guld som en värdebevarare. Det innebär att värdet sätts enligt principen ”tavelvärdering”, dvs. värdet är vad nästa köpare är beredd att betala. Om alla skulle bestämma sig för att det inte är värt dagens pris, då finns det inget ”golv” för priset på det sätt som det finns i andra råvaror, där det oftast utgörs av marginalkostnaden för ny produktion. Så, hur långt kan det falla om det börjar falla på riktigt? Vi vet inte, men det värt att påminna om att för tio år sedan kostade ett uns drygt 300 dollar, idag kostar det strax under 1 600 dollar. Och guldet är likadant idag som då, och allt guld som utvunnits sedan dess finns fortfarande. Vilket för övrigt gäller allt guld som någonsin utvunnits.
Februari månad hade det största utflödet ur ETF guld sedan det populära fenomen att investera i guld via börshandlade fonder startade för ca 10 år sedan. Vi vände vår förut positiva syn på guld till negativ i början av februari. Det finns flera argument för att vi inte längre tror på högre guldpriser. Sammanfattningsvis kan man säga att de alla går under temat att investerare nu söker ”tillväxt före likviditet”.
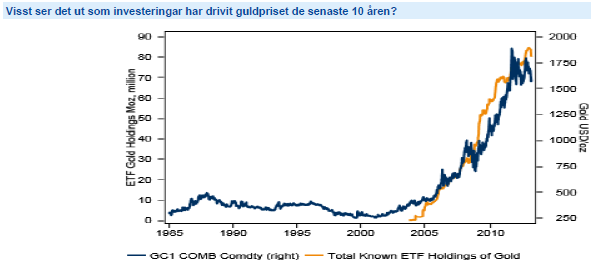
Starkare dollar och högre räntor blir utmanande för guldet samtidigt som inflationen väntas vara låg under året. Vi tror på: GULD S H
Energi
Ökad politisk risk på oljemarknaden
Under veckan gick Venezuelas president Chavez bort och även om det inte hade någon omedelbar effekt på oljepriset så ökar det den politiska risken på oljemarknaden. Den starke ledaren lämnar ett politiskt vakuum efter sig som adderar svag riskpremie i oljepriset. Ett läckage på Cormorant Alpha plattformen i Nordsjön har tvingat pipelines ur funktion och drivit på brentoljan. Andra faktorer som gett stöd åt oljepriset i veckan är att Kinas tillväxtmål för 2013 ligger kvar på 7,5 % men också en förbättring i den amerikanska ekonomin. För övrigt inga större rörelser på oljepriset den senaste veckan. Vi kan notera data om ökade lager på råoljan med 3,8m fat (väntat + 0,53m fat), minskade destillatlager med 3,8m fat (väntat – 0,9m fat) samt minskade bensinlager med 0,6m fat (väntat – 0.7m fat).
Stilla på elmarknaden även denna vecka där kontraktet Q2 2013 handlas upp 0.4 procent. Vikande kol och utsläppsrätter balanseras av torrare och kallare väderprognoser. Efter en period med 1.5TWh nederbörd över normalt i Norden ser det åter lite värre ut för den totala energibalansen som p.g.a. ett högtrycksbetonat väder nu förväntas landa på ca -15,7 TWh mot slutet av nästa vecka, vilket kan ge bra skjuts till elpriset. Vi ligger kvar med en neutral syn. I övrigt rullar vi idag över från Q2 till Q3 kontraktet i SHB Power Index.
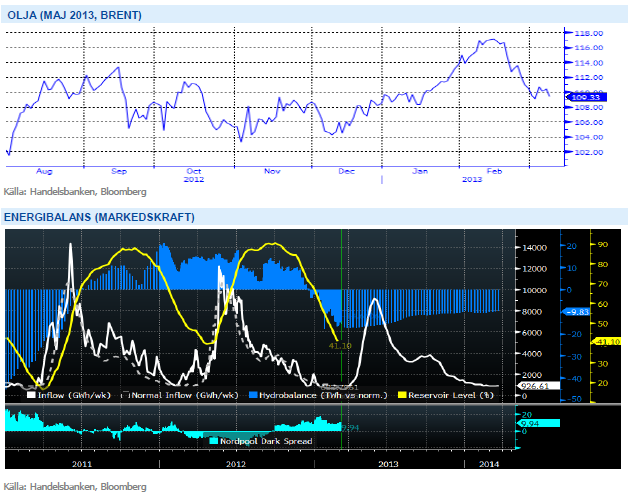
Den råvarugrupp som är mest beroende av den globala konjunkturen är Energi och med en starkare konjunktur ser vi positivt på utvecklingen för denna sektor. Vi tror på: ENERGI H
Livsmedel
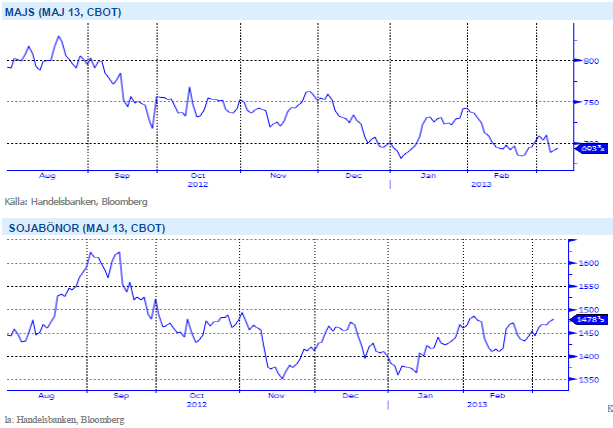
Stark export ger stöd åt sojabönor
Priserna på majs i Chicago har gått ned under veckan, även denna vecka delvis som följd av att nederbörd förbättrat förutsättningen för pågående/kommande majssådd i USA. En del regioner vill fortfarande ha mycket mer nederbörd men helt klart är oron nu mindre än för några veckor sedan. Även i Argentina har väderleken förbättrats och det talas nu allt mindre om oro för torrt väder. Inga större förändringar väntas i morgondagens WASDE-rapport från USDA – amerikanska majslager beräknas justeras upp marginellt som följd av fortsatt låg exporttakt och globala lager spås istället bli något nedjusterade.
Priserna på sojabönor i Chicago noteras upp något sedan förra veckan, delvis fortsatt påverkat av stark amerikansk export. I Brasilien fortsätter skörden utan större problem. I bland annat regionerna Bahia och Mato Grosso Do Sul är avkastningen lite lägre än väntat och produktionsnivån för Sydamerika bör justeras ned i dagens WASDE-rapport. Rapporten bör även innehålla nedjusterade lagersiffror för USA som följd av den alltjämt starka exporten. Stark efterfrågan och låga lagernivåer ger stöd och på kort sikt är det svårt att se en nedsida för sojan. Faller USDA:s prognos väl in för årets skörd i USA lär vi dock få se klart lägre priser längre fram på året, grödan ska dock först sås och mycket kan hända innan skörd.
Vi behåller vår negativa syn för soja, majs och vete, trots riskerna för torrt väder i USA. Normal väderlek bör ge press på spannmålspriserna. Vi tror på: LIVSMEDEL S H
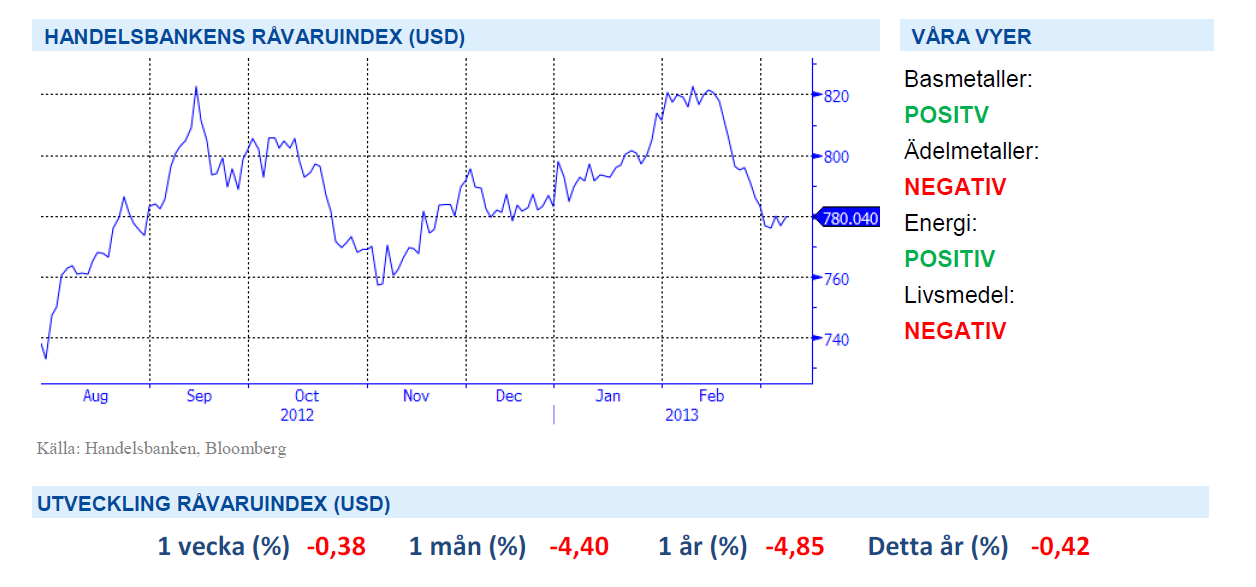
Handelsbankens Råvaruindex
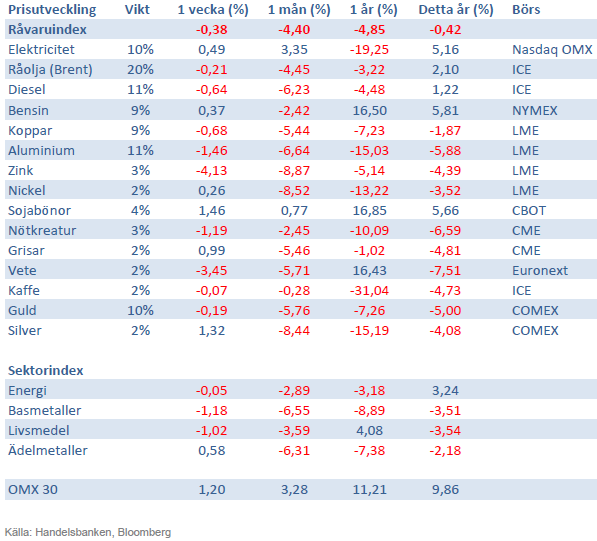
Handelsbankens råvaruindex består av de underliggande indexen för respektive råvara. Vikterna är bestämda till hälften från värdet av global produktion och till hälften från likviditeten i terminskontrakten.
[box]SHB Råvarubrevet är producerat av Handelsbanken och publiceras i samarbete och med tillstånd på Råvarumarknaden.se[/box]
Ansvarsbegränsning
Detta material är producerat av Svenska Handelsbanken AB (publ) i fortsättningen kallad Handelsbanken. De som arbetar med innehållet är inte analytiker och materialet är inte oberoende investeringsanalys. Innehållet är uteslutande avsett för kunder i Sverige. Syftet är att ge en allmän information till Handelsbankens kunder och utgör inte ett personligt investeringsråd eller en personlig rekommendation. Informationen ska inte ensamt utgöra underlag för investeringsbeslut. Kunder bör inhämta råd från sina rådgivare och basera sina investeringsbeslut utifrån egen erfarenhet.
Informationen i materialet kan ändras och också avvika från de åsikter som uttrycks i oberoende investeringsanalyser från Handelsbanken. Informationen grundar sig på allmänt tillgänglig information och är hämtad från källor som bedöms som tillförlitliga, men riktigheten kan inte garanteras och informationen kan vara ofullständig eller nedkortad. Ingen del av förslaget får reproduceras eller distribueras till någon annan person utan att Handelsbanken dessförinnan lämnat sitt skriftliga medgivande. Handelsbanken ansvarar inte för att materialet används på ett sätt som strider mot förbudet mot vidarebefordran eller offentliggörs i strid med bankens regler.


When it starts to move lower it moves rather quickly. Gaza, China, IEA. Brent crude is down 2.1% today to $62/b after having traded as high as $66.58/b last Thursday and above $70/b in late September. The sell-off follows the truce/peace in Gaze, a flareup in US-China trade and yet another bearish oil outlook from the IEA.

A lasting peace in Gaze could drive crude oil at sea to onshore stocks. A lasting peace in Gaza would probably calm down the Houthis and thus allow more normal shipments of crude oil to sail through the Suez Canal, the Red Sea and out through the Bab-el-Mandeb Strait. Crude oil at sea has risen from 48 mb in April to now 91 mb versus a pre-Covid normal of about 50-60 mb. The rise to 91 mb is probably the result of crude sailing around Africa to be shot to pieces by the Houthis. If sailings were to normalize through the Suez Canal, then it could free up some 40 mb in transit at sea moving onshore into stocks.
The US-China trade conflict is of course bearish for demand if it continues.
Bearish IEA yet again. Getting closer to 2026. Credibility rises. We expect OPEC to cut end of 2025. The bearish monthly report from the IEA is what it is, but the closer we get to 2026, the more likely the IEA is of being ball-park right in its outlook. In its monthly report today the IEA estimates that the need for crude oil from OPEC in 2026 will be 25.4 mb/d versus production by the group in September of 29.1 mb/d. The group thus needs to do some serious cutting at the end of 2025 if it wants to keep the market balanced and avoid inventories from skyrocketing. Given that IEA is correct that is. We do however expect OPEC to implement cuts to avoid a large increase in inventories in Q1-26. The group will probably revert to cuts either at its early December meeting when they discuss production for January or in early January when they discuss production for February. The oil price will likely head yet lower until the group reverts to cuts.
Dubai: The Mid-East anchor dragging crude oil lower. Surplus emerging in Mid-East pricing. Crude oil prices held surprisingly strong all through the summer. A sign and a key source of that strength came from the strength in the front-end backwardation of the Dubai crude oil curve. It held out strong from mid-June and all until late September with an average 1-3mth time-spread premium of $1.8/b from mid-June to end of September. The 1-3mth time-spreads for Brent and WTI however were in steady deterioration from late June while their flat prices probably were held up by the strength coming from the Persian Gulf. Then in late September the strength in the Dubai curve suddenly collapsed. Since the start of October it has been weaker than both the Brent and the WTI curves. The Dubai 1-3mth time-spread now only stands at $0.25/b. The Middle East is now exporting more as it is producing more and also consuming less following elevated summer crude burn for power (Aircon) etc.
The only bear-element missing is a sudden and solid rise in OECD stocks. The only thing that is missing for the bear-case everyone have been waiting for is a solid, visible rise in OECD stocks in general and US oil stocks specifically. So watch out for US API indications tomorrow and official US oil inventories on Thursday.
No sign of any kind of fire-sale of oil from Saudi Arabia yet. To what we can see, Saudi Arabia is not at all struggling to sell its oil. It only lowered its Official Selling Prices (OSPs) to Asia marginally for November. A surplus market + Saudi determination to sell its oil to the market would normally lead to a sharp lowering of Saudi OSPs to Asia. Not yet at least and not for November.
The 5yr contract close to fixed at $68/b. Of importance with respect to how far down oil can/will go. When the oil market moves into a surplus then the spot price starts to trade in a large discount to the 5yr contract. Typically $10-15/b below the 5yr contract on average in bear-years (2009, 2015, 2016, 2020). But the 5yr contract is usually pulled lower as well thus making this approach a moving target. But the 5yr contract price has now been rock solidly been pegged to $68/b since 2022. And in the 2022 bull-year (Brent spot average $99/b), the 5yr contract only went to $72/b on average. If we assume that the same goes for the downside and that 2026 is a bear-year then the 5yr goes to $64/b while the spot is trading at a $10-15/b discount to that. That would imply an average spot price next year of $49-54/b. But that is if OPEC doesn’t revert to cuts and instead keeps production flowing. We think OPEC(+) will trim/cut production as needed into 2026 to prevent a huge build-up in global oil stocks and a crash in prices. But for now we are still heading lower. Into the $50ies/b.
Some rebound but not much. Brent crude rebounded 1.5% yesterday to $65.47/b. This morning it is inching 0.2% up to $65.6/b. The lowest close last week was on Thursday at $64.11/b.
The curve structure is almost as week as it was before the weekend. The rebound we now have gotten post the message from OPEC+ over the weekend is to a large degree a rebound along the curve rather than much strengthening at the front-end of the curve. That part of the curve structure is almost as weak as it was last Thursday.
We are still on a weakening path. The message from OPEC+ over the weekend was we are still on a weakening path with rising supply from the group. It is just not as rapidly weakening as was feared ahead of the weekend when a quota hike of 500 kb/d/mth for November was discussed.
The Brent curve is on its way to full contango with Brent dipping into the $50ies/b. Thus the ongoing weakening we have had in the crude curve since the start of the year, and especially since early June, will continue until the Brent crude oil forward curve is in full contango along with visibly rising US and OECD oil inventories. The front-month Brent contract will then flip down towards the $60/b-line and below into the $50ies/b.
At what point will OPEC+ turn to cuts? The big question then becomes: When will OPEC+ turn around to make some cuts? At what (price) point will they choose to stabilize the market? Because for sure they will. Higher oil inventories, some more shedding of drilling rigs in US shale and Brent into the 50ies somewhere is probably where the group will step in.
There is nothing we have seen from the group so far which indicates that they will close their eyes, let the world drown in oil and the oil price crash to $40/b or below.
The message from OPEC+ is also about balance and stability. The world won’t drown in oil in 2026. The message from the group as far as we manage to interpret it is twofold: 1) Taking back market share which requires a lower price for non-OPEC+ to back off a bit, and 2) Oil market stability and balance. It is not just about 1. Thus fretting about how we are all going to drown in oil in 2026 is totally off the mark by just focusing on point 1.
When to buy cal 2026? Before Christmas when Brent hits $55/b and before OPEC+ holds its last meeting of the year which is likely to be in early December.
Brent crude oil prices have rebounded a bit along the forward curve. Not much strengthening in the structure of the curve. The front-end backwardation is not much stronger today than on its weakest level so far this year which was on Thursday last week.

The front-end backwardation fell to its weakest level so far this year on Thursday last week. A slight pickup yesterday and today, but still very close to the weakest year to date. More oil from OPEC+ in the coming months and softer demand and rising inventories. We are heading for yet softer levels.

Down to the lowest since early May. Brent crude has fallen sharply the latest four days. It closed at USD 64.11/b yesterday which is the lowest since early May. It is staging a 1.3% rebound this morning along with gains in both equities and industrial metals with an added touch of support from a softer USD on top.
What stands out the most to us this week is the collapse in the Dubai one to three months time-spread.
Dubai is medium sour crude. OPEC+ is in general medium sour crude production. Asian refineries are predominantly designed to process medium sour crude. So Dubai is the real measure of the balance between OPEC+ holding back or not versus Asian oil demand for consumption and stock building.
A sharp weakening of the front-end of the Dubai curve. The front-end of the Dubai crude curve has been holding out very solidly throughout this summer while the front-end of the Brent and WTI curves have been steadily softening. But the strength in the Dubai curve in our view was carrying the crude oil market in general. A source of strength in the crude oil market. The core of the strength.
The now finally sharp decline of the front-end of the Dubai crude curve is thus a strong shift. Weakness in the Dubai crude marker is weakness in the core of the oil market. The core which has helped to hold the oil market elevated.
Facts supports the weakening. Add in facts of Iraq lifting production from Kurdistan through Turkey. Saudi Arabia lifting production to 10 mb/d in September (normal production level) and lifting exports as well as domestic demand for oil for power for air con is fading along with summer heat. Add also in counter seasonal rise in US crude and product stocks last week. US oil stocks usually decline by 1.3 mb/week this time of year. Last week they instead rose 6.4 mb/week (+7.2 mb if including SPR). Total US commercial oil stocks are now only 2.1 mb below the 2015-19 seasonal average. US oil stocks normally decline from now to Christmas. If they instead continue to rise, then it will be strongly counter seasonal rise and will create a very strong bearish pressure on oil prices.
Will OPEC+ lift its voluntary quotas by zero, 137 kb/d, 500 kb/d or 1.5 mb/d? On Sunday of course OPEC+ will decide on how much to unwind of the remaining 1.5 mb/d of voluntary quotas for November. Will it be 137 kb/d yet again as for October? Will it be 500 kb/d as was talked about earlier this week? Or will it be a full unwind in one go of 1.5 mb/d? We think most likely now it will be at least 500 kb/d and possibly a full unwind. We discussed this in a not earlier this week: ”500 kb/d of voluntary quotas in October. But a full unwind of 1.5 mb/d”
The strength in the front-end of the Dubai curve held out through summer while Brent and WTI curve structures weakened steadily. That core strength helped to keep flat crude oil prices elevated close to the 70-line. Now also the Dubai curve has given in.

Brent crude oil forward curves

Total US commercial stocks now close to normal. Counter seasonal rise last week. Rest of year?

Total US crude and product stocks on a steady trend higher.


The Mid-East anchor dragging crude oil lower

Samtal om sällsynta jordartsmetaller, guld och silver

Brookfield köper bränsleceller för 5 miljarder USD av Bloom Energy för att driva AI-datacenter

Teck Resources kan förse Nordamerika och kanske hela G7 med all germanium som behövs

Leading Edge Materials är på rätt plats i rätt tid

Kinas elproduktion slog nytt rekord i augusti, vilket även kolkraft gjorde

Tyskland har så höga elpriser att företag inte har råd att använda elektricitet

OPEC+ missar produktionsmål, stöder oljepriserna

Ett samtal om guld, olja, fjärrvärme och förnybar energi
Brent crude ticks higher on tension, but market structure stays soft
-
 Nyheter4 veckor sedan
Kinas elproduktion slog nytt rekord i augusti, vilket även kolkraft gjorde
-
Nyheter4 veckor sedan
Tyskland har så höga elpriser att företag inte har råd att använda elektricitet
-
 Nyheter3 veckor sedan
OPEC+ missar produktionsmål, stöder oljepriserna
-
 Nyheter3 veckor sedan
Ett samtal om guld, olja, fjärrvärme och förnybar energi
-
Analys4 veckor sedan
Brent crude ticks higher on tension, but market structure stays soft
-
Analys3 veckor sedan
Are Ukraine’s attacks on Russian energy infrastructure working?
-

 Nyheter2 veckor sedan
Guld nära 4000 USD och silver 50 USD, därför kan de fortsätta stiga
-

 Nyheter3 veckor sedan
Guldpriset uppe på nya höjder, nu 3750 USD