

Analys
SHB Råvarubrevet 30 augusti 2013

 Råvaror allmänt
Allt fokus på Syrien
USA tillsammans med Storbritannien och Frankrike laddar upp för någon slags militär intervention i syfte att straffa den syriska regimen för påstådda krigsförbrytelser, kanske i syfte att skicka en signal till andra länder att kemisk krigföring inte är acceptabelt. Detta har gett olja och guldpriset rejäl skjuts och bidragit till ökad volatilitet och sänkt riskaptit generellt på finansmarknaderna. Än så länge är det dock för tidigt att tala om några större negativa ekonomiska effekter från vad som hänt. Vad som händer framöver avgörs av vilka insatser som görs samt vilken respons det får, inte bara från Syriens regering utan även i omkringliggande länder och på ”den arabiska gatan”. Iraks oljeproduktion är den största riskfaktorn just nu. Den Sunni vs Shiite konflikt som råder i Syrien är direkt översättningsbar till Irak. Riskpremien i olja är därför motiverad då Irak, till skillnad från Syrien har en betydande oljeproduktion som Saudi inte kan täcka upp för.
Vårt positiva konjunkturscenario har getts stöd av den senaste statistiken, trots att amerikansk bostadsmarknadsdata på sistone överraskat något negativt. Risken för vissa ekonomiska bakslag senare i höst får sägas vara stigande givet att turbulensen i emerging markets i dagens marknad inte på något sätt tänks påverka varken Europa eller USA.
Basmetaller
I väntan på PMI från Kina
Basmetallerna har fallit något under veckan på den generella risk off rörelsen i bakvattnet av krigsrisken i Mellanöstern och som får industriella råvaror att backa medans klassiska krisindikator som guld och olja stiger. Vårt basmetallindex faller med 1,3 % där nickel återigen tar den största smällen, ner 4 %. Handelsdata, råvaruimport och flash PMI pekar all i rätt riktning för att Kinas makrodata ska kunna bli en otippad positiv överraskning under september.
På söndag publiceras Kinas PMI (det statliga) för augusti där förväntat 50,2 mot 50,3 i juli. HSBC:s PMI publiceras därefter på måndag där förväntat ligger på 50,2 mot 47,7 i juli. Vi räknar med positiv överraskning för dessa båda data vilket kommer driva basmetaller uppåt. Vi behåller vår positiva vy för basmetaller.
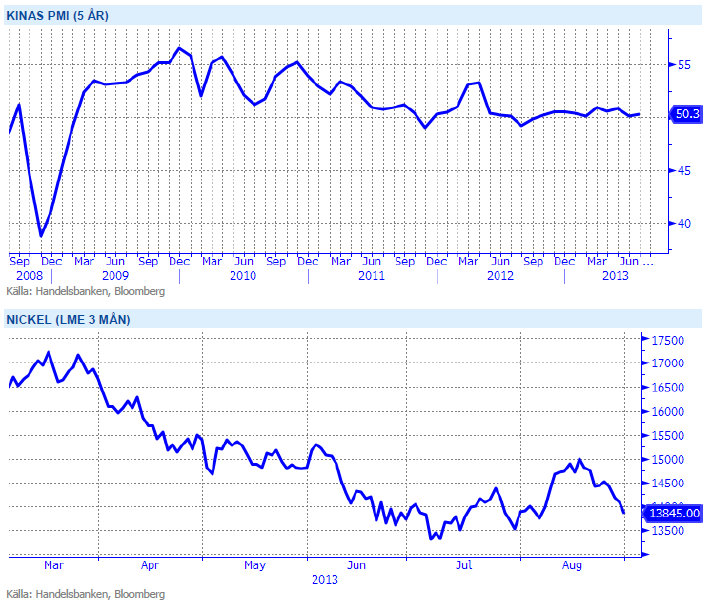
Nickel är den basmetall som gått ner mest under året och med många gruvor som går med förlust på dagens prisnivåer tror vi på stigande priser. Vi tror på: LONG NICKEL H
Ädelmetaller
Guld, fortsatt starkt, men platina ännu starkare
Guldet ligger i skrivande stund på samma nivå som förra veckan, 1395 dollar per uns. Förra veckan var det dock veckohögsta, denna veckan är det veckolägsta. Vi har varit uppe på 1430 dollar, drivet av John Kerrys uppskruvade retorik mot Syrien, men inga fundamentala nyheter har påverkat priset denna veckan. Vi tycker fortfarande att prisutvecklingen ser konstruktiv ut, och ligger kvar i vår positiva syn på guldet. Vi har haft 1450 som target i denna prisrörelse, och når vi dit så får vi ta en funderare på nästa steg.
I väntan på detta vill vi slå ett slag för en annan ädelmetall – platina – som inte bara får avsevärt mindre uppmärksamhet än guldet, utan också är något ”smartare” i betydelsen att den har en industriell nytta. Platina har faktiskt utpresterat guldet inte bara under guldets fall under våren, utan även under återhämtningen sedan halvårsskiftet. Vi har en positiv syn på hela ädelmetallsektorn, mest drivet av guldet, men kommer att titta lite närmare på platina framöver. Watch this space!
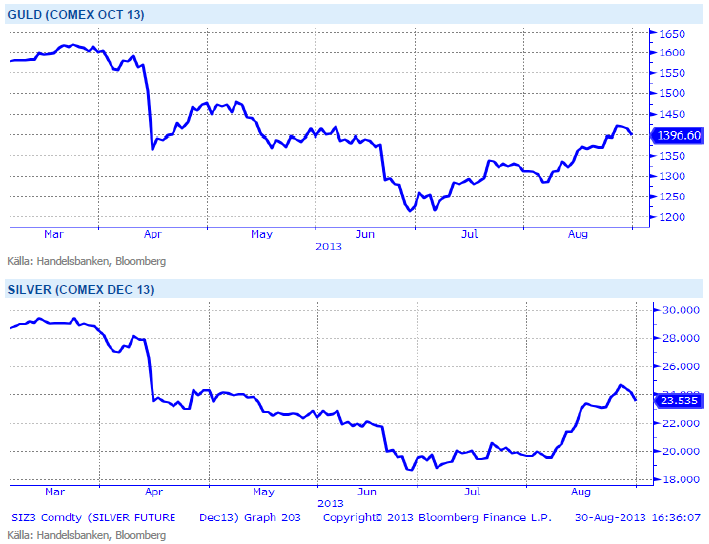
I ett läge där råvaror generellt har viktats ned av institutionella placerare kan guld och silver få en ”omotiverad” uppgång när dessa indexköpare återvänder till råvaror drivit av bättre utsikter för Kina och USA. Vi tror på: LONG GULD H och LONG SILVER H
Energi
Syrien pressar upp oljepriset
Brentoljan handlades upp på högsta nivån (USD 116.61) sedan februari efter oro kring ytterligare utbudsstörningar i Mellanöstern om västvärlden skulle intervenera i Syrien. Detta utöver rådande MENA oro och produktionsbortfall om ca 2.8 miljoner fat per dag under augusti främst från Iran och Libyen men även från Syrien, Sudan och Irak. Trenden förstärks ytterligare av globala tillväxtförväntningar. Ett ökat intresse för olja som aktiehedge skapar också momentum där marknaden blivit betydligt längre. Saudiarabien producerar närmare 10.5 miljoner fat per dag, den högsta nivån någonsin, vilket resulterar i en global reservkapacitet om endast 1.3 miljoner fat per dag vs USA:s skifferproduktion om 2.5 miljoner fat per dag. De globala utbudsstörningarna har ökat 3 miljoner fat per dag sedan december 2009 att jämföra med tillväxten i USA:s skifferproduktion om 2 miljoner fat per dag under samma period. Med kraftiga utbudsstörningar och låg reservkapacitet kan oljepriset med andra ord skjuta ordentligt i höjden vid en eventuell intervention i Syrien. Oavsett om det sker eller inte räknar vi med ett fortsatt högt oljepris med klar potential på uppsidan. Mer om utvecklingen på oljemarknaden.
Elmarknaden och kvartalet Q413 backar med strax över en procent efter att väderprognoserna tappat den torra avslutning som låg mot slutet av förra veckan. Nederbörden ser ut att gå mer mot normala nivåer vilket skulle innebära ett underskott kring ca 8-9 TWh efter vecka 36. Då gas får stöd av oljemarknaden samtidigt som utsläppsrätterna och kolet handlar oförändrat. Även om kolsentimentet försvagats något ytterligare i fronten, förväntar vi oss att elmarknaden handlar kvar i den range vi fastnat i med risken på uppsidan om vädret slår om mot det torrare slaget igen.
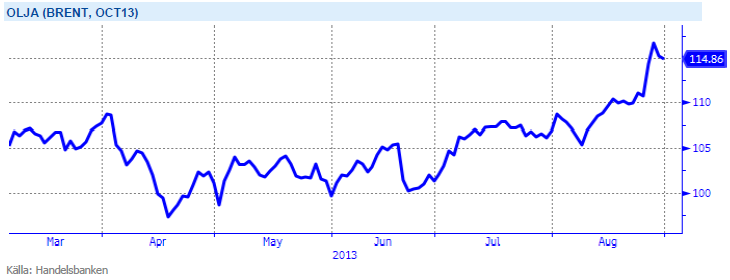
Oroligheterna i mellanöstern med risk för ytterligare produktionsbortfall ger stöd till oljepriset. Vi tror på: LONG OLJA
Livsmedel
Vädret i fokus
Vädret fortsätter att styra prisutvecklingen för vete, majs och sojabönor. Vete och majs steg i början av veckan men efter att regn (dock inga stora mängder) fallit över viktiga regioner i USA handlas grödorna nu på samma nivåer som måndagens öppning. Priset på sojabönor har rört sig sidledes under veckan och stänger något lägre (-1,4 %). Vi fortsätter att hålla neutral vy för denna sektor och konstaterar att väderprognoserna kommer stå i fokus ett tag framöver.
Det är fortfarande torrt vid Elfenbenskusten varför priset på kakao gått sidledes de senaste tre veckorna. Det var i början av augusti som priset på kakao steg 7 procent efter uteblivet regn. Västafrika står för 70 procent av den globala kakaoproduktionen och risken på uppsidan ökar i takt med fortsatt torka i dessa regioner. Kaffepriset fortsätter att backa och i skrivande stund handlas decemberkontraktet på 1,17 dollar/Ib. Årets skörd har hittills inte visat på några större överraskningar och det rapporteras om goda lager. Fler och fler odlare håller på sitt kaffe som följd av de låga kaffepriserna och hoppas på stigande priser.
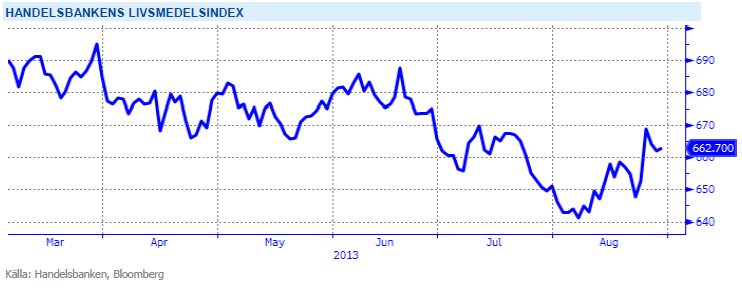
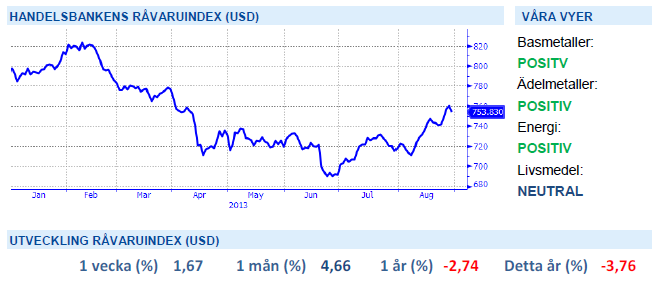
Handelsbankens Råvaruindex
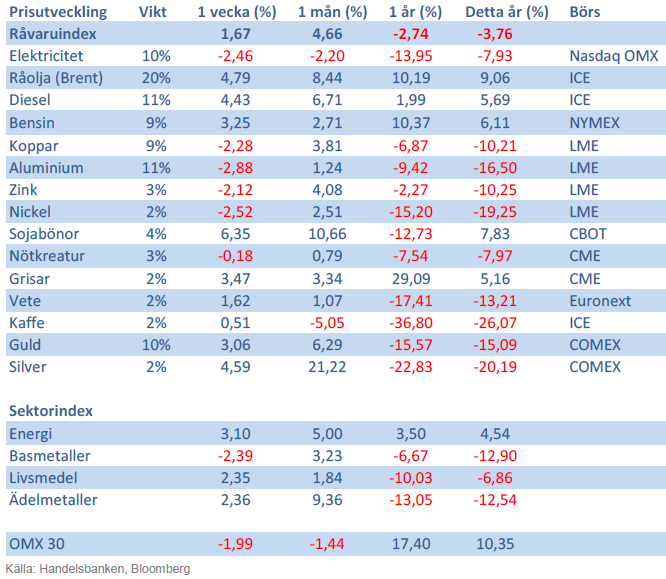
Handelsbankens råvaruindex består av de underliggande indexen för respektive råvara. Vikterna är bestämda till hälften från värdet av nordisk produktion (globala produktionen för sektorindex) och till hälften från likviditeten i terminskontrakten.
[box]SHB Råvarubrevet är producerat av Handelsbanken och publiceras i samarbete och med tillstånd på Råvarumarknaden.se[/box]
Ansvarsbegränsning
Detta material är producerat av Svenska Handelsbanken AB (publ) i fortsättningen kallad Handelsbanken. De som arbetar med innehållet är inte analytiker och materialet är inte oberoende investeringsanalys. Innehållet är uteslutande avsett för kunder i Sverige. Syftet är att ge en allmän information till Handelsbankens kunder och utgör inte ett personligt investeringsråd eller en personlig rekommendation. Informationen ska inte ensamt utgöra underlag för investeringsbeslut. Kunder bör inhämta råd från sina rådgivare och basera sina investeringsbeslut utifrån egen erfarenhet.
Informationen i materialet kan ändras och också avvika från de åsikter som uttrycks i oberoende investeringsanalyser från Handelsbanken. Informationen grundar sig på allmänt tillgänglig information och är hämtad från källor som bedöms som tillförlitliga, men riktigheten kan inte garanteras och informationen kan vara ofullständig eller nedkortad. Ingen del av förslaget får reproduceras eller distribueras till någon annan person utan att Handelsbanken dessförinnan lämnat sitt skriftliga medgivande. Handelsbanken ansvarar inte för att materialet används på ett sätt som strider mot förbudet mot vidarebefordran eller offentliggörs i strid med bankens regler.


Some rebound but not much. Brent crude rebounded 1.5% yesterday to $65.47/b. This morning it is inching 0.2% up to $65.6/b. The lowest close last week was on Thursday at $64.11/b.

The curve structure is almost as week as it was before the weekend. The rebound we now have gotten post the message from OPEC+ over the weekend is to a large degree a rebound along the curve rather than much strengthening at the front-end of the curve. That part of the curve structure is almost as weak as it was last Thursday.
We are still on a weakening path. The message from OPEC+ over the weekend was we are still on a weakening path with rising supply from the group. It is just not as rapidly weakening as was feared ahead of the weekend when a quota hike of 500 kb/d/mth for November was discussed.
The Brent curve is on its way to full contango with Brent dipping into the $50ies/b. Thus the ongoing weakening we have had in the crude curve since the start of the year, and especially since early June, will continue until the Brent crude oil forward curve is in full contango along with visibly rising US and OECD oil inventories. The front-month Brent contract will then flip down towards the $60/b-line and below into the $50ies/b.
At what point will OPEC+ turn to cuts? The big question then becomes: When will OPEC+ turn around to make some cuts? At what (price) point will they choose to stabilize the market? Because for sure they will. Higher oil inventories, some more shedding of drilling rigs in US shale and Brent into the 50ies somewhere is probably where the group will step in.
There is nothing we have seen from the group so far which indicates that they will close their eyes, let the world drown in oil and the oil price crash to $40/b or below.
The message from OPEC+ is also about balance and stability. The world won’t drown in oil in 2026. The message from the group as far as we manage to interpret it is twofold: 1) Taking back market share which requires a lower price for non-OPEC+ to back off a bit, and 2) Oil market stability and balance. It is not just about 1. Thus fretting about how we are all going to drown in oil in 2026 is totally off the mark by just focusing on point 1.
When to buy cal 2026? Before Christmas when Brent hits $55/b and before OPEC+ holds its last meeting of the year which is likely to be in early December.
Brent crude oil prices have rebounded a bit along the forward curve. Not much strengthening in the structure of the curve. The front-end backwardation is not much stronger today than on its weakest level so far this year which was on Thursday last week.

The front-end backwardation fell to its weakest level so far this year on Thursday last week. A slight pickup yesterday and today, but still very close to the weakest year to date. More oil from OPEC+ in the coming months and softer demand and rising inventories. We are heading for yet softer levels.

Down to the lowest since early May. Brent crude has fallen sharply the latest four days. It closed at USD 64.11/b yesterday which is the lowest since early May. It is staging a 1.3% rebound this morning along with gains in both equities and industrial metals with an added touch of support from a softer USD on top.
What stands out the most to us this week is the collapse in the Dubai one to three months time-spread.
Dubai is medium sour crude. OPEC+ is in general medium sour crude production. Asian refineries are predominantly designed to process medium sour crude. So Dubai is the real measure of the balance between OPEC+ holding back or not versus Asian oil demand for consumption and stock building.
A sharp weakening of the front-end of the Dubai curve. The front-end of the Dubai crude curve has been holding out very solidly throughout this summer while the front-end of the Brent and WTI curves have been steadily softening. But the strength in the Dubai curve in our view was carrying the crude oil market in general. A source of strength in the crude oil market. The core of the strength.
The now finally sharp decline of the front-end of the Dubai crude curve is thus a strong shift. Weakness in the Dubai crude marker is weakness in the core of the oil market. The core which has helped to hold the oil market elevated.
Facts supports the weakening. Add in facts of Iraq lifting production from Kurdistan through Turkey. Saudi Arabia lifting production to 10 mb/d in September (normal production level) and lifting exports as well as domestic demand for oil for power for air con is fading along with summer heat. Add also in counter seasonal rise in US crude and product stocks last week. US oil stocks usually decline by 1.3 mb/week this time of year. Last week they instead rose 6.4 mb/week (+7.2 mb if including SPR). Total US commercial oil stocks are now only 2.1 mb below the 2015-19 seasonal average. US oil stocks normally decline from now to Christmas. If they instead continue to rise, then it will be strongly counter seasonal rise and will create a very strong bearish pressure on oil prices.
Will OPEC+ lift its voluntary quotas by zero, 137 kb/d, 500 kb/d or 1.5 mb/d? On Sunday of course OPEC+ will decide on how much to unwind of the remaining 1.5 mb/d of voluntary quotas for November. Will it be 137 kb/d yet again as for October? Will it be 500 kb/d as was talked about earlier this week? Or will it be a full unwind in one go of 1.5 mb/d? We think most likely now it will be at least 500 kb/d and possibly a full unwind. We discussed this in a not earlier this week: ”500 kb/d of voluntary quotas in October. But a full unwind of 1.5 mb/d”
The strength in the front-end of the Dubai curve held out through summer while Brent and WTI curve structures weakened steadily. That core strength helped to keep flat crude oil prices elevated close to the 70-line. Now also the Dubai curve has given in.

Brent crude oil forward curves

Total US commercial stocks now close to normal. Counter seasonal rise last week. Rest of year?

Total US crude and product stocks on a steady trend higher.

Analys
OPEC+ will likely unwind 500 kb/d of voluntary quotas in October. But a full unwind of 1.5 mb/d in one go could be in the cards
Down to mid-60ies as Iraq lifts production while Saudi may be tired of voluntary cut frugality. The Brent December contract dropped 1.6% yesterday to USD 66.03/b. This morning it is down another 0.3% to USD 65.8/b. The drop in the price came on the back of the combined news that Iraq has resumed 190 kb/d of production in Kurdistan with exports through Turkey while OPEC+ delegates send signals that the group will unwind the remaining 1.65 mb/d (less the 137 kb/d in October) of voluntary cuts at a pace of 500 kb/d per month pace.
Signals of accelerated unwind and Iraqi increase may be connected. Russia, Kazakhstan and Iraq were main offenders versus the voluntary quotas they had agreed to follow. Russia had a production ’debt’ (cumulative overproduction versus quota) of close to 90 mb in March this year while Kazakhstan had a ’debt’ of about 60 mb and the same for Iraq. This apparently made Saudi Arabia angry this spring. Why should Saudi Arabia hold back if the other voluntary cutters were just freeriding? Thus the sudden rapid unwinding of voluntary cuts. That is at least one angle of explanations for the accelerated unwinding.
If the offenders with production debts then refrained from lifting production as the voluntary cuts were rapidly unwinded, then they could ’pay back’ their ’debts’ as they would under-produce versus the new and steadily higher quotas.
Forget about Kazakhstan. Its production was just too far above the quotas with no hope that the country would hold back production due to cross-ownership of oil assets by international oil companies. But Russia and Iraq should be able to do it.
Iraqi cumulative overproduction versus quotas could reach 85-90 mb in October. Iraq has however steadily continued to overproduce by 3-5 mb per month. In July its new and gradually higher quota came close to equal with a cumulative overproduction of only 0.6 mb that month. In August again however its production had an overshoot of 100 kb/d or 3.1 mb for the month. Its cumulative production debt had then risen to close to 80 mb. We don’t know for September yet. But looking at October we now know that its production will likely average close to 4.5 mb/d due to the revival of 190 kb/d of production in Kurdistan. Its quota however will only be 4.24 mb/d. Its overproduction in October will thus likely be around 250 kb/d above its quota with its production debt rising another 7-8 mb to a total of close to 90 mb.
Again, why should Saudi Arabia be frugal while Iraq is freeriding. Better to get rid of the voluntary quotas as quickly as possible and then start all over with clean sheets.
Unwinding the remaining 1.513 mb/d in one go in October? If OPEC+ unwinds the remaining 1.513 mb/d of voluntary cuts in one big go in October, then Iraq’s quota will be around 4.4 mb/d for October versus its likely production of close to 4.5 mb/d for the coming month..
OPEC+ should thus unwind the remaining 1.513 mb/d (1.65 – 0.137 mb/d) in one go for October in order for the quota of Iraq to be able to keep track with Iraq’s actual production increase.
October 5 will show how it plays out. But a quota unwind of at least 500 kb/d for Oct seems likely. An overall increase of at least 500 kb/d in the voluntary quota for October looks likely. But it could be the whole 1.513 mb/d in one go. If the increase in the quota is ’only’ 500 kb/d then Iraqi cumulative production will still rise by 5.7 mb to a total of 85 mb in October.
Iraqi production debt versus quotas will likely rise by 5.7 mb in October if OPEC+ only lifts the overall quota by 500 kb/d in October. Here assuming historical production debt did not rise in September. That Iraq lifts its production by 190 kb/d in October to 4.47 mb/d (August level + 190 kb/d) and that OPEC+ unwinds 500 kb/d of the remining quotas in October when they decide on this on 5 October.


Teck Resources kan förse Nordamerika och kanske hela G7 med all germanium som behövs

Leading Edge Materials är på rätt plats i rätt tid

Oljepriset faller efter ny handelskonflikt mellan USA och Kina

Christian Kopfer kommenterar guld, koppar, olja och stål, samt några råvarubolag

Silver spränger den magiska gränsen, kostar nu över 50 USD per uns

Kinas elproduktion slog nytt rekord i augusti, vilket även kolkraft gjorde

Tyskland har så höga elpriser att företag inte har råd att använda elektricitet

Det stigande guldpriset en utmaning för smyckesköpare

OPEC+ missar produktionsmål, stöder oljepriserna

Ett samtal om guld, olja, fjärrvärme och förnybar energi
-
 Nyheter4 veckor sedan
Kinas elproduktion slog nytt rekord i augusti, vilket även kolkraft gjorde
-
Nyheter4 veckor sedan
Tyskland har så höga elpriser att företag inte har råd att använda elektricitet
-
 Nyheter4 veckor sedan
Det stigande guldpriset en utmaning för smyckesköpare
-
 Nyheter3 veckor sedan
Ett samtal om guld, olja, fjärrvärme och förnybar energi
-
 Nyheter2 veckor sedan
OPEC+ missar produktionsmål, stöder oljepriserna
-
Analys4 veckor sedan
Brent crude ticks higher on tension, but market structure stays soft
-
Analys3 veckor sedan
Are Ukraine’s attacks on Russian energy infrastructure working?
-

 Nyheter1 vecka sedan
Guld nära 4000 USD och silver 50 USD, därför kan de fortsätta stiga