

Analys
SHB Råvarubrevet 25 oktober 2013

 Råvaror allmänt
Nu märks USA-effekten
Senaste veckan har bjudit på tillfälligt dystrare ekonomiska utsikter efter den finanspolitiska turbulensen i USA. Nedstängningen av den federala staten slår automatiskt på BNP-tillväxten under det fjärde kvartalet. Intressant är vilka effekter den förhöjda osäkerheten i USA (skuldtaksfrågan är ju bara framskjuten till början av nästa år) kommer att få på investerings- och konsumtionsbeslut, även om denna osäkerhet har minskat något sedan en överenskommelse kom på plats. Offentliganställda har flera viktiga deadlines att beakta – stundar ännu en nedstängning i januari? Marknadens förväntningar på en nedskalning av Federal Reserves obligationsköparprogram, QE3, har också förändrats tydligt den senaste månaden. Från att en nästan enhällig ekonomkår trodde på en nedskalning i september är konsensus nu snarare mars 2014. Bland råvarorna har det främst prisats in i guld som handlas på 4 veckors högsta.
Vårt tema där Kina ska stå för höstens positiva makroöverraskning håller i sig. Flashen för inköpschefsindex kom in under veckan på 50,9, upp från 50,2 i september och den högsta nivån på 7 månader. Basmetallerna är dock fortsatt ”rangehandlade”, klämda mellan starkare utsikter för efterfrågan från Kina och ett produktionsöverskott i marknaden.
Brentpriset ser denna vecka ut att gå mot det största raset på 4 månader. Orsakerna till prisuppgången i augusti verkar nu omvänt. Lagernivåerna i USA steg under veckan oväntat mycket – i somras föll de oväntat mycket. Den politiska turbulensen i Mellanöstern har också hamnat utanför kameralinsen senaste veckorna vilket prisar ur mer av riskpremien. När elpriset dessutom har haft två svaga veckor efter väderomslag med stor nederbörd och blötare prognoser så har vårt energiindex tappat sin starka trend uppåt. Vi tror dock på en come back, främst för el i närtid.
Basmetaller
Lagerproblematik pressar upp fysisk premie
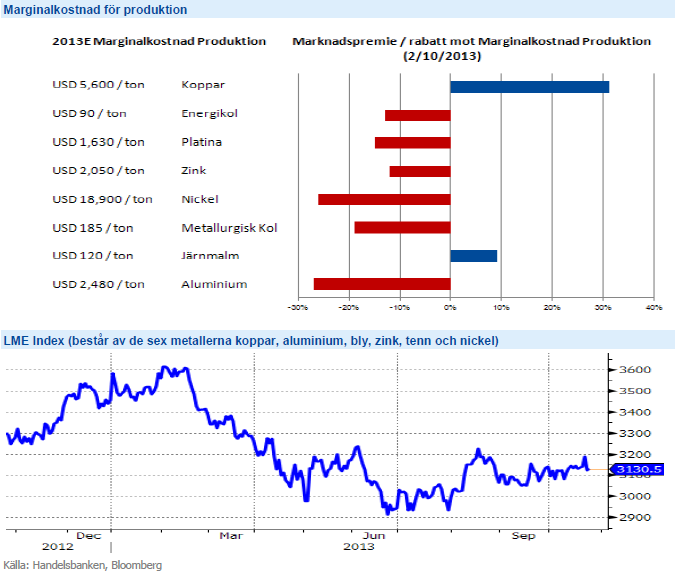
Basmetallerna har stärkts över lag under veckan, dels på grund av positiv PMI-flash från Kina, och vi tror på en fortsatt stark höst. LME Index har stabiliserats efter sommarens bottennoteringar och vi räknar med att den positiva trenden fortsätter utan några dramatiska rörelser. Överskottet bör ha diskonterats för och läget på metaller kanske bäst illustreras genom bilden nedan där Nickel och Aluminium är de två metaller som handlas på störst rabatt sett i förhållande till marginalkostnad.
Ser vi till Aluminium och Zink förstärks balansen ytterligare av de lager som förväntas nå marknaden i samband med LME´s eventuella reglering för att få bukt på flaskhalsarna, dvs köerna som drivit upp fysiska premierna 100-200 procent över 10-års snittet samtidigt som börskurserna ligger kvar kring 10-års snittet. På Aluminium innebär det sannolikt att vi börjar röra oss tillbaka mot normalnivån om ca 100 dollar (från de 250-300 dollar vi sett) så vi förväntar oss att LME inom kort ger besked kring dessa regleringar som i stora drag skall se till att lika mycket metall går ut som kommer in, med implementeringstart från april nästa år.
Vi tror att Kinas tillväxt kommer överraska positivt under Q4 och Q1, vilket kommer stärka metallerna. Vi tror på: LONG BASMETALLER
Ädelmetaller
Återigen oro för strejk i Sydafrika
Guldet handlas upp 1.5 procent med visst stöd från ETF-flöden och en försvagad dollar där EURUSD för första gången på två år passerade 1.38. Platina stiger med ungefär lika mycket och ökat fokus på den förnyade strejkoron i Sydafrika. AMCU-facket misslyckades i sina löneförhandlingar gentemot Anglo American (världens största Platinaproducent) och det radikala facket är sedan tidigare i konflikt med Impala Platinum (världens näst största Platinaproducent), där alla försök till medling misslyckats. AMCU skall i början av nästa vecka besluta om man skall gå ut i strejk vid Impala. Kortsiktigt stöd om man ser till dollarutvecklingen och oron kring Sydafrika men vi räknar med att guldet sedan faller tillbaka i den mer långsiktigt negativa trend där vi befinner oss.
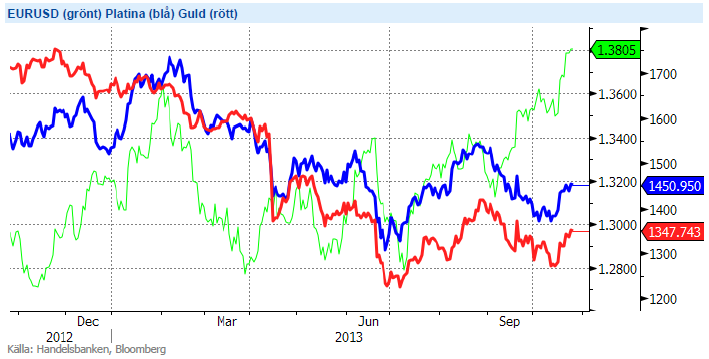
Efter en uppgång under sommaren tror vi åter att guldets väg lutar utför. Vi tror på: SHRT GULD H
Energi
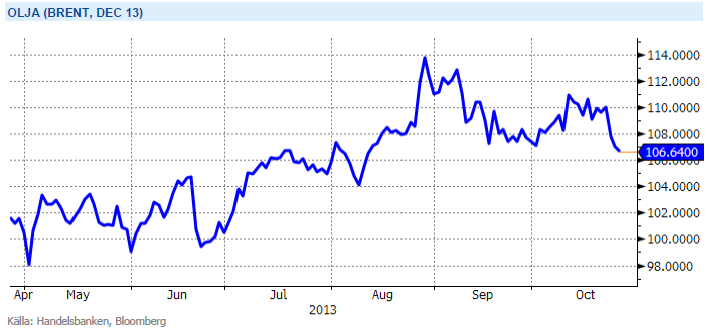
Höga lager pressar oljan
Oljepriset har fallit under veckan till följd av stigande lager (högsta nivå sedan juni) och handlas nu på 106,6 USD/fat. Oro för kortsiktigt överskott av amerikansk råolja har fått spreaden mellan WTI och Brent-olja att gå isär, som mest under veckan på dryga 11 dollar, vilket är störst sedan april. Kombinationen av växande nordamerikanska produktionen, nya rörledningar till den amerikanska gulfkusten och storskaliga revisionsstopp på raffinaderier är anledningen till att WTI-oljan handlas så mycket lägre än Brent.
Elmarknaden (Q1-14) backar med närmare 5 procent under veckan efter att vädret slagit om och lågtrycket drivit stora nederbördsfronter rakt in mot framförallt Norge. Som mest uppmättes hela 3.5 TWh nederbördsenergi i Norge och Sverige under tisdagen och detta är enligt statistik den mest nederbördsrika dag mätt till energimängd på hela 10 år! Även den höga temperaturen har överraskat och i södra Sverige noterades 19 grader vilket är den högsta temperaturen på över 125 år! Ser vi till energibalansen bör den såldes förbättras till 15.6 TWh i underskott med prognoserna. Kolet får stöd av en svagare dollar, fraktrater samt marginalkostnad för produktion vilken inte motiverar full produktion på dessa låga nivåer. Utsläppsrätterna som bröt igenom 5 EUR-nivån har nu återhämtat sig vilket resulterar i att brytpriset för kol nu stigit med 3 euro. När de värsta lågtrycksbetonade vädret dragit förbi ser vi åter elen som köpvärd inför vintern.
Energiunderskott tillsammans med osäkerhet kring kärnkraftsverken inför vintern talar för högre elpris. Vi tror på: LONG EL
Livsmedel
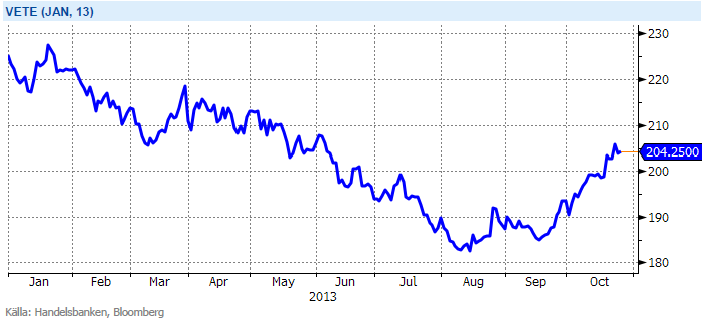
Vetet är fortsatt starkt
Prisuppgången på vete den senaste tiden (6,9 % under oktober) är driven av problemen i Ryssland och Argentina, med stöd av producenternas ovilja att sälja i en stigande marknad. Det ser ut att ha blivit något torrare i Ryssland men den sådd som görs nu görs sent och under blöta förhållanden. Omkring 5 procent av vårveteskörden återstår i Ryssland, den del av detta som blir skördat håller låg kvalitet. Utan nya problem inom kort blir vi inte förvånade om vi ser ytterligare korrigering nedåt den närmsta tiden. Det finns trots allt gott om spannmål att tillgå i världen och ännu mer på ingång.
Skörden på sojabönor i USA går framåt, till helgen beräknas omkring 85 procent av skörden vara avklarad. Inkommande skörderapporter talar för en avkastning på åtminstone 42 bushels per acre. Sojasådden i Brasilien går framåt i rask i bra takt under bra förhållanden, vilket stärker tron om en kommande rekordskörd. Det tillsammans med höga förväntningar på en stor amerikansk sojaareal till våren talar för lägre priser på soja på några månaders sikt.
Med anledning av ett ökat intresse kring kaffe har vi i skrivit lite mer ingående om denna lyxiga råvara. Läs Kaffe Special Edition.
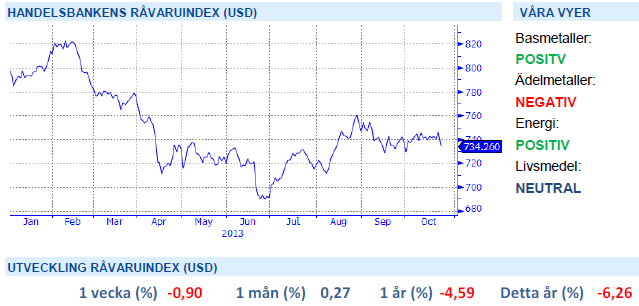
Handelsbankens Råvaruindex
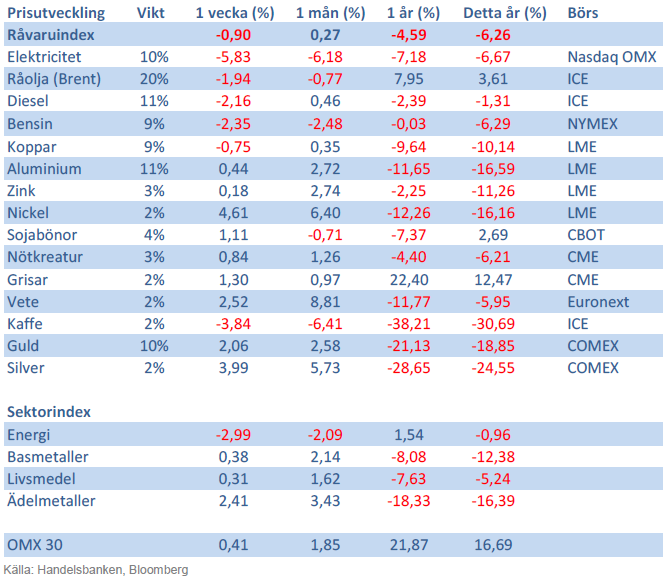
Handelsbankens råvaruindex består av de underliggande indexen för respektive råvara. Vikterna är bestämda till hälften från värdet av nordisk produktion (globala produktionen för sektorindex) och till hälften från likviditeten i terminskontrakten.
[box]SHB Råvarubrevet är producerat av Handelsbanken och publiceras i samarbete och med tillstånd på Råvarumarknaden.se[/box]
Ansvarsbegränsning
Detta material är producerat av Svenska Handelsbanken AB (publ) i fortsättningen kallad Handelsbanken. De som arbetar med innehållet är inte analytiker och materialet är inte oberoende investeringsanalys. Innehållet är uteslutande avsett för kunder i Sverige. Syftet är att ge en allmän information till Handelsbankens kunder och utgör inte ett personligt investeringsråd eller en personlig rekommendation. Informationen ska inte ensamt utgöra underlag för investeringsbeslut. Kunder bör inhämta råd från sina rådgivare och basera sina investeringsbeslut utifrån egen erfarenhet.
Informationen i materialet kan ändras och också avvika från de åsikter som uttrycks i oberoende investeringsanalyser från Handelsbanken. Informationen grundar sig på allmänt tillgänglig information och är hämtad från källor som bedöms som tillförlitliga, men riktigheten kan inte garanteras och informationen kan vara ofullständig eller nedkortad. Ingen del av förslaget får reproduceras eller distribueras till någon annan person utan att Handelsbanken dessförinnan lämnat sitt skriftliga medgivande. Handelsbanken ansvarar inte för att materialet används på ett sätt som strider mot förbudet mot vidarebefordran eller offentliggörs i strid med bankens regler.


Hesitant today. Brent jumped to an intraday high of $66.36/b yesterday after having touched an intraday low of $60.07/b on Monday as Indian and Chinese buyers cancelled some Russian oil purchases and instead redirected their purchases towards the Middle East due to the news US sanctions. Brent is falling back 0.4% this morning to $65.8/b.

It’s our strong view that the only sensible thing is to sell this rally. In all Trump’s unpredictability he has become increasingly predictable. Again and again he has rumbled about how he is going to be tough on Putin. Punish Putin if he won’t agree to peace in Ukraine. Recent rumbling was about the Tomahawk rockets which Trump threatened on 10 October and 12 October to sell/send to Ukraine. Then on 17 October he said that ”the U.S. didn’t want to give away weapons (Tomahawks) it needs”.
All of Trump’s threats towards Putin have been hot air. So far Trump’s threats have been all hot air and threats which later have evaporated after ”great talks with Putin”. After all these repetitions it is very hard to believe that this time will be any different. The new sanctions won’t take effect before 21. November. Trump has already said that: ”he was hoping that these new sanctions would be very short-lived in any case”. Come 21. November these new sanctions will either evaporate like all the other threats Trump has thrown at Putin before fading them. Or the sanctions will be postponed by another 4 weeks or 8 weeks with the appearance that Trump is even more angry with Putin. But so far Trump has done nothing that hurt Putin/Russia. We can’t imagine that this will be different. The only way forward in our view for a propre lasting peace in Ukraine is to turn Ukraine into defensive porcupine equipped with a stinging tail if need be.
China will likely stand up to Trump if new sanctions really materialize on 21 Nov. Just one country has really stood up to Trump in his tariff trade war this year: China. China has come of age and strength. I will no longer be bullied. Trump upped tariffs. China responded in kind. Trump cut China off from high-end computer chips. China put on the breaks on rare earth metals. China won’t be bullied any more and it has the power to stand up. Some Chinese state-owned companies like Sinopec have cancelled some of their Russian purchases. But China’s Foreign Ministry spokesperson Guo Jiakun has stated that China “oppose unilateral sanctions which lack a basis in international law and authorization of the UN Security Council”. Thus no one, not even the US shall unilaterally dictate China from whom they can buy oil or not. This is yet another opportunity for China to show its new strength and stand up to Trump in a show of force. Exactly how China choses to play this remains to be seen. But China won’t be bullied by over something as important as its oil purchases. So best guess here is that China will defy Trump on this. But probably China won’t need to make a bid deal over this. Firstly because these new sanctions will either evaporate as all the other threats or be postponed once we get to 21 November. Secondly because the sanctions are explicit towards US persons and companies but only ”may” be enforced versus non-US entities.
Sanctions is not a reduction in global supply of oil. Just some added layer of friction. Anyhow, the new sanctions won’t reduce the supply of Russian crude oil to the market. It will only increase the friction in the market with yet more need for the shadow fleet and ship to ship transfer of Russian oil to dodge the sanctions. If they materialize at all.
The jump in crude oil prices is probably due to redirections of crude purchases to the Mid-East and not because all speculators are now turned bullish. Has oil rallied because all speculators now suddenly have turned bullish? We don’t think so. Brent crude has probably jumped because some Indian and Chinese oil purchasers of have redirected their purchases from Russia towards the Mid-East just in case the sanctions really materializes on 21 November.
Parts of the Brent crude curve dipping into the high $50ies/b. Brent crude fell 2.3% over the week to Friday. It closed the week at $61.29/b, a slight gain on the day, but also traded to a low of $60.14/b that same day and just barely avoided trading into the $50ies/b. This morning it is risk-on in equities which seems to help industrial metals a little higher. But no such luck for oil. It is down 0.8% at $60.8/b. This week looks set for Brent crude to dip its feet in the $50ies/b. The Brent 3mth contract actually traded into the high $50ies/b on Friday.
The front-end backwardation has been on a weakening foot and is now about to fully disappear. The lowest point of the crude oil curve has also moved steadily lower and lower and its discount to the 5yr contract is now $6.8/b. A solid contango. The Brent 3mth contract did actually dip into the $50ies/b intraday on Friday when it traded to a low point of $59.93/b.
More weakness to come as lots of oil at sea comes to ports. Mid-East OPEC countries have boosted exports along with lower post summer consumption and higher production. The result is highly visibly in oil at sea which increased by 17 mb to 1,311 mb over the week to Sunday. Up 185 mb since mid-August. On its way to discharge at a port somewhere over the coming month or two.
Don’t forget that the oil market path ahead is all down to OPEC+. Remember that what is playing out in the oil market now is all by design by OPEC+. The group has decided that the unwind of the voluntary cuts is what it wants to do. In a combination of meeting demand from consumers as well as taking back market share. But we need to remember that how this plays out going forward is all at the mercy of what OPEC+ decides to do. It will halt the unwinding at some point. It will revert to cuts instead of unwind at some point.
A few months with Brent at $55/b and 40-50 US shale oil rigs kicked out may be what is needed. We think OPEC+ needs to see the exit of another 40-50 drilling rigs in the US shale oil patches to set US shale oil production on a path to of a 1 mb/d year on year decline Dec-25 to Dec-26. We are not there yet. But a 2-3 months period with Brent crude averaging $55/b would probably do it.
Oil on water increased 17 mb over the week to Sunday while oil in transit increased by 23 mb. So less oil was standing still. More was moving.

Crude oil floating storage (stationary more than 7 days). Down 11 mb over week to Sunday

The lowest point of the Brent crude oil curve versus the 5yr contract. Weakest so far this year.

Crude oil 1mth to 3mth time-spreads. Dubai held out strongly through summer, but then that center of strength fell apart in late September and has been leading weakness in crude curves lower since then.

Rebounding along with most markets. But concerns over solidity of Gaza peace may also contribute. Brent crude fell 0.8% yesterday to $61.91/b and its lowest close since May this year. This morning it is bouncing up 0.9% to $62.5/b along with a softer USD amid positive sentiment with both equities and industrial metals moving higher. Concerns that the peace in Gaza may be less solid than what one might hope for also yields some support to Brent. Bets on tech stocks are rebounding, defying fears of trade war. Money moving back into markets. Gold continues upwards its strong trend and a softer dollar helps it higher today as well.
US crude & products probably rose 5.6 mb last week (API) versus a normal seasonal decline of 2.4 mb. The US API last night partial and thus indicative data for US oil inventories. Their data indicates that US crude stocks rose 7.4 mb last week, gasoline stocks rose 3.0 mb while Distillate stocks fell 4.8 mb. Altogether an increase in commercial crude and product stocks of 5.6 mb. Commercial US crude and product stocks normally decline by 2.4 mb this time of year. So seasonally adjusted the US inventories rose 8 mb last week according to the indicative numbers by the API. That is a lot. Also, the counter seasonal trend of rising stocks versus normally declining stocks this time of year looks on a solid pace of continuation. If the API is correct then total US crude and product stocks would stand 41 mb higher than one year ago and 6 mb higher than the 2015-19 average. And if we combine this with our knowledge of a sharp increase in production and exports by OPEC(+) and a large increase in oil at sea, then the current trend in US oil inventories looks set to continue. So higher stocks and lower crude oil prices until OPEC(+) switch to cuts. Actual US oil inventory data today at 18:00 CET.
US commercial crude and product stocks rising to 1293 mb in week 41 if last nights indicative numbers from API are correct.

Crude oil soon coming to a port near you. OPEC has lifted production sharply higher this autumn. At the same time demand for oil in the Middle-East has fallen as we have moved out of summer heat and crude oil burn for power for air-conditioning. The Middle-East oil producers have thus been able to lift exports higher on both accounts. Crude oil and condensates on water has shot up by 177 mb since mid-August. This oil is now on its way to ports around the world. And when they arrive, it will likely help to lift stocks onshore higher. That is probably when we will lose the last bit of front-end backwardation the the crude oil curves. That will help to drive the front-month Brent crude oil price down to the $60/b line and revisit the high $50ies/b. Then the eyes will be all back on OPEC+ when they meet in early November and then again in early December.
Crude oil and condensates at sea have moved straight up by 177 mb since mid-August as OPEC(+) has produced more, consumed less and exported more.


Sell the rally. Trump has become predictable in his unpredictability

Gruvbolaget Boliden överträffade analytikernas förväntningar

Australien och USA investerar 8,5 miljarder USD för försörjningskedja av kritiska mineraler
Brent crude set to dip its feet into the high $50ies/b this week

Vad guldets uppgång egentligen betyder för världen

Goldman Sachs höjer prognosen för guld, tror priset når 4900 USD

Blykalla och amerikanska Oklo inleder ett samarbete

Guld nära 4000 USD och silver 50 USD, därför kan de fortsätta stiga

Leading Edge Materials är på rätt plats i rätt tid

Nytt prisrekord, guld stiger över 4000 USD
-
 Nyheter3 veckor sedan
Goldman Sachs höjer prognosen för guld, tror priset når 4900 USD
-
 Nyheter4 veckor sedan
Blykalla och amerikanska Oklo inleder ett samarbete
-
 Nyheter3 veckor sedan
Guld nära 4000 USD och silver 50 USD, därför kan de fortsätta stiga
-
 Nyheter2 veckor sedan
Leading Edge Materials är på rätt plats i rätt tid
-
 Nyheter3 veckor sedan
Nytt prisrekord, guld stiger över 4000 USD
-

 Nyheter4 veckor sedan
Ett samtal om guld, olja, koppar och stål
-
Analys4 veckor sedan
OPEC+ will likely unwind 500 kb/d of voluntary quotas in October. But a full unwind of 1.5 mb/d in one go could be in the cards
-

 Nyheter4 veckor sedan
Neptune Energy bekräftar enorma litiumfyndigheter i Tyskland