

Analys
SHB Råvarubrevet 19 april 2013

 Råvaror allmänt
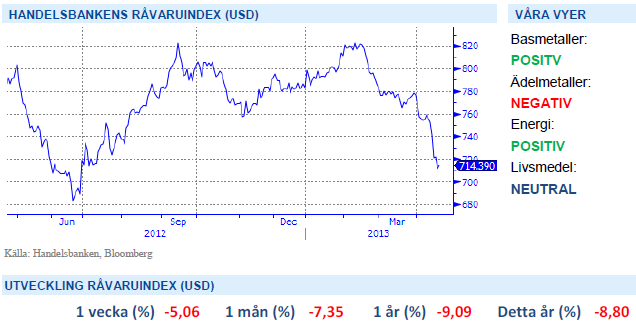
En vecka med motvind
Marknaden har haft ordentlig motvind sedan förra veckan. Denna gång är det framförallt råvaror som har handlats ner. Brentoljan har dippat under 100 USD och koppar under 7000 USD samtidigt som guldet har genomlidit det största fallet under två dagar på 30 år. De senaste motgångarna är inte koncentrerade till Europa som vi vant oss vid utan kommer från makrodata i USA och Kina. Vi har påtalat risken för besvikelser i amerikanskt makro under våren och de senaste händelserna stödjer denna riskbild.
Den QE pådrivna börsen tar sig förbi svagare data medan räntemarknaden och råvarumarknaden prisar in den för fullt. En svagare data är antagligen de första tecknen på finanspolitisk åtstramning i USA och kan också vara tecken på att QE3 effekten nu börjar ebba ut. Samtidigt har data i Kina börjat oroa på svagare nivåer än väntat på det hela taget. Med problembarnet Europa ständigt närvarande ser vi få ljuspunkter i makrobilden just nu.
Basmetaller
Metallerna under marginalkostnad
Basmetallerna har haft ytterligare en vecka med fallande priser, där koppar tappat dryga 6 % och handlas nu under 7000 USD – i nivå vi inte sett sedan oktober 2011. Förhoppningar på Kinas konjunkturuppgång har inte infriats och med ett USA som samtidigt släpper svagare data har fått konjunktur känsliga metaller att falla. I närtid finns risk för mer dålig USA data och för Kina ororas vi av att de stimulanser som lanserats redan verkat i indikatorer och det finns därför inte mer lanserad stimulansdriven tillväxt att vänta i barometerdata.
En rad metaller har efter senaste veckans negativa rörelser nu sjunkit och handlas klart under marginalkostnad för produktion vilken brukar verka bättre som stöd vid fallande kurser. Om vi bortser från Koppar där denna ligger på ca 4,500 dollar eller strax över 6,000 dollar om man ser till det ”incentive-pris”, som gäller för nya investeringar, och kanske bättre symboliserar stödet vid en svag balans, har vi svårt att se att detta ska falla så värst mycket ytterligare. Vi förväntar oss dock inget kraftigt uppställ på kort sikt utan snarare att marknaden bottnar ur för att sedan på lite längre sikt börja stiga igen. Initialt mot marginalkostnad vilket gör att vi ser detta som köpterritorium för metaller och möjlighet att komma in på bra nivåer.
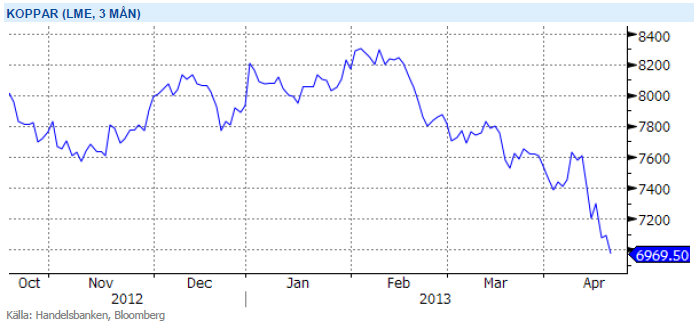
Trots fortsatt svag makromiljö, utan någon direkt ljusning ser vi ändå basmetaller som köpvärda på dessa nivåer. Vi tror på: LONG BASMET H
Ädelmetaller
Veckans snackis!
Guldet blev denna veckas stora samtalsämne efter att på måndagen ha fallit med över 11 % jämfört med fredagskvällens notering. Det cirkulerade många försök till förklaringar till den stora och plötsliga rörelsen, och varför den skedde just nu. Vi har inga bra svar på timingen, men konstaterar att det är en rörelse vi väntat på, och vi tror inte att den är över i och med detta fall. Vi har nu fallit med 26 % från toppen hösten 2011, och 16 % hittills i år. Silvret däremot – guldets sprallige lillebror – har mer än halverats sedan toppen, och fallit 22 % i år. Den stora frågan nu är naturligtvis huruvida det ska fortsätta, och isåfall hur långt.
Vårt resonemang har som bekant varit att guldet handlas i stort sett enbart ur perspektivet att man vill tjäna pengar – man köper guld för att sälja dyrare till någon annan – och att guldet inte har massvis med andra användningsområden. Det är helt korrekt, som många kommenterat, att guld används till smycken och viss industriell nytta, men vi anser inte att dessa delar är de som sätter priset på guld. Det är guldets likviditet, enkla omsättningsbarhet, och det upplevda skyddet mot finansiell osäkerhet och inflation som driver priset. Och när alla har ”köpt färdigt” guld, då blir dynamiken väldigt speciell…
Om majoriteten av guld och silverspekulanter inte längre tror att de kan köpa för att sälja dyrare till någon annan så finns det få anledningar att hålla guld. Detta konstaterades redan 1980 då guldet gjort en fantastisk resa uppåt under ett par intensiva år. Då föll det tillbaks 65 % på drygt två år, och sen dröjde det drygt två decennier innan man började intressera sig för guld på allvar igen.
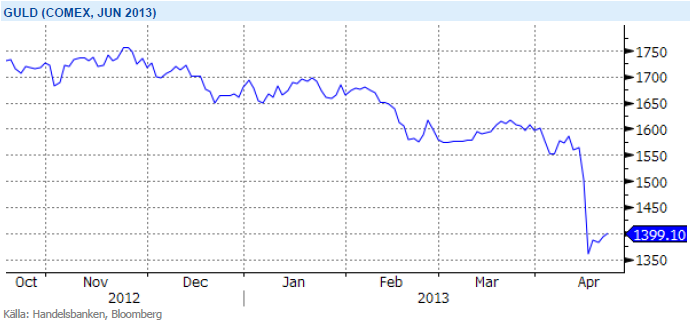
Trots det största raset på 30 år tror vi att förtroendet för guld håller på urholkas och att trenden nedåt fortsätter. Vi tror på: SHRT GULD H
Energi
Utsläppsrätterna – i händer på politiken
Elkontraktet Q3 2013 faller tillbaka med över 5 procent under veckan och det är mest till följd av utsläppsrätterna som rasar med över 34 procent. Ser vi till CO2-marknaden kan dess fortsatta existens nu stark ifrågasättas efter att parlamentet röstat emot kommissionens förslag om att minska överskottet på rätter. Förslaget om ”backloading” innebär att hålla tillbaka allokeringen om 900 miljoner rätter mot slutet av fas III för att balansera marknaden men det är nu mycket ovisst vad som kommer hända framöver. Sannolikt att det kommer att handlas på nuvarande nivå om 2-3 euro, dvs ca 2 öre per kWh på elpriset, så länge det finns hopp om att kommissionen kommer att agera på något sätt för att upprätthålla förtroendet.
På dessa låga nivåer finns dock inga större incitament att investera i minskade utsläpp! Vi kan liksom tidigare konstatera att denna marknad varit fel utformad från dag 1 och lägg därtill misslyckandet om att få till ett globalt direktiv – en central del för en fungerande marknad och långsiktig överlevnad. Vi behöver en mer överskådlig parameter vad gäller utsläppskostnader och dess inverkan på elpriset. Inte omöjligt att det istället blir någon form av skatt emot vilken nuvarande överskott kan kvittas, på så sätt bör kommissionen kunna erkänna sitt misslyckande och ändå rädda ansiktet.
Kort om oljan, som under veckan handlas under 100 USD: OPEC har varit väldigt aktiva i att styra priset efter stora prisfall och vi väntar oss att kartellen griper in vilken dag som helst och drar tillbaka produktion. Vi ser olja under 100 som klart köpvärd.
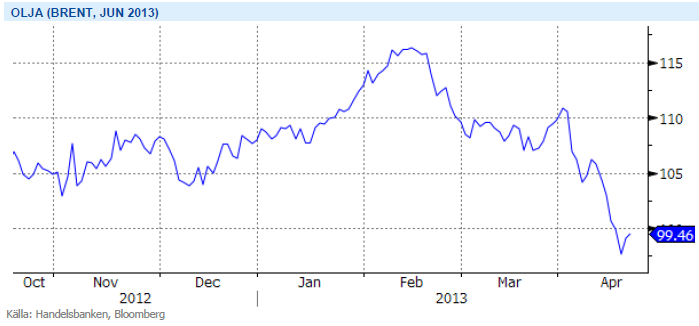
OPEC har tidigare aktivt och framgångsrikt försvarat prismålet 100-110 USD och vi väntar oss handling snarare än besked från kartellen inom kort. Konflikten mellan Israel och Iran är nästa skäl att förvänta sig högre oljepriser under H2. Vi tror på: LONG OLJA H
Livsmedel
Än är inte faran över för vetet
Vete avslutar denna vecka i princip oförändrad (svagt ned). Än är vi inte helt ute ur en känslig period för höstvetet och än är inte vårsådden helt klar i alla områden. Dock förbättras situationen (om än sakta) i de flesta områden och risken för bakslag minskar. Det är dock långt kvar till skörd och väldigt mycket kan ske fram tills dess – med väldigt små lager får eventuella väderproblem lätt stora och snabba effekter i form av stigande priser. I dagsläget finner vi dock inte skäl till större oro utan är kvar i vår tro om en relativt kraftig återhämtning av den globala spannmålsproduktionen – med följden att vi väntar oss lägre priser på vete längre fram på året.
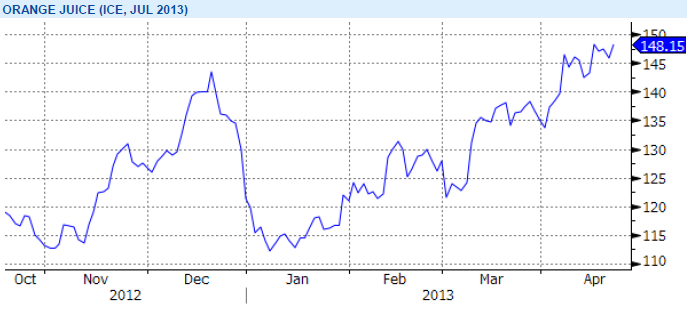
Under våren har priset på apelsinjuice skjutit i höjden p.g.a. minskad produktion som en följd av frost, bakteriesjukdom och torrt väder i Florida. I veckan nådde priset nästan årshögsta efter spekulationer kring en aktiv orkansäsong som närmar sig och som skulle hota den redan drabbade trädplanteringen i Florida ytterligare.
För kakao behåller vi vår vy och är fortsatt positiva efter signaler om stigande konsumtion. Siffror från National Confectioners Association i veckan ger fortsatt stöd till kakaopriset. Rapporten visade på ökat processande av kakao i Nordamerika för Q1-13 jämfört med samma period förra året.
Då priserna har på de stora jordbruksråvarorna soja, majs och vete har fallit tillbaka till nivåer före torkan i USA, tror vi att en nedsida är begränsad på kort sikt och därför är vi neutrala till utvecklingen för denna sektor.
Handelsbankens Råvaruindex
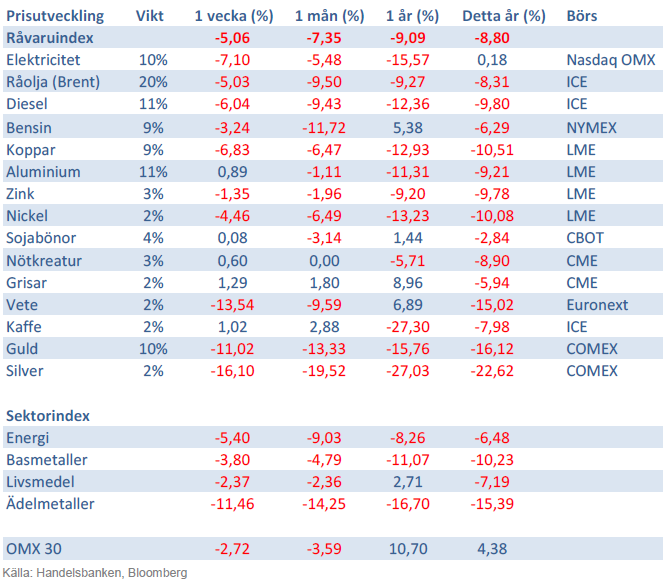
Handelsbankens råvaruindex består av de underliggande indexen för respektive råvara. Vikterna är bestämda till hälften från värdet av nordisk produktion (globala produktionen för sektorindex) och till hälften från likviditeten i terminskontrakten.
[box]SHB Råvarubrevet är producerat av Handelsbanken och publiceras i samarbete och med tillstånd på Råvarumarknaden.se[/box]
Ansvarsbegränsning
Detta material är producerat av Svenska Handelsbanken AB (publ) i fortsättningen kallad Handelsbanken. De som arbetar med innehållet är inte analytiker och materialet är inte oberoende investeringsanalys. Innehållet är uteslutande avsett för kunder i Sverige. Syftet är att ge en allmän information till Handelsbankens kunder och utgör inte ett personligt investeringsråd eller en personlig rekommendation. Informationen ska inte ensamt utgöra underlag för investeringsbeslut. Kunder bör inhämta råd från sina rådgivare och basera sina investeringsbeslut utifrån egen erfarenhet.
Informationen i materialet kan ändras och också avvika från de åsikter som uttrycks i oberoende investeringsanalyser från Handelsbanken. Informationen grundar sig på allmänt tillgänglig information och är hämtad från källor som bedöms som tillförlitliga, men riktigheten kan inte garanteras och informationen kan vara ofullständig eller nedkortad. Ingen del av förslaget får reproduceras eller distribueras till någon annan person utan att Handelsbanken dessförinnan lämnat sitt skriftliga medgivande. Handelsbanken ansvarar inte för att materialet används på ett sätt som strider mot förbudet mot vidarebefordran eller offentliggörs i strid med bankens regler.


Lower as OPEC+ keeps fast-tracking redeployment of previous cuts. Brent closed down 1.3% yesterday to USD 68.76/b on the back of the news over the weekend that OPEC+ (V8) lifted its quota by 547 kb/d for September. Intraday it traded to a low of USD 68.0/b but then pushed higher as Trump threatened to slap sanctions on India if it continues to buy loads of Russian oil. An effort by Donald Trump to force Putin to a truce in Ukraine. This morning it is trading down 0.6% at USD 68.3/b which is just USD 1.3/b below its July average.

Only US shale can hand back the market share which OPEC+ is after. The overall picture in the oil market today and the coming 18 months is that OPEC+ is in the process of taking back market share which it lost over the past years in exchange for higher prices. There is only one source of oil supply which has sufficient reactivity and that is US shale. Average liquids production in the US is set to average 23.1 mb/d in 2025 which is up a whooping 3.4 mb/d since 2021 while it is only up 280 kb/d versus 2024.
Taking back market share is usually a messy business involving a deep trough in prices and significant economic pain for the involved parties. The original plan of OPEC+ (V8) was to tip-toe the 2.2 mb/d cuts gradually back into the market over the course to December 2026. Hoping that robust demand growth and slower non-OPEC+ supply growth would make room for the re-deployment without pushing oil prices down too much.
From tip-toing to fast-tracking. Though still not full aggression. US trade war, weaker global growth outlook and Trump insisting on a lower oil price, and persistent robust non-OPEC+ supply growth changed their minds. Now it is much more fast-track with the re-deployment of the 2.2 mb/d done already by September this year. Though with some adjustments. Lifting quotas is not immediately the same as lifting production as Russia and Iraq first have to pay down their production debt. The OPEC+ organization is also holding the door open for production cuts if need be. And the group is not blasting the market with oil. So far it has all been very orderly with limited impact on prices. Despite the fast-tracking.
The overall process is nonetheless still to take back market share. And that won’t be without pain. The good news for OPEC+ is of course that US shale now is cooling down when WTI is south of USD 65/b rather than heating up when WTI is north of USD 45/b as was the case before.
OPEC+ will have to break some eggs in the US shale oil patches to take back lost market share. The process is already in play. Global oil inventories have been building and they will build more and the oil price will be pushed lower.
A Brent average of USD 60/b in 2026 implies a low of the year of USD 45-47.5/b. Assume that an average Brent crude oil price of USD 60/b and an average WTI price of USD 57.5/b in 2026 is sufficient to drive US oil rig count down by another 100 rigs and US crude production down by 1.5 mb/d from Dec-25 to Dec-26. A Brent crude average of USD 60/b sounds like a nice price. Do remember though that over the course of a year Brent crude fluctuates +/- USD 10-15/b around the average. So if USD 60/b is the average price, then the low of the year is in the mid to the high USD 40ies/b.
US shale oil producers are likely bracing themselves for what’s in store. US shale oil producers are aware of what is in store. They can see that inventories are rising and they have been cutting rigs and drilling activity since mid-April. But significantly more is needed over the coming 18 months or so. The faster they cut the better off they will be. Cutting 5 drilling rigs per week to the end of the year, an additional total of 100 rigs, will likely drive US crude oil production down by 1.5 mb/d from Dec-25 to Dec-26 and come a long way of handing back the market share OPEC+ is after.
The OPEC+ subgroup V8 this weekend decided to fully unwind their voluntary cut of 2.2 mb/d. The September quota hike was set at 547 kb/d thereby unwinding the full 2.2 mb/d. This still leaves another layer of voluntary cuts of 1.6 mb/d which is likely to be unwind at some point.
Higher quotas however do not immediately translate to equally higher production. This because Russia and Iraq have ”production debts” of cumulative over-production which they need to pay back by holding production below the agreed quotas. I.e. they cannot (should not) lift production before Jan (Russia) and March (Iraq) next year.
Argus estimates that global oil stocks have increased by 180 mb so far this year but with large skews. Strong build in Asia while Europe and the US still have low inventories. US Gulf stocks are at the lowest level in 35 years. This strong skew is likely due to political sanctions towards Russian and Iranian oil exports and the shadow fleet used to export their oil. These sanctions naturally drive their oil exports to Asia and non-OECD countries. That is where the surplus over the past half year has been going and where inventories have been building. An area which has a much more opaque oil market. Relatively low visibility with respect to oil inventories and thus weaker price signals from inventory dynamics there.
This has helped shield Brent and WTI crude oil price benchmarks to some degree from the running, global surplus over the past half year. Brent crude averaged USD 73/b in December 2024 and at current USD 69.7/b it is not all that much lower today despite an estimated global stock build of 180 mb since the end of last year and a highly anticipated equally large stock build for the rest of the year.
What helps to blur the message from OPEC+ in its current process of unwinding cuts and taking back market share, is that, while lifting quotas, it is at the same time also quite explicit that this is not a one way street. That it may turn around make new cuts if need be.
This is very different from its previous efforts to take back market share from US shale oil producers. In its previous efforts it typically tried to shock US shale oil producers out of the market. But they came back very, very quickly.
When OPEC+ now is taking back market share from US shale oil it is more like it is exerting a continuous, gradually increasing pressure towards US shale oil rather than trying to shock it out of the market which it tried before. OPEC+ is now forcing US shale oil producers to gradually back off. US oil drilling rig count is down from 480 in Q1-25 to now 410 last week and it is typically falling by some 4-5 rigs per week currently. This has happened at an average WTI price of about USD 65/b. This is very different from earlier when US shale oil activity exploded when WTI went north of USD 45/b. This helps to give OPEC+ a lot of confidence.
Global oil inventories are set to rise further in H2-25 and crude oil prices will likely be forced lower though the global skew in terms of where inventories are building is muddying the picture. US shale oil activity will likely decline further in H2-25 as well with rig count down maybe another 100 rigs. Thus making room for more oil from OPEC+.
The latest weekly report from the US DOE showed a substantial drawdown across key petroleum categories, adding more upside potential to the fundamental picture.

Commercial crude inventories (excl. SPR) fell by 5.8 million barrels, bringing total inventories down to 415.1 million barrels. Now sitting 11% below the five-year seasonal norm and placed in the lowest 2015-2022 range (see picture below).
Product inventories also tightened further last week. Gasoline inventories declined by 2.1 million barrels, with reductions seen in both finished gasoline and blending components. Current gasoline levels are about 3% below the five-year average for this time of year.
Among products, the most notable move came in diesel, where inventories dropped by almost 4.1 million barrels, deepening the deficit to around 20% below seasonal norms – continuing to underscore the persistent supply tightness in diesel markets.
The only area of inventory growth was in propane/propylene, which posted a significant 5.1-million-barrel build and now stands 9% above the five-year average.
Total commercial petroleum inventories (crude plus refined products) declined by 4.2 million barrels on the week, reinforcing the overall tightening of US crude and products.


Guld stiger till över 3500 USD på osäkerhet i världen

Lyten, tillverkare av litium-svavelbatterier, tar över Northvolts tillgångar i Sverige och Tyskland

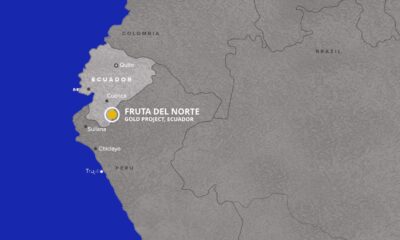
Lundin Gold hittar ny koppar-guld-fyndighet vid Fruta del Norte-gruvan

Alkane Resources och Mandalay Resources har gått samman, aktör inom guld och antimon
Breaking some eggs in US shale

USA inför 93,5 % tull på kinesisk grafit

Fusionsföretag visar hur guld kan produceras av kvicksilver i stor skala – alkemidrömmen ska bli verklighet

Westinghouse planerar tio nya stora kärnreaktorer i USA – byggstart senast 2030

Ryska militären har skjutit ihjäl minst 11 guldletare vid sin gruva i Centralafrikanska republiken

Eurobattery Minerals förvärvar majoritet i spansk volframgruva
-
 Nyheter3 veckor sedan
USA inför 93,5 % tull på kinesisk grafit
-
 Nyheter3 veckor sedan
Fusionsföretag visar hur guld kan produceras av kvicksilver i stor skala – alkemidrömmen ska bli verklighet
-
 Nyheter4 veckor sedan
Westinghouse planerar tio nya stora kärnreaktorer i USA – byggstart senast 2030
-
 Nyheter3 veckor sedan
Ryska militären har skjutit ihjäl minst 11 guldletare vid sin gruva i Centralafrikanska republiken
-
 Nyheter4 veckor sedan
Eurobattery Minerals förvärvar majoritet i spansk volframgruva
-

 Nyheter1 vecka sedan
Kopparpriset i fritt fall i USA efter att tullregler presenterats
-
 Nyheter1 vecka sedan
Lundin Gold rapporterar enastående borrresultat vid Fruta del Norte
-

 Nyheter3 veckor sedan
Kina skärper kontrollen av sällsynta jordartsmetaller, vill stoppa olaglig export