

Analys
SEB – Råvarukommentarer, 22 april 2013

Rekommendationer
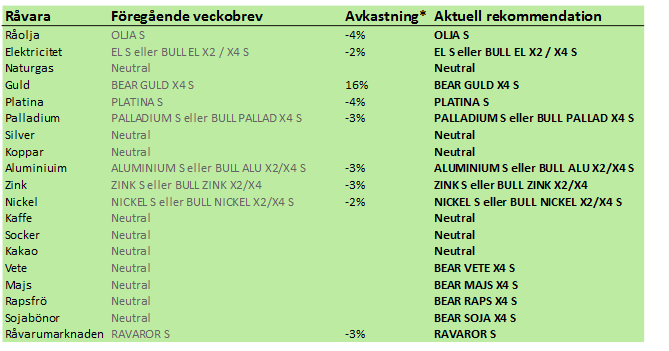
*) Avkastningen avser 1:1 råvarucertifikat där de ingår i rekommendationen. I den aktuella tabellen ovan har jag tagit prisförändringen den senaste veckan sedan det förra veckobrevet publicerades.
** Positionen följde omedelbart vid publiceringen enligt texten i förra veckobrevet.
Inledning
Kinas BNP-statistik för det första kvartalet publicerades i början av veckan. Den hamnade på 7.7%. Marknaden hade väntat sig en tillväxt på 8%. Men det var industriproduktionen som var den stora besvikelsen. Den kom in på 8.9% tillväxt. Marknaden hade väntat sig 10.9% tillväxt. Detta slog framförallt mot bas- och ädelmetaller och på oljepriset. Även sojapriset kom på fall.
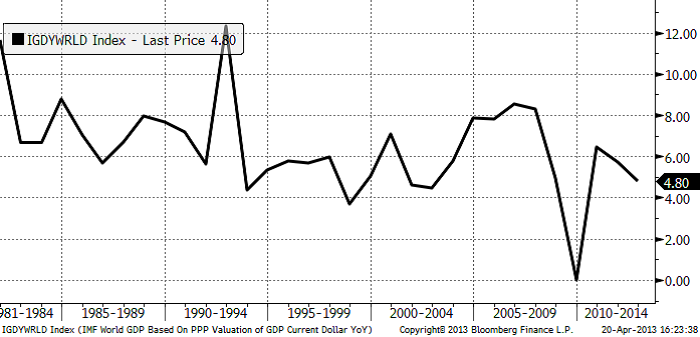
IMF sänkte därefter sin prognos för tillväxten i världen till endast 3.3%. Nedan ser vi historiken. 3.3% skulle placera global tillväxt på den näst lägsta nivån sedan 1980. Endast 2008 var sämre.
Råvarumarknaden styrs mest av hur det går i tillväxtländer. Om aktiemarknader är en ledande indikator för detta, låt oss titta på MSCI Emerging Markets index, guldpris och kopparpris.
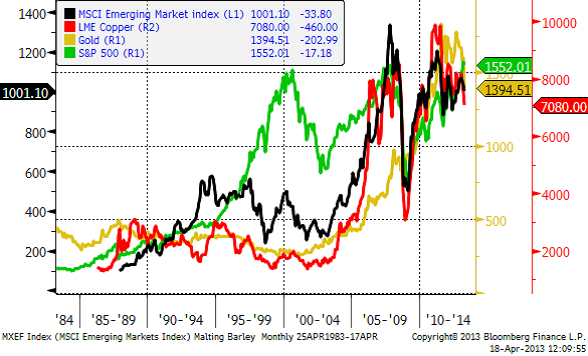
Vi ser att råvarupriserna (både koppar och guld) har mycket gemensamt med aktieindex i tillväxtländerna. S&P 500 har väldigt dålig samvariation med råvarupriser. Emerging Markets-aktieindex toppade senast i febaruari och har gått ner sedan dess, precis som råvarorna. Båda är en reflektion av att den ekonomiska aktiviteten i tillväxtländerna är lägre än förut.
Råvaruindex
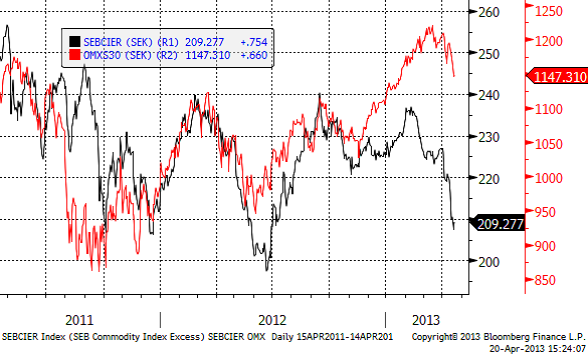
I diagrammet nedan ser vi SEB:s råvaruindex i svenska kronor och OMXS30 aktieindex. Vi ser att de gått åt helt olika håll fram till i veckan, då båda föll.
Den som vill investera i indexet och den investeringsstrategi som ligger bakom kan läsa mer om certifikatet RAVAROR S.
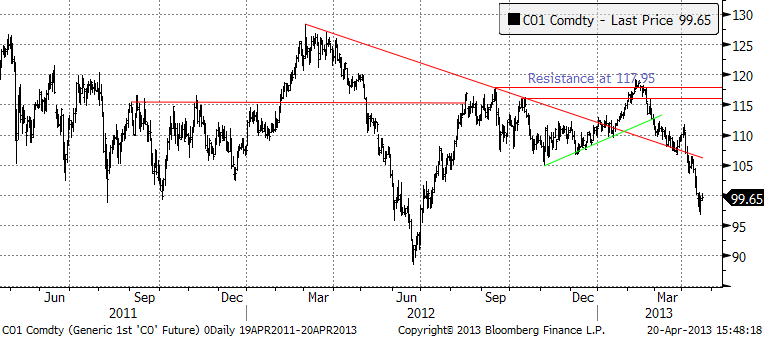
Råolja – Brent
Oljepriset inledde veckan med stora prisfall, liksom nästan alla råvaror. Mot slutet av veckan passade många konsumenter på att prissäkra sin konsumtion för de kommande månaderna. Vi tror att en stor del av detta hanns med förra veckan. Dessa företag är nu prissäkrade för flera månader framöver och med de köparna borta från köpsidan, finns risk för en förnyad svaghet i veckan som kommer.
Lagren och lagerförändringarna i USA den senaste rapportveckan ser vi nedan, enligt Department of Energy och American Petroleum Institute. Notera minskningen i råoljelagren!
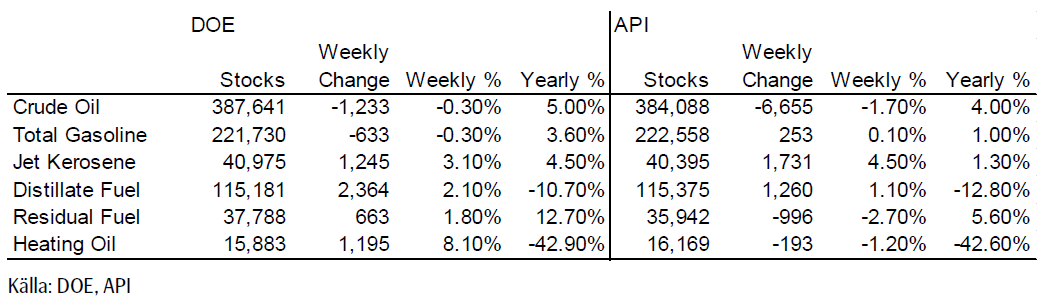
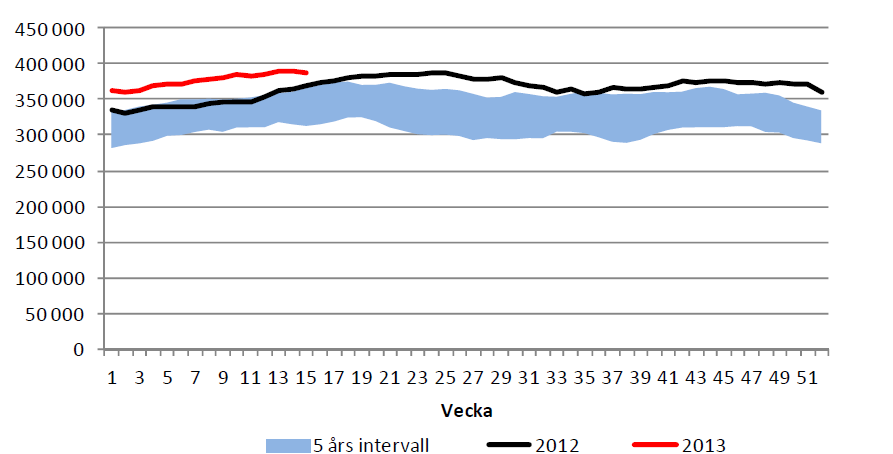
Nedan ser vi amerikanska råoljelager enligt DOE i tusen fat. Den svarta kurvan är 2012 års lagernivåer vecka för vecka och den lilla röda linjen är 2013 års nivå. Nu ser alltså en minskning.
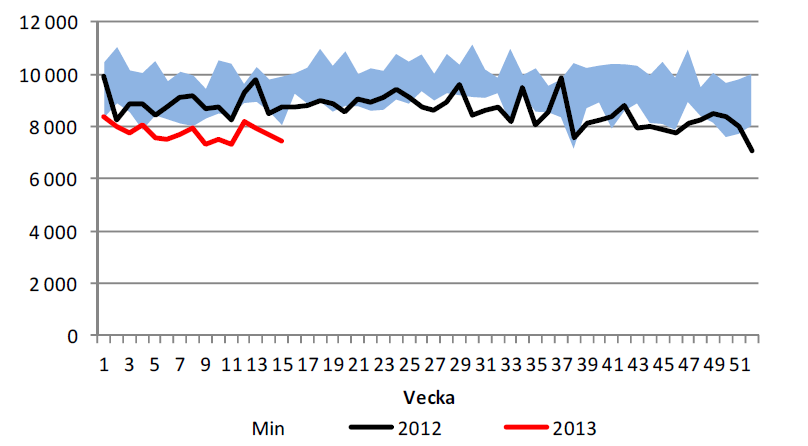
Importen har minskat för andra veckan i rad och ligger nu stadigt under 8 mbbl/dag.
Vi rekommenderar köp av OLJA S.
Elektricitet
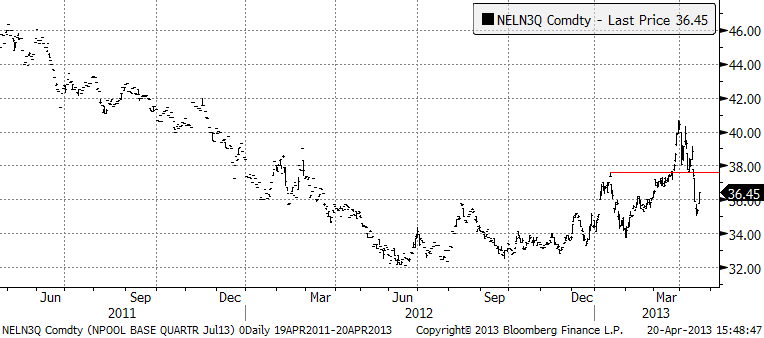
Priset på el som var uppe på över 40 euro per MWh, har sedan dess rekylerat ner ordentligt. Vi tror att detta är ett köptillfälle.
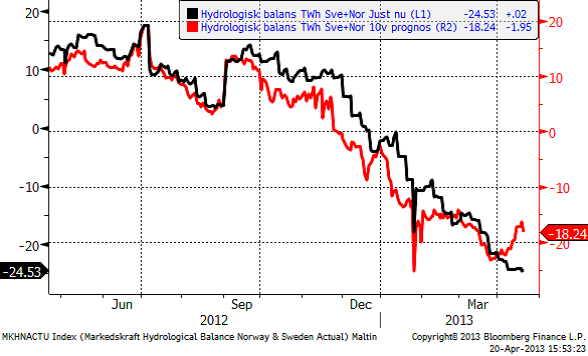
Den hydrologiska balansen har fortsatt att falla, men i väderleksprognosen har det kommit in betydligt mer nederbörd. Därför är prognosen för den hydrologiska balansen om 10 veckor högre än den aktuella. Medan aktuell hydrologisk balans visar – 24.53 TWh, ligger prognosen om 10 veckor på -18.24 TWh.
Priset har trots allt kommit ner så långt att vi tycker att det tredje kvartalet är köpvärt på de här nivåerna. Vi rekommenderar därför köp av EL S.
Naturgas
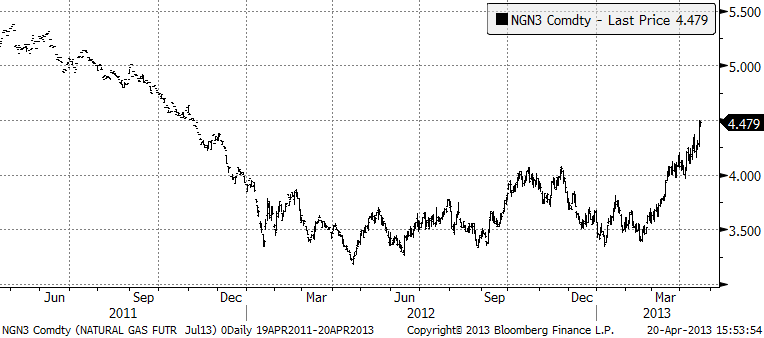
Nedan ser vi juli-kontraktet på naturgas i USA. Det har varit en fin resa uppåt och vår rekommendation av BULL NATGAS X4 S har gett +17% sedan förra veckan. Vi tror att 4.50 är ett visst motstånd och det kan naturligtvis bli någon slags rekyl på den här nivån. Men rent tekniskt finns det en god möjlighet att priset fortsätter upp mot 5 dollar. Vi fortsätter alltså att rekommendera köp av BULL NATGAS X4 S.
Guld och Silver
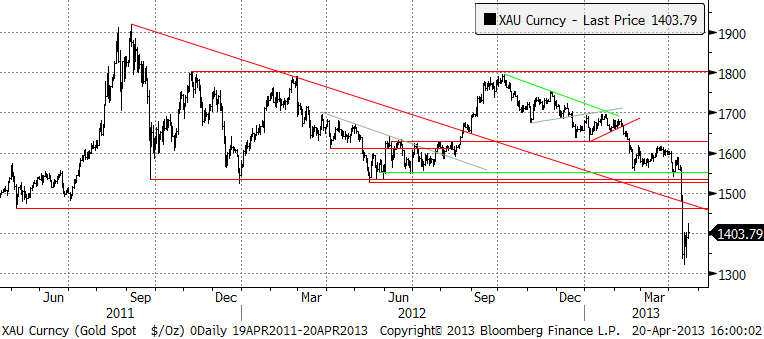
Måndagens prisnedgång, för en vecka sedan, blev den största sedan början av 1980-talet och den tredje största sedan Bretton-Woods-systemet föll samman 1971. Det är naturligt att en sådan kraftig nedgång följs av en kortvarig rekyl. Det vanligaste är att en sådan rekyl är kortvarig och sedan följs av ytterligare en nedgång. Det är inte säkert att det blir så den här gången, men det är i alla fall så som historien lär oss att oddsen brukar vara.
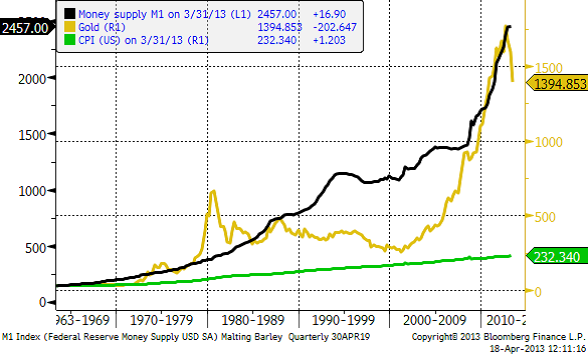
Penningmängden har via de olika QE-programmen i USA fått en boost sedan 2009. Detta har gjort att guldpriset dragit iväg mer än det kanske skulle ha gjort om bara demografi drev priset. Den senaste veckan har FED börjat tala om ett slut på QE och vi ser också att M1 i USA börjat plana ut. Historien visar att detta påverkar guldpriset negativt. Emellertid har förra veckan svaga ekonomiska statistik gjort att man faktiskt skulle kunna tänka sig en återgång till QE. Om det sker ger det nytt bränsle för en prisuppgång på guld.
Guldpriset har också kommit ner till produktionskostnaden för 2013 (cash costs + capex). Detta gör att nya projekt kan komma att skjutas på framtiden, med minskat utbud som konsekvens. Detta är också stödjande för priset.
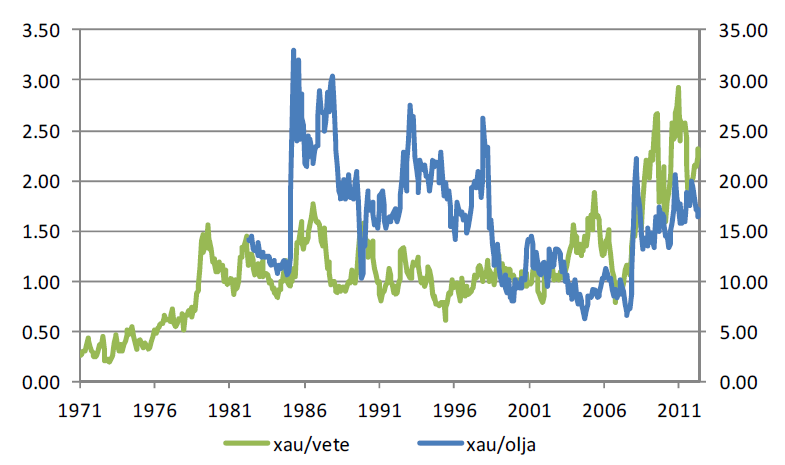
Ett annat sätt att studera priset på guld är att jämföra guldpriset med priset på andra råvaror. Nedan ser vi priset på guld dividerat med vete, respektive olja.
Nedan ser vi kvoten mellan guldpriset och kopparpriset.
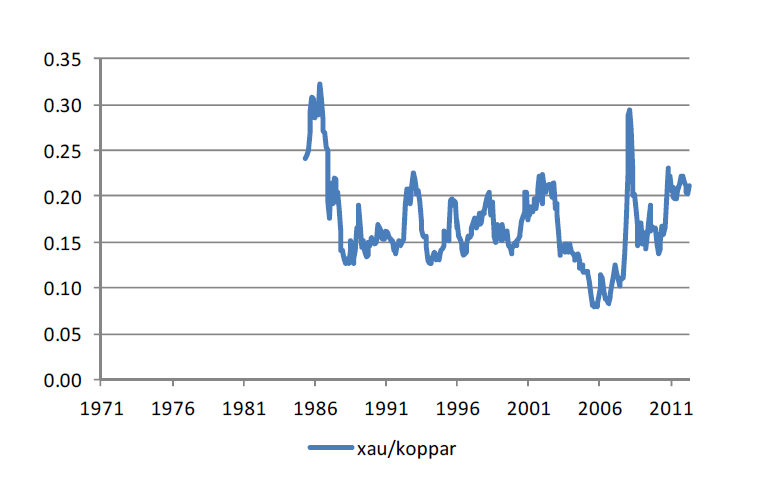
Om vi beräknar medelvärdet för kurvorna ovan och multiplicerar detta med aktuellt pris för respektive råvara, får vi ett ”medelvärde” för guldpriset.
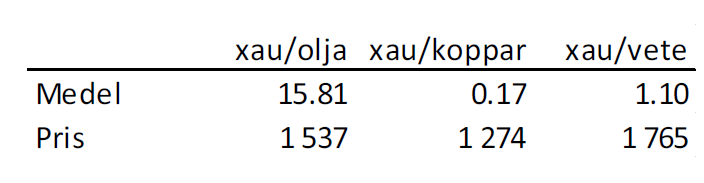
Vi ser att ”normalpriserna” 1537 dollar, 1274 dollar och 1765 dollar inte ligger så långt från dagens kursnivå. Ett aktuellt guldpris på 1403 dollar förefaller inte vara överdrivet ”högt” efter de prisfall som varit.
Om man ska sammanfatta läget kan vi se att många av de faktorer som har drivit upp priset sedan 2001 har tömts ut:
- Demografiska faktorer (Kinas tillväxt) börjar nå sitt slut. Kommer människorna i tillväxtländerna att fortsätta bli rikare?
- Gruvproduktionen ökar
- Gruvbolagen har köpt tillbaka alla sina hedgar
- Räntorna har gått ner till noll
Å andra sidan…
- QE kanske är över, penningmängdsfaktorn kanske är slut, men en eventuell inbromsning i USA:s ekonomi kan få FED att slå på kranarna igen.
- Räntenivåerna är rekordlåga och statsskulderna är rekordhöga. Det brukar leda till inflation.
- Prisfallet har fått guldpriset att gå ner till ”rimliga” nivåer jämfört med andra råvaror.
- Priset ligger inte långt över produktionskostnad
- Centralbanker har börjat köpa (det gjorde de dock också 1980
Den kortsiktiga psykologin i marknaden är den av baisse / nedgång. Men priset på guld är inte ”för högt” idag om inte resten av råvarumarknaden kraschar. Den som är långsiktig kan kanske leta köptillfällen, men inte än. Nedan ser vi kursdiagrammet för silver i dollar per troy ounce.
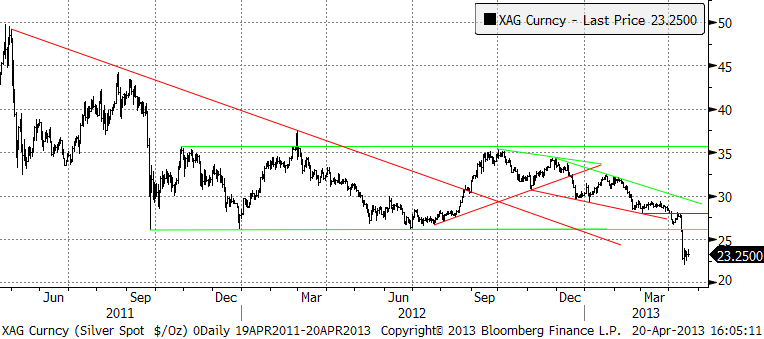
I det förra veckobrevet skrev vi att vi skulle gå kort om stödet vid 26 dollar bröts. Det bröts genast i måndags för en vecka sedan och vi ligger sedan dess köpta BEAR SILVER X4 S. Den tekniska analysen och beprövad erfarenhet, säger att priset borde gå ner till 20 dollar innan baissen är över.
Platina & Palladium
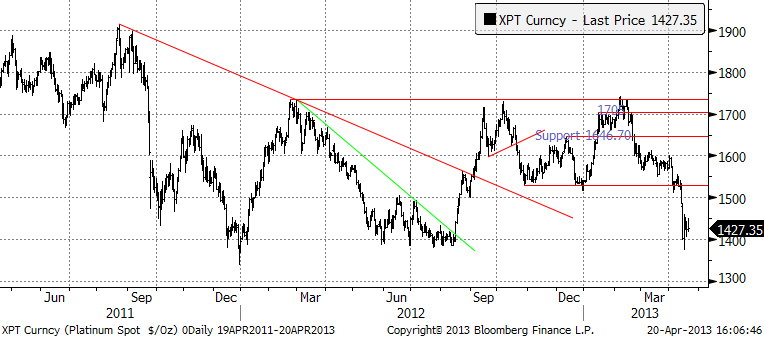
Platinapriset föll tillsammans med andra ädelmetaller. 1400 är sedan tidigare ett starkt stöd och där studsade priset i veckan som gick. Om den nivån bryts signaleras ytterligare prisnedgång.
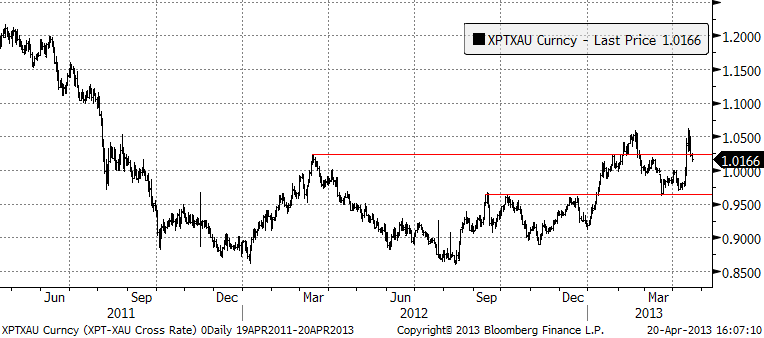
Priset på platina i termer av guld steg initialt när guldpriset föll, men föll sedan tillbaka. Det ser ändå ut som om platina ligger i en stigande trend i förhållande till guld.
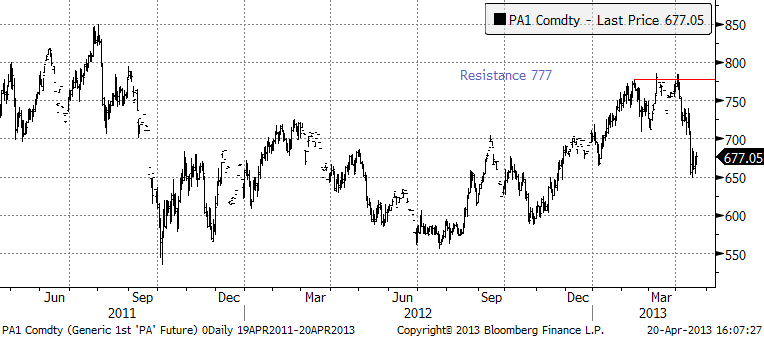
Palladium föll också ner med andra ädelmetaller. Priset nådde ner till 650 dollar innan det fann stöd. 650 dollar är egentligen inte någon ordentlig stödnivå. En sådan finns dock nere på 600 dollar. 700 dollar är däremot ett starkt motstånd på uppsidan.
Basmetaller
På metallmarknaden har blickarna generellt fokuserat på guldet och de ädla metallernas utveckling. Förra fredagens ras följdes av en lika stor nedgång under måndagen. Resten av veckan har passerat i återhämtningens tecken. Guldet uppvisade fyra uppdagar i rad fram till igår fredag. För basmetaller har utvecklingen varit blandad. Koppar ”smittades” av guldet och bröt viktiga tekniska nivåer som utlöste ett kraftigt fall i veckan. Nickel följde i viss mån efter. Aluminium och zink är däremot upp någon procent. Basmetallerna brukar röra sig olika mycket, men att de går åt olika håll är ganska ovanligt. Fundamental känns det dock ganska logiskt. De två senare metallerna ligger på väldigt låga nivåer ur ett kostnadsperspektiv, och möter starkt köpintresse på de här låga nivåerna. Nickel placerar vi i samma ”kostnadskategori” men där är överskottet för stort nu för att kunna hålla emot. Koppar har, som vi nämnt tidigare, fallhöjd och ligger mycket högre i marginalkostnad-pris perspektivet.
Koppar
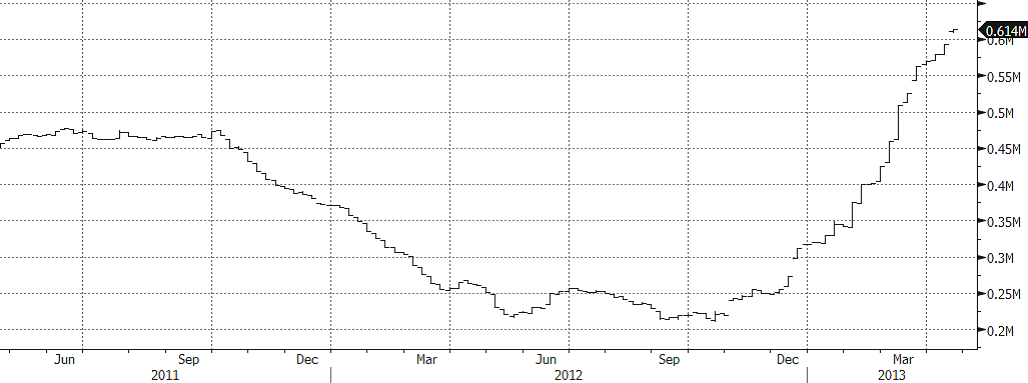
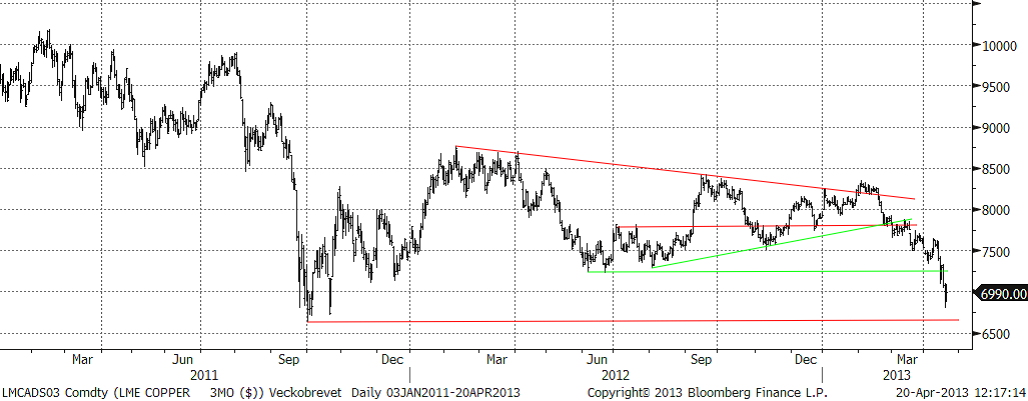
Vi har tidigare varnat för kopparmarknadens fundamentala situation som håller på att vända från flera års ”kroniska” underskott som ständigt gett stöd till priset, till att nu sannolikt ha ett visst överskott, med lagerbyggnad som följd. LME-lagret uppgång är ett tecken på detta. När priset bröt igenom stödet vid $7250 gick det undan. Guldraset spred sig till koppar.
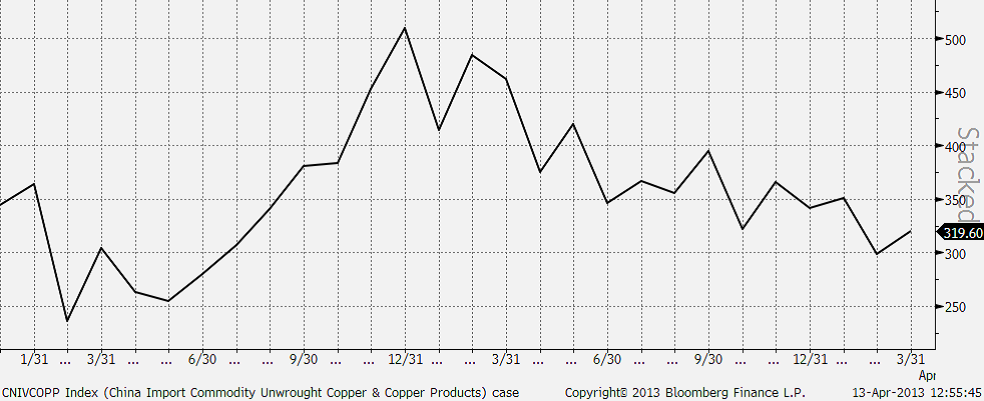
Veckans nivåer kring $6800 som lägst har inte setts sedan oktober 2011. Vi har nu fått den väntade korrigeringen. Tekniskt sett så (se grafen nedan) kommer nästa stödnivå in kring $6500. I vårt tycke har marknaden förmodligen korrigerat tillräckligt, med en anpassning till den ”nya” fundamentala situationen. Det blir nu extra intressant att följa Kinas import. Prisskillnaden mellan LME och Shanghai är till LME:s fördel, vilket brukar ledan till att kineserna ”passar på” att köpa. Frågan är dock hur stark efterfrågan är lokalt i Kina. Marknaden är lite tveksam. Vi bevakar nu kopparn och förebereder oss för att vända från neutral till köp.
LME-lager Koppar
Kinas kopparimport (Tton)
Den tekniska bilden har gett stöd till vår neutrala position. Vi är positiva till basmetaller på sikt men har avvaktat bättre köptillfällen alternativt väljer någon annan basmetall. Vi bevakar nu den nya stödnivån kring $6500.
Som vi skrivit tidigare tyder mycket på ökat utbud för koppar, vilket riskerar att begränsa uppgångspotentialen. Vi rekommenderar fortsatt en neutral position, men sätter koppar på bevakning för köp. För den som vill satsa på ett starkare tillväxtscenario (än konsensus) i Kina är koppar däremot alltid ett intressant alternativ.
Aluminium
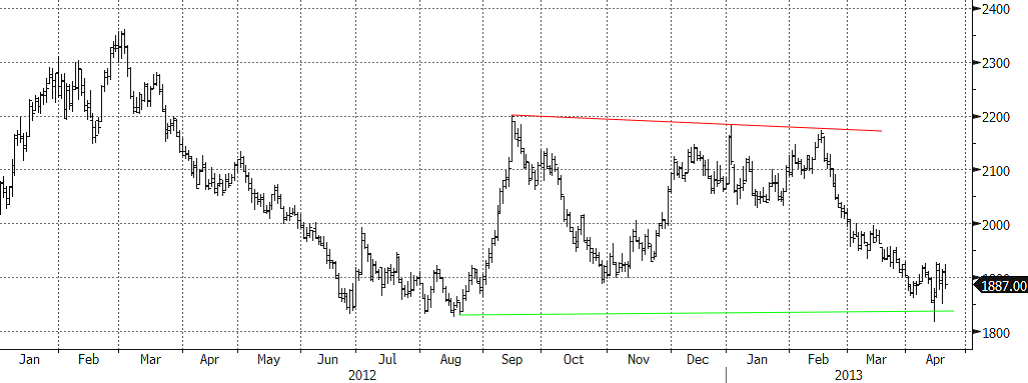
Som vi skrev i ingressen är det ovanligt att metallerna divergerar, och speciellt koppar och aluminium, som är upp 1,6 % i veckan samtidigt som koppar faller 5 %! Vi såg starka köpintressen under veckan från industriella förbrukarare som köper på termin. Andra aktörer rapporterar samma typ av flöden. Varje gång marknaden ”dippar” under $1900 finns köparna där.
Tekniskt sett ser också veckoutvecklingen stark ut, med en ny botten i kombination med en uppåt-stängning. Vi skrev att nivåerna är intressant på lite sikt (6-12 månader). Kortsiktigt kan det vara läge för en stark uppgång nästa vecka. För den riskbenägne kan det vara läge för att köpa ett kontrakt med hävstång (BULL ALU X2 eller X4). Långsiktigt är nivån väldigt intressant för kontraktet Aluminium S (utan hävstång).
Zink
Utvecklingen för zink påminner om den för aluminium. Upp 0,7 % i veckan. Vi är i grunden positiva till zinken, men bilden störs av rapporter om ett överraskande stort utbud i Kina. Produktionen ökar mer än väntat, framför allt med tanke på de låga priserna. Risken är att det dröjer innan priset vänder upp på allvar. Fundamentalt är zinken ”billig” ur ett kostnadsperspektiv och nuvarande nivåer är mycket intressanta på lite längre sikt (6-12 månader). I det perspektivet är Zink S (utan hävstång) att föredra.
Nickel
Marknaden är fortsatt tveksam till den fundamentala situationen. Vi har tidigare bl.a. hänvisat till kommentarer från fysiska aktörer som indikerar att ”det finns gott om nickel”, samtidigt som rapporter gör gällande att exporten av nickelmalm från Indonesien till Kina ökar igen, vilket riskerar att öka utbudet av s.k. Nickel Pig Iron i Kina (vilket i sin tur minskar efterfrågan på nickelbärande skrot och primärnickel). För några veckor sedan ryktades det om en omsvängning, då kinesiska producenter är snabba att ställa om produktionen, vilket ger ett naturligt stöd till nickelmarknaden. Nya rykten gör dock gällande att Kina börjat exportera Nickel Pig Iron. LME-lagret är på all time high. Även om nivån är attraktiv ur ett kostnadsperspektiv, varnade vi förra veckan att det allmänna stämningsläget riskerar att sätta ytterligare press. Det var precis vad som hände. Vi ligger nu precis på stödnivån. Om metallerna generellt öppnar positivt måndag morgon finns förutsättningar för en snabb uppgång, men det är hög risk. Ett genombrott på nedsidan kan också skapa ytterligare teknisk press. Tekniskt orienterade aktörer är sannolikt redan exponerade för fortsatt nedgång, så frågan är om det finns ytterligare kraft att pressa ned priset.
Risken/möjligheten är därför stor att det finns behov att köpa tillbaka korta positioner, vilket också talar för en kortsiktig uppgång nästa vecka. Det bästa rådet på nickel är att avvakta veckans inledning, för eventuella kortsiktiga köp av hävstångsprodukter.
Kaffe
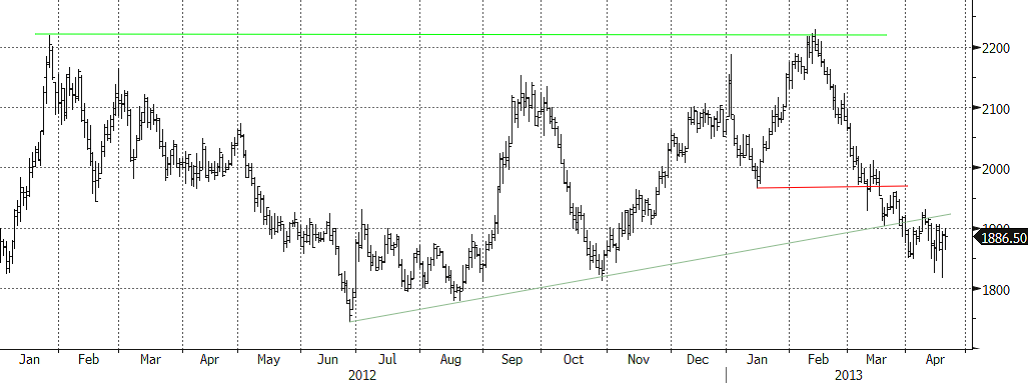
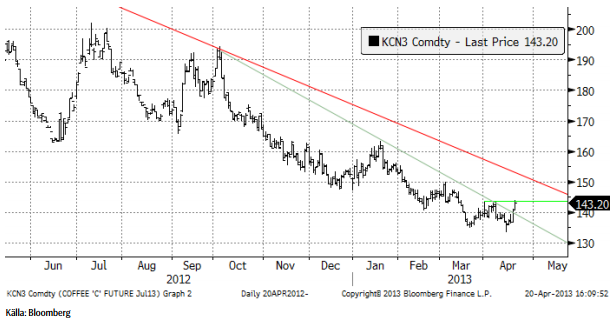
Kaffepriset (maj 2013) gick ner till nytt kontraktslägsta i början av veckan. Mot slutet av veckan vände dock priset upp. Därmed bröts ett av motstånden, men veckan stängde under den lilla toppen från månadsskiftet mars/april. Om den nivån överskrids har vi en liten positiv indikation på den trendvändning vi väntat på. Den stora nedåtgående motståndslinjen (röd i diagrammet) måste också helst brytas för att vi ska vilja köpa. Än så länge förhåller vi oss neutrala. Och väntar.
Socker
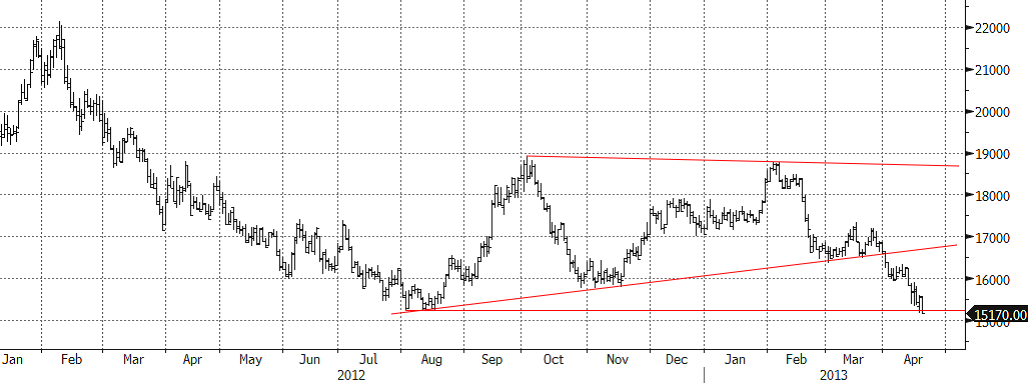
Sockerpriset (september 2013) föll i slutet av mars under 18 cent per pund. Marknaden har testat motståndet hela tiden. Samtidigt kommer rapporter från Brasilien om att regn ger ytterligare boost åt skördens storlek.
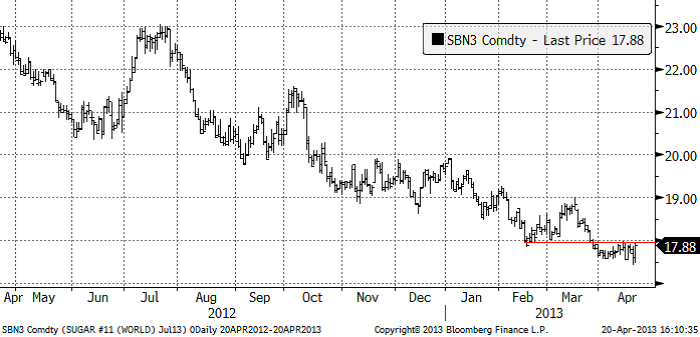
Vi fortsätter med neutral rekommendation.
[box]SEB Veckobrev Veckans råvarukommentar är producerat av SEB Merchant Banking och publiceras i samarbete och med tillstånd på Råvarumarknaden.se[/box]
Disclaimer
The information in this document has been compiled by SEB Merchant Banking, a division within Skandinaviska Enskilda Banken AB (publ) (“SEB”).
Opinions contained in this report represent the bank’s present opinion only and are subject to change without notice. All information contained in this report has been compiled in good faith from sources believed to be reliable. However, no representation or warranty, expressed or implied, is made with respect to the completeness or accuracy of its contents and the information is not to be relied upon as authoritative. Anyone considering taking actions based upon the content of this document is urged to base his or her investment decisions upon such investigations as he or she deems necessary. This document is being provided as information only, and no specific actions are being solicited as a result of it; to the extent permitted by law, no liability whatsoever is accepted for any direct or consequential loss arising from use of this document or its contents.
About SEB
SEB is a public company incorporated in Stockholm, Sweden, with limited liability. It is a participant at major Nordic and other European Regulated Markets and Multilateral Trading Facilities (as well as some non-European equivalent markets) for trading in financial instruments, such as markets operated by NASDAQ OMX, NYSE Euronext, London Stock Exchange, Deutsche Börse, Swiss Exchanges, Turquoise and Chi-X. SEB is authorized and regulated by Finansinspektionen in Sweden; it is authorized and subject to limited regulation by the Financial Services Authority for the conduct of designated investment business in the UK, and is subject to the provisions of relevant regulators in all other jurisdictions where SEB conducts operations. SEB Merchant Banking. All rights reserved.

Market is starting to take US/Iran headlines with a pinch of salt. Brent crude rose $2.8/b yesterday to an official close of $112.1/b. But after that it traded as low as $108.05/b before ending late night at around $109.7/b. Through the day it traded in a range of $106.87 – 112.72/b amid a flurry of news or rumors from Iran and the US. ”US temporary sanctions during negotiations” (falls alarm). ”We will bomb Iran” (not anyhow),… etc. While the market is still fluctuating to this kind of news flow, it is starting to take such headlines with a pinch of salt.

We’ll see. Maybe, maybe not. The Brent M1 contract is trading at $110.2/b this morning which very close to the average ticks through yesterday of $110.4/b.
Trump with bearish, verbal intervention whenever Brent trades above $110/b it seems. What seems to be a pattern is that Trump states something like ”very good negotiations going on with Iran”, ”New leaders in Iran are great,..”, ”Great progress in negotiations,…”, ”Deal in sight,..” etc whenever the Brent M1 contract trades above $110/b. An effort to cool the market. These hot air verbal interventions from Trump used to have a heavy bearish impact on prices, but they now seems to have less and less effect unless they are backed by reality.
As far as we can see there has been no real progress in the negotiations between the US and Iran with both sides still standing by their previous demands.
Iran is getting stronger while the cease fire lasts making a return to war for Trump yet harder. Iran is naturally in constant preparation for a return to war given Trump’s steady threats of bombing Iran again. Iran is naturally doing what ever is possible to prepare for a return to war. And every day the cease fire lasts it is better prepared. This naturally makes it more and more difficult and dangerous for the US to return to warring activity versus Iran as the consequences for energy infrastructure in the Persian Gulf will be more and more severe the longer the cease fire lasts. Israel seems to see it this way as well. That the war is not won and that current frozen state of a cease fire gives Iran opportunity to rebuild military and politically.
Global inventories are drawing down day by day. How much? In the meantime the Strait of Hormuz stays closed. There is varying measures and estimates of how much global inventories are drawing down. Our rough estimate, back of the envelope, is that global inventories are drawing down by at least some 10 mb/d or about 300 mb/d in a balance between loss of supply versus demand destruction. Other estimates we see are a monthly draw of 250-270 mb/d. The IEA only ’measured’ a draw in global observable stocks of 117 mb in April with oil on water rising 53 mb while on shore stocks fell 170 mb. But global stocks are hard to measure with large invisible, unmeasured stocks. As such a back of the envelope approach may be better.
Oil products is what the world is consuming. Oil product prices likely to rise while product stocks fall. Strategic Petroleum Reserves (SPR) are predominantly crude oil. Discharging oil from OECD SPR stocks, a sharp reduction in Chinese crude imports and a reduction in global refinery throughput of 6-7 mb/d has helped to keep crude oil markets satisfactorily supplied. But global inventories are drawing down none the less. And oil products is really what the world is consuming. So if global refinery throughput stays subdued, then demand will eventually have to match the supply of oil products. The likely path forward this summer is a steady draw down in jet fuel, diesel and gasoline. Higher prices for these. Then, if possible, higher refinery throughput and higher usage of crude in response to very profitable refinery margins. And lastly sharper draw in crude stocks and higher prices for these. But some 6 mb/d of oil products used to be exported through the Strait of Hormuz. And it may not be so easy to ramp up refinery activity across the world to compensate. Especially as Ukraine continues to damage Russian refineries as well as Russian crude production and export facilities.
Watch oil product stocks and prices as well as Brent calendar 2027. What to watch for this summer is thus oil product inventories falling and oil product premiums to crude rising. Another measure to watch is the Brent crude 2027 contract as it rises steadily day by day as the Strait of Hormuz stays closed and global oil inventories decline. The latter is close to the highest level since the start of the war and keeps rising.
The Brent M1 contract and the Brent 2027 prices and current price of jet fuel in Europe (ARA). All in USD/b

Our back of the envelope calculation of the global shortage created by the closure of the Strait of Hormuz. Note that 3.5 mb/d of discharge from SPR is also a draw. Note also that ’Forced demand loss’ of 2.5 mb/d is probably temporary and will fall back towards zero as logistics are sorted out leaving ’Price demand loss’ to do the job of balancing the market. Thus a shortfall of at least 9 mb/d created by the closure. More if SPR discharge is included and more if Forced demand loss recedes.

Brent is climbing higher. Front-month is at USD 106.3/bl this morning, close to a weekly high and a USD 9/bl jump from Mondays open. This is the move we flagged as a risk earlier in the week: the market shifting from ”a deal is around the corner” to ”this is going to take longer than we thought”.

Analyst Commodities, SEB
During April, rest-of-year Brent remained remarkably stable around USD 90/bl. A stability which rested on one single assumption: the SoH reopens around 1 May. That assumption is now slowly falling apart.
As we highlighted yesterday: every week of delay beyond 1 May adds (theoretically) ish USD 5/bl to the rest-of-year average, as global inventories draw 100 million barrels per week. i.e., a mid-May reopening implies rest-of-year Brent closer to USD 100/bl, and anything pushing into June or July takes us meaningfully higher.
What’s changed in the last 48 hours:
#1: The US military has formally warned that clearing suspected sea mines from SoH could take up to six months. That is a completely different timescale from what the financial market is pricing. Even a political deal tomorrow does not immediately reopen the strait.
#2: Trump has shifted his tone from urgency to ”strategic patience”. In yesterday’s press conference: ”Don’t rush me… I want a great deal.” The market is reading this as a president no longer feeling pressured by timelines, with the naval blockade running in the background.
#3: So far, the military activity is escalating, not de-escalating. Axios reports Iran is laying more mines in SoH. The US 3rd carrier strike group (USS George H.W. Bush) is arriving with two countermine vessels. Trump yesterday ordered the US Navy to destroy any Iranian boats caught laying mines. While CNN reports that the Pentagon is actively drawing up plans to strike Iranian SoH capabilities and individual Iranian military leaders if the ceasefire collapses. i.e., NOT a attitude consistent with an imminent deal!
Spot crude and product prices eased off the early-April highs on a combination of system rerouting and deal optimism. Both now weakening. Goldman estimates April Gulf output is reduced by 14.5 mbl/d, or 57% of pre-war supply, a number that keeps getting worse the longer this drags on.
Demand-side adaptation is ongoing: S. Korea has cut its Middle East crude dependence from 69% to 56% by pulling more from the Americas and Africa, and Japan is kicking off a second round of SPR releases from 1 May. But SPRs are finite.
Ref. to the negotiations, we should not bet on speed. The current Iranian leadership is dominated by genuine hardliners willing to absorb economic pain and run the clock to extract concessions. That is not a setup for a rapid resolution. US/Israeli media briefings keep framing the delay as ”internal Iranian divisions”, the reality is more complicated and points toward weeks and months, not days.
Our point is that the complexity is large, and higher prices have only just started (given a scenario where the negotiations drag out in time). The market spent April leaning on the USD 90/bl rest-of-year assumption; that case is diminishing by the hour. If ”early May reopening” is replaced by ”June, July or later” over the next week or two, both crude and products have meaningful room to reprice higher from here. There is a high risk being short energy and betting on any immediate political resolution(!).
Down on Friday. Up on Monday. The Brent June crude oil contract traded down 5.1% last week to a close of $90.38/b. It reached a high of $103.87/b last Monday and a low of $86.09/b on Friday as Iran announced that the Strait of Hormuz was fully open for transit. That quickly changed over the weekend as the US upheld its blockade of Iranian oil exports while Iran naturally responded by closing the SoH again. The US blew a hole in the engine room of the Iranian ship TOUSKA and took custody of the ship on Sunday. Brent crude is up 5.6% this morning to $95.4/b.
The cease-fire is expiring tomorrow. The US has said it will send a delegation for a second round of negotiations in Islamabad in Pakistan. But Iran has for now rejected a second round of talks as it views US demands as unrealistic and excessive while the US is also blocking the Strait of Hormuz.
While Brent is up 5% this morning, the financial market is still very optimistic that progress will be made. That talks will continue and that the SoH will fully open by the start of May which is consistent with a rest-of-year average Brent crude oil price of around $90/b with the market now trading that balance at around $88/b.
Financial optimism vs. physical deterioration. We have a divergence where the financial market is trading negotiations, improvements and resolution while at the same time the physical market is deteriorating day by day. Physical oil flows remain constrained by disrupted flows, longer voyage times and elevated freight and insurance costs.
Financial markets are betting that a US/Iranian resolution will save us in time from violent shortages down the road. But every day that the SoH remains closed is bringing us closer to a potentially very painful point of shortages and much higher prices.
The US blockade is also a weapon of leverage against its European and Asian allies. When Iran closed the SoH it held the world economy as a hostage against the US. The US blockade of the SoH is of course blocking Iranian oil exports. But it is also an action of disruption directed towards Europe and Asia. The US has called for the rest of the world to engaged in the war with Iran: ”If you want oil from the Persian Gulf, then go and get it”. A risk is that the US plays brinkmanship with the global oil market directed towards its European and Asian allies and maybe even towards China to force them to engage and take part. Maybe unthinkable. But unthinkable has become the norm with Trump in the White House.


Sommarväder skapar prisrally på elbörsen
Oil product price pain is set to rise as the Strait of Hormuz stays closed into summer

Solkraften pressar elpriserna dagtid

Michel Gubel ger sin syn på oljemarknaden