

Analys
SEB – Råvarukommentarer, 15 april 2013

Rekommendationer
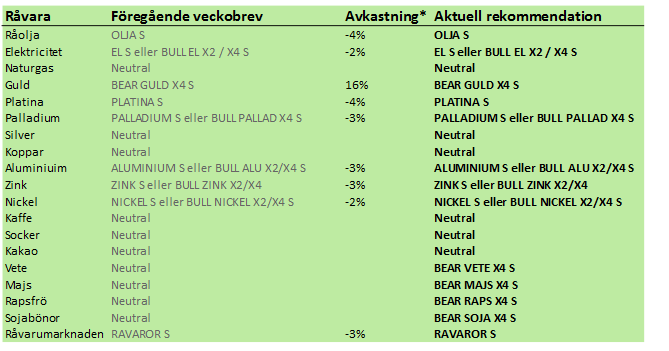
*) Avkastningen avser 1:1 råvarucertifikat där de ingår i rekommendationen. I den aktuella tabellen ovan har jag tagit prisförändringen den senaste veckan sedan det förra veckobrevet publicerades.
Inledning
Förra veckan avslutades med stor dramatik då alla råvarusparares “favoritråvara” guld, föll kraftigt. Råoljan noterade också stora prisfall. Många råvaror befinner sig i fallande trender – antingen i början eller (förmodligen) i slutet som kaffe och socker.
Vi ligger huvudsakligen kort råvarumarknaden. Efter de tunga rapporternas från det amerikanska jordbruksdepartemetet ligger vi köpta BEAR på vete, majs och sojabönor. Guldet ligger vi kort och om silver bryter nedåt under 26 dollar ligger vi kort den också.
Råvaruindex
I diagrammet nedan ser vi SEB:s råvaruindex i svenska kronor och OMXS30 aktieindex. Vi ser att de gått åt helt olika håll. Man ska naturligtvis inte köpa in i fallande råvarumarknad, men det kan vara en god idé att så småningom vikta upp råvaror (som ju tappar vikt i en portfölj som tidigare investerat i både aktier och råvaror). Yale / NBER –forskarna Gorthon och Rouwenhorst visade ju redan i sin artikel från 2004 att råvarumarknaden tenderar att vara sencyklisk i förhållande till aktier.
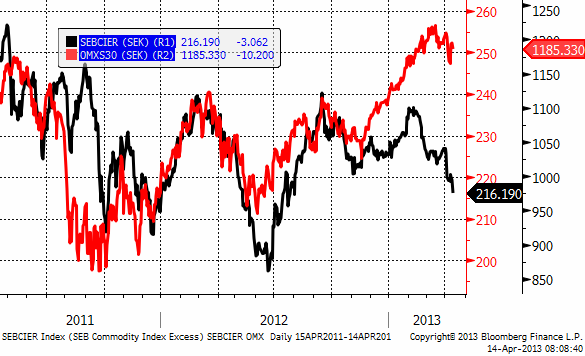
Den som vill investera i indexet och den investeringsstrategi som ligger bakom kan läsa mer om certifikatet RAVAROR S.
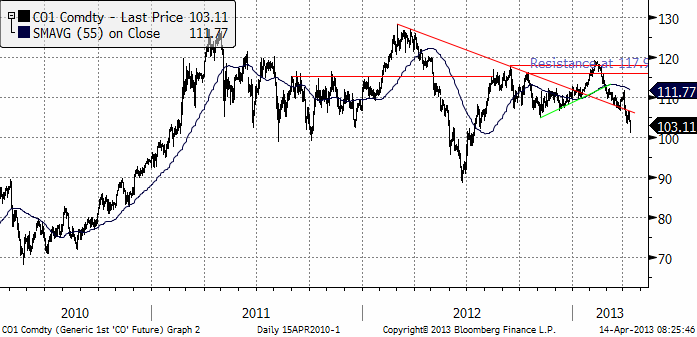
Råolja – Brent
Oljeprisets nedgång från 120 dollar accellererade och ledde till fritt fall i fredags när priset var nere på strax över 101 dollar per fat. Fram till stängning repade sig dock marknaden och stängde på 103 dollar. Det är inte helt ovanligt i fallande marknader att fyndköpare kommer in på slutet av dagen. Det brukar följas av förnyade nedgångar när börsen öppnar igen nästa handelsdag.
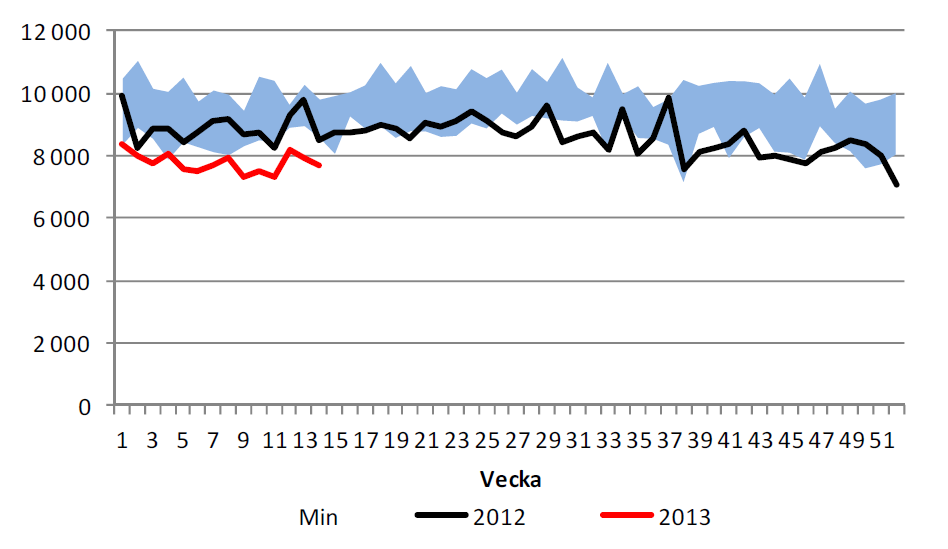
Lagren och lagerförändringarna i USA den senaste rapportveckan ser vi nedan, enligt Department of Energy och American Petroleum Institute.
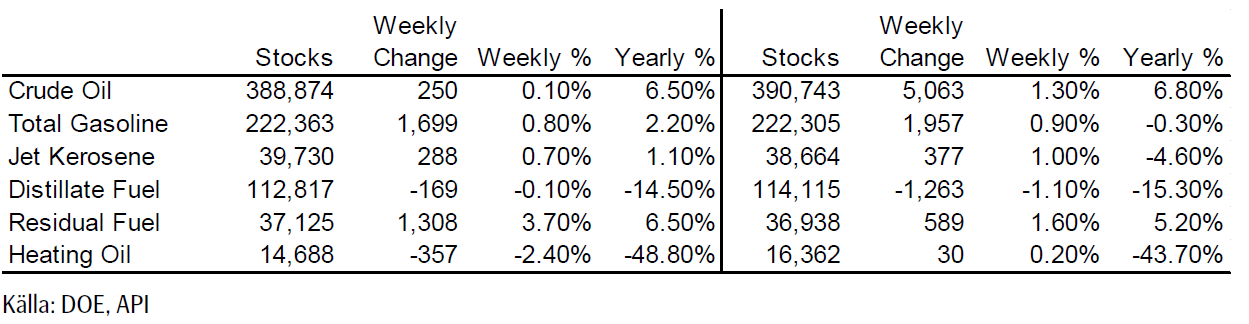
Nedan ser vi amerikanska råoljelager enligt DOE i tusen fat. Den svarta kurvan är 2012 års lagernivåer vecka för vecka och den lilla röda linjen är 2013 års nivå. Vi ser att lagernivåerna fortsätter att vara högre än de varit sedan 2007 för den här tiden på året. Säsongsmässigt är det tid för lagerökningar och de senaste veckornas lagerökning har varit lite mindre än den årets tidigare trend skulle ha medfört. Detta borde i sig vara ”bullish”.
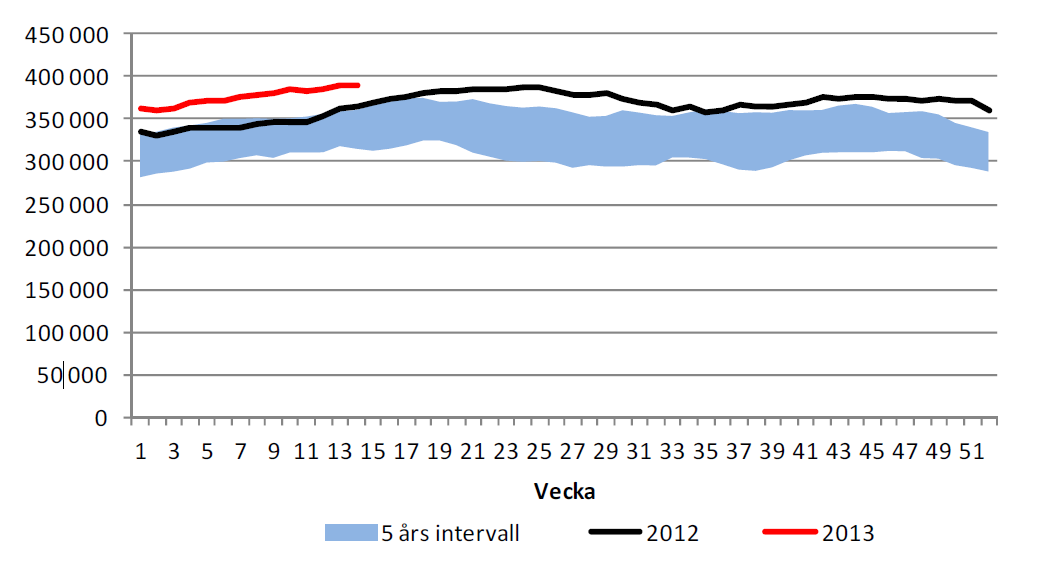
Importen har minskat och ligger återigen under 8 mbbl/dag.
Vi rekommenderar köp av OLJA S, men inte av BULL OLJA S. Anledningen till denna skillnad och att vi rekommenderar köp av OLJA S är för att rabatten på terminerna innebär en stadig intäkt om ca 6% till 7% per år + ränta på kapitalet. Just nu är marknaden så svag överlag att jag tycker att man ska vänta med nya köp.
Elektricitet
Priset på el som var uppe på över 40 euro per MWh, rekylerade ner till stödet (gamla motståndet) i veckan som gick. Betydligt blötare väder har kommit in i prognoserna.
Den hydrologiska balansen har fortsatt att falla, men detta är inte detsamma som prognosen.
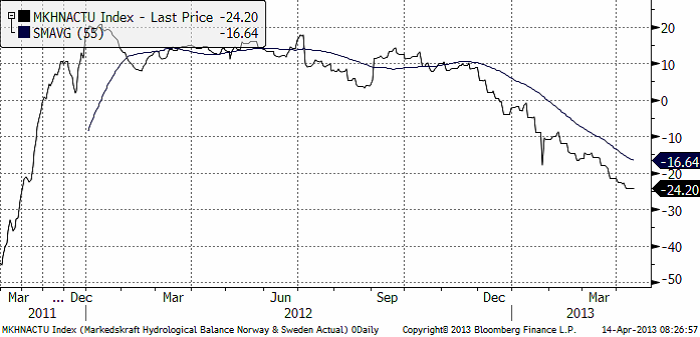
Om priset kommer ner kan det vara läge att gå in och köpa. Tekniskt är den långsiktiga trenden uppåtriktad och nedgångar ska – än så länge – betraktas som rekyler och köptillfällen.
Naturgas
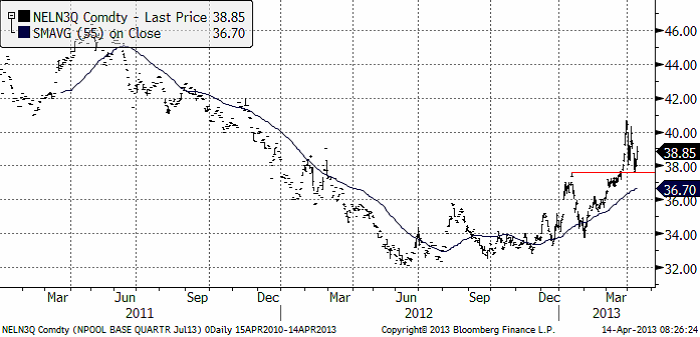
Det är kallt även i USA och naturgaspriset har påverkats av detta även där. Naturgasterminen på NYMEX (maj 2013) har handlats upp ordentligt och testar nu 4 dollar, där priset vänt ner två gånger tidigare. Vi fortsätter att hålla oss neutralt till naturgasen – men skulle ett brott ske av 4 dollar – är det en tydlig köpsignal. Vi ser kursdiagrammet nedan:
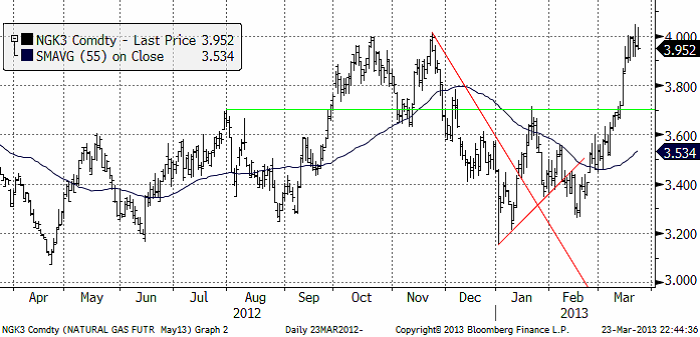
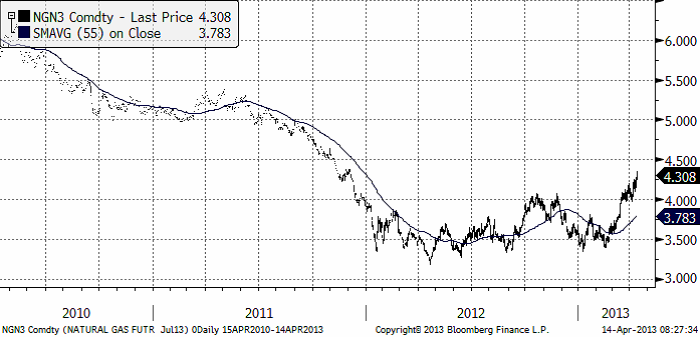
Nedan ser vi juli-kontraktet på naturgas i USA. Medan ”mainstream” media börjar uppmärksamma utbudseffekten från den nya tekniken som kallas för hydraulic fracturing eller ”fracking” tillämpad på gasförande skifferlager, har priset börjat bete sig påtagligt ”bullish”. Baserat på tekniska analys och det faktum att uppgången sker när mainstream media skriver om för evigt låga gaspriser, rekommenderar vi köp av BULL NATGAS X4 S.
Guld och Silver
Fredagen slutade i mega-baisse för ädelmetaller. Att fallet blev så kraftigt beror till stor del på att ett avgörande tekniskt stöd bröts. Man kunde nästan se hur säljare tryckte på för att pressa ner priset under stödet och hur fallet för några ögonblick hejdades en bit under när dessa säljare täckte en del av den korta positionen. Skådespelet gick fort och priset tog stora kliv nedåt på minutbasis.
Cypern ska sälja 10 ton guld, värderat till 400 miljoner euro, sade EU Kommissionen den 9 april. Cyperns centralbank svarade att man inte ens diskuterat en försäljning av det mesta av landets 13.9 ton. Nyheten landade inte heller väl i guldmarknaden. ECB.s Mario Draghi sade i fredags att pengarna måste användas för att täcka förlusterna på akuta lån till cypriotiska banker. En försäljning rycker alltså allt närmare. Den här nyheten togs som motiv till att knäcka stödet på guldet. 10 ton hit eller dit är ändå ganska lite i sammanhanget. Förra året köpte centralbanker 534.6 ton guld till sina valutareserver enligt the World Gold Council. Det är den högsta nivån sedan 1964.
Och är det bullish eller bearish att centralbankerna senfärdigt börjat köpa guld? Ser vi den senaste gången de började köpa guld, 1980, signalerade det slutet på 70-talets hausse, när priset på guld (i dollartermer) 20-faldigades. Centralbanker var nettosäljare genom hela uppgången från 1973 till 1980. Man kan därför inte rakt av tolka det som positivt för guldpriset att de mest långsamma aktörerna börjat köpa.
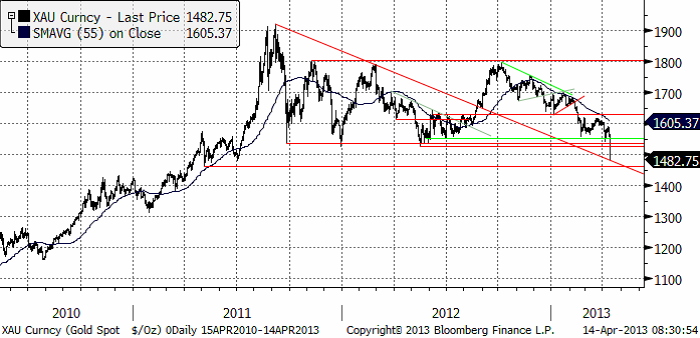
Trots dramatiken finns ändå tekniska stöd precis på den nivå som prisfallet stannade på i fredags, som vi ser i diagrammet. Det finns också stöd precis under fredagens nivå. Det mest sannolika tror jag ändå är att prisfallet stannar upp och vi får se ”sidledes” kursutveckling den närmaste tiden, men kanske med lite större dagsrörelser än vanligt. Naturligtvis ligger vi kvar i BEAR GULD X4 S. Dynamiken är helt klart på nedsidan.
Elektroniskt handlat guld är likvitt, till skillnad från tackor och mynt. Förändringar i sentimentet till det sämre för guld kan idag snabbt leda till stora flöden. Nedan ser vi antalet utestående fondandelar till det börshandlade och fysiskt backade depåbeviset GLD – och guldpriset.
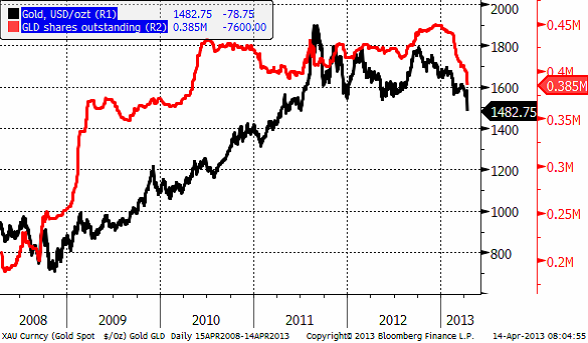
Minskningen av antalet utestående depåbevis av GLD är den starkaste de senaste fem åren. Till viss del beror detta på att placerare konverterat sina depåbevis till tackor, en säkrare form om man liksom italienare är orolig för en skatt på finansiellt sparande som hände på 90-talet i Italien och nu sker på Cypern. Det hände även i Sverige, när staten tog ut ”överskottsmedel” (samma ord som EU Kommissionen använder för Cyperns guldreserv) från AP-fonderna för några år sedan. En stor del av minskningen av GLD-depåbevis är sannolikt också rena försäljningar, som alltså lett till försäljning av guld på London Bullion Market.
Guld är trots allt en värdebevarare i inflationsskyddad mening och eftersom penningmängden ökar så kraftigt i alla stora och sparkapitalsfulla ekonomier, borde guld vara en attraktiv tillgång. Traditionell monetarism säger att om man inte förändrar antalet varor, men ökar mängden pengar, måste priset i dessa pengar stiga på varorna. Nedan ser vi M1 i USA. M1 är den smalaste måttet på penningmängd och mäter bara mynt, sedlar och bankinlåning som har betalningsmöjligheter kopplade till sig (checkar eller kort).
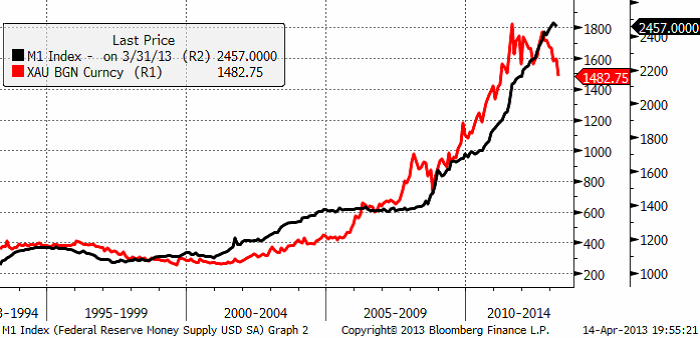
Vi ser att det tycks finnas ett bra samband mellan M1 och guldpriset, trots att vi bara ser till M1 i USA.
Nedan ser vi kursdiagrammet för silver i dollar per troy ounce. Silverpriset föll till 26 dollar, precis på det tekniska stödet från 2011. Ett brott av det stödet skulle ge en möjlighet, enligt den tekniska analysen, för en nedgång till 20 dollar.
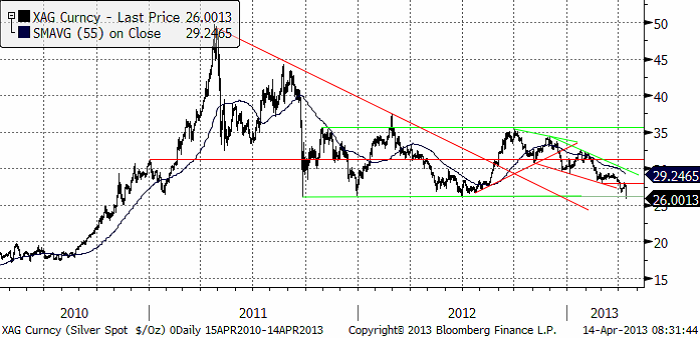
I den här typen av lägen är det svårt att lämna en rekommendation nu, utan den måste bli beroende på om 26 dollar bryts eller håller. Vi har haft en neutral rekommendation, men om stödet bryts köper vi BEAR SILVER X4 S.
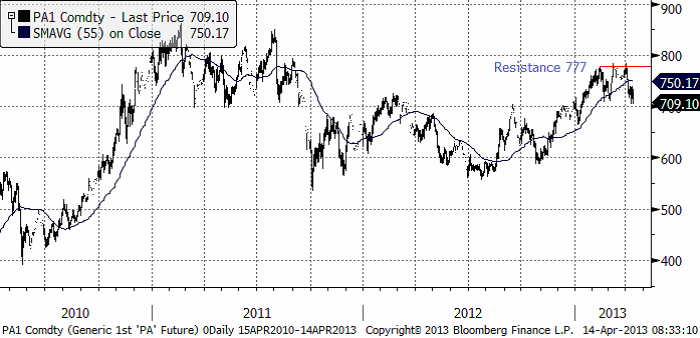
Platina & Palladium
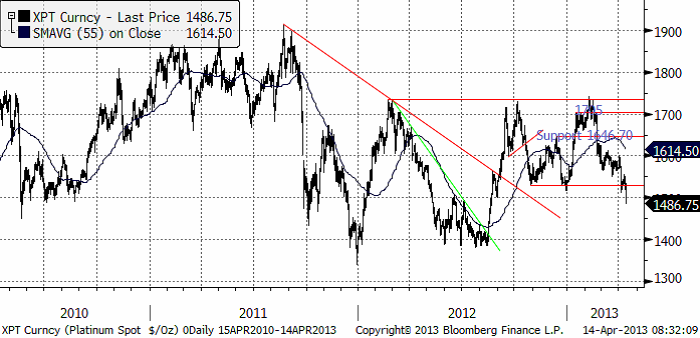
Platinapriset ligger strax över stödet på 1550 dollar, som testades – och höll – i veckan som gick. Om 1525 – 1550 byts på nedsidan är nästa stöd 1400.
Palladium föll ner till 709 dollar per ozt. Vi ser att 700 dollar. Så länge den nivån håller fortsätter vi vara köpta PALLADIUM S.
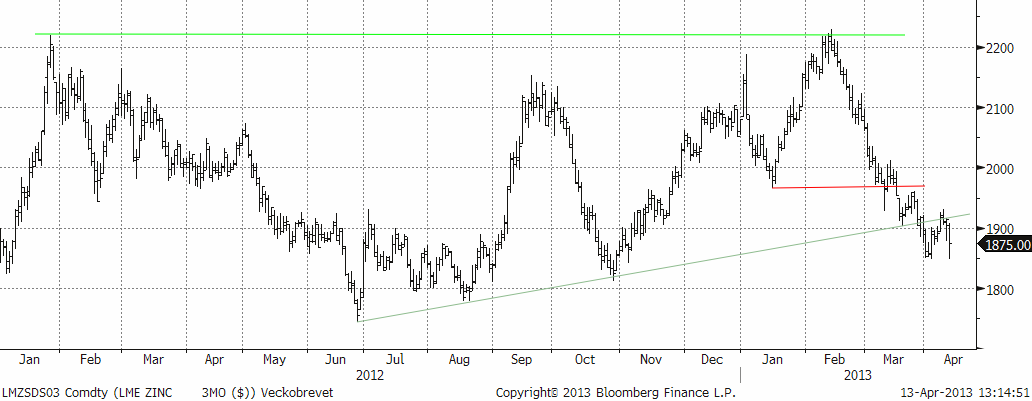
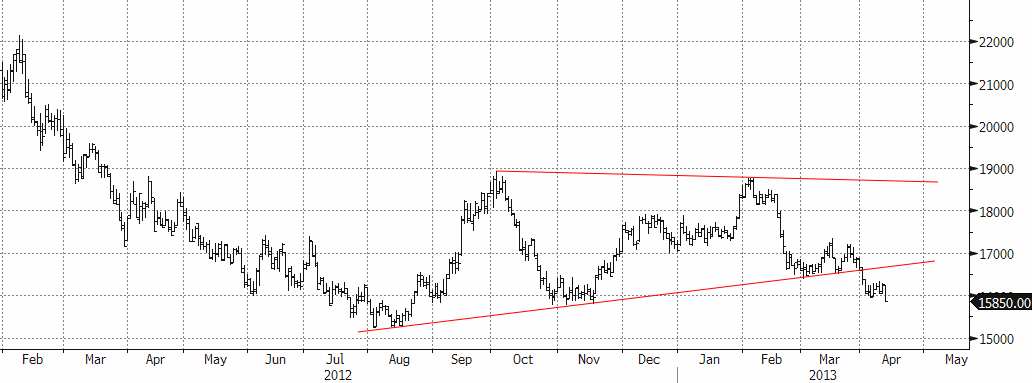
Basmetaller
Veckan avslutades med ett relativt kraftigt prisfall för industriella råvaror. Energi och basmetaller föll på bred front. Utlösande faktor var ädelmetallernas plötsliga kollaps (guldet föll med 5 % bara under fredagshandeln). Den Cypriotiska centralbankens förväntade utförsäljning oroar marknaden. Inte så mycket för volymen, utan mer om det kan vara en omsvängning av trenden av nettoköpande centralbanker. Veckan inleddes annars med en rekyl uppåt (för basmetallerna) på ett par procent, vilken således raderades ut under fredagen. Netto på veckan är priserna ner 0,5-1 %.
Koppar
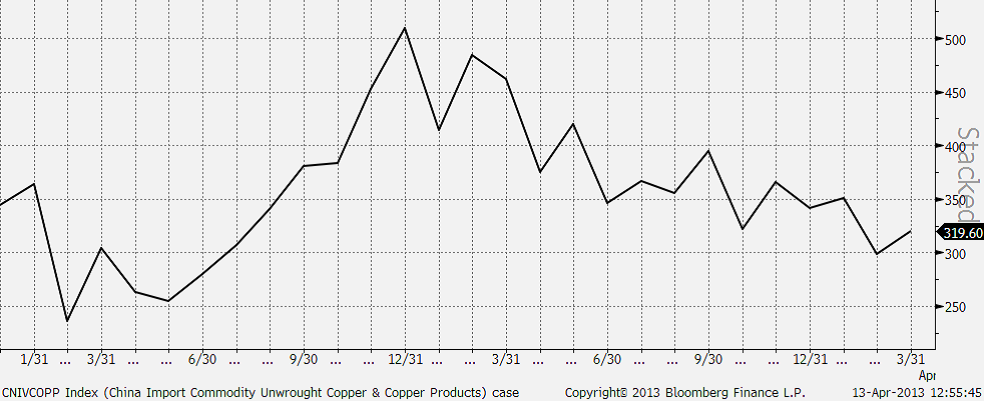
”Upp som en sol, ner som en pannkaka” skulle man kunna beskriva veckan. 3-månaderspriset på LME steg från $7400-nivån upp 7650, med stöd av ökad riskaptit på Kinas positiva handelsstatistik i mitten av veckan. Inflationen kom också in lägre än väntat. Kopparimporten steg men har fortfarande en bit kvar till vad som kan betraktas som stark (se diagramet nedan).
Den stora årliga CESCO-konferensen i Chile har gått av stapeln i veckan. Diskussionerna har handlat mer om premienivåer än faktiskt prisnivåer. Marknaden bedöms vara relativt balanserad, till ett mindre överskott, efter flera år av ”kroniska” underskott. Premiediskussionen kretsar kring farhågorna att kopparn skall erfara samma sak som aluminium och zink, d.v.s. att överskottsmaterial placeras i LME-lager uppknutet i finansierings affärer (där man köper spot och säljer på termin för att utnyttja terminspåslaget). De långa utlastningstiderna i LME-lager gör att material blir otillgängligt för konsumenter och därmed stiger premierna. LME diskuterar olika påtryckningsmedel för att förmå lagerhusen att öka utlastningskapaciteten.
Den tekniska bilden ger stöd till vår neutrala position. Vi är positiva till basmetaller på sikt men avvaktar bättre köptillfällen alternativt väljer någon annan basmetall. Priset kommer nu ner i ett intressant stödområde mellan $7200 och $7300.
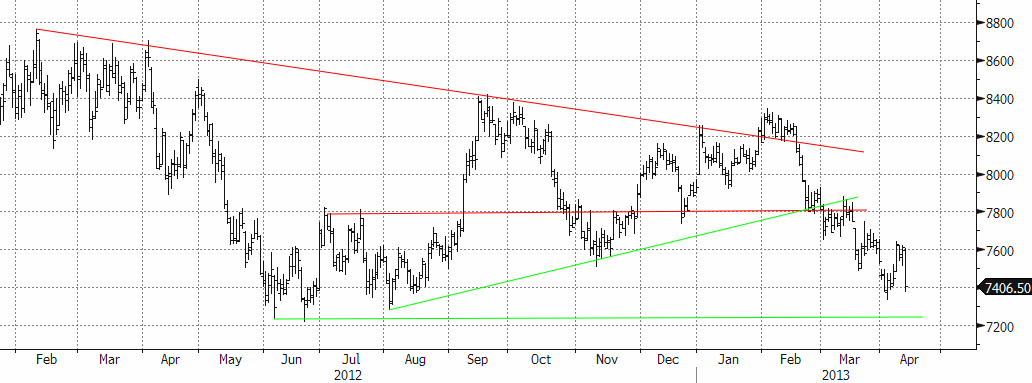
Som vi skrivit tidigare tyder mycket på ökat utbud för koppar, vilket riskerar att begränsa uppgångspotentialen. Vi rekommenderar fortsatt en neutral position. För den som vill satsa på ett starkare tillväxtscenario (än konsensus) i Kina är koppar däremot alltid ett intressant alternativ.
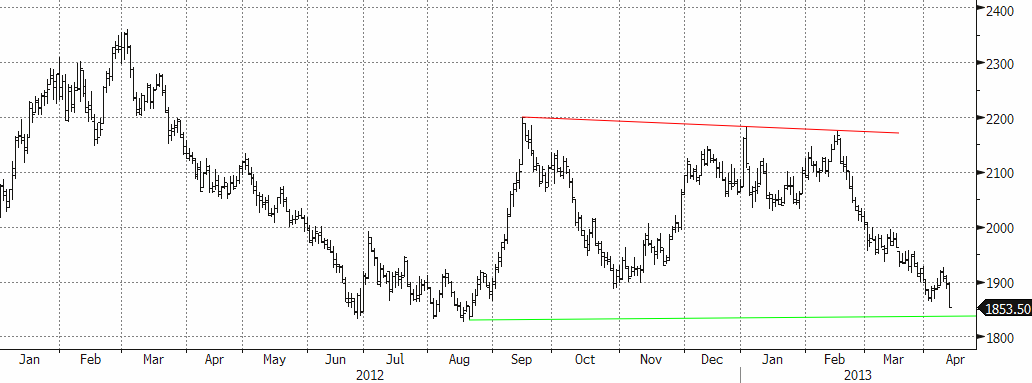
Aluminium
Som vi skrivit tidigare ligger aluminium väldigt ”fast” i ett relativt stort handelsintervall. Nivåer kring $1800-1900 utgör ur ett kostnadsperspektiv starkt stöd. Samtidigt lägger det stora utbudet ett ”tak” på nivåer kring $2300. Den senaste uppgången i februari mötte stora säljordrar från producenter som passade på att ”låsa” framtida priser, vilket satte press på marknaden. Nu när priserna fallit tillbaka ser vi stora intressen från köpsidan (fysiska förbrukare). För den ”trading-benägne” utgör det stora spannet goda vinstmöjligheter. Vi närmar oss nu ”den sista utposten”, kring $1830. Det allmänt negativa stämningsläget för de industriella råvarorna under fredagen kan ge en tillfällig press under nivån. På lite sikt (6-12 mån) är dock detta en mycket intressant nivå för öka exponeringen mot basmetaller.
Zink
Priset följde kopparn under veckan, och den inledande rekylen upp till $1930 kom av sig rejält. Scenariot påminner om det för aluminium, där vi nu kommer ned till väldigt attraktiva nivåer. Den negativa tendensen från i fredags kan mycket väl fortsätta under veckans inledning. Fundamentalt är zinken ”billig” ur ett kostnadsperspektiv och nuvarande nivåer är mycket intressanta på lite längre sikt (6-12 månader).
Nickel
Marknaden är fortsatt tveksam till den fundamentala situationen. Vi har tidigare bl.a. hänvisat till kommentarer från fysiska aktörer som indikerar att ”det finns gott om nickel”, samtidigt som rapporter gör gällande att exporten av nickelmalm från Indonesien till Kina ökar igen, vilket riskerar att öka utbudet av s.k. Nickel Pig Iron i Kina (vilket i sin tur minskar efterfrågan på nickelbärande skrot och primärnickel). För några veckor sedan ryktades det om en omsvängning, då kinesiska producenter är snabba att ställa om produktionen, vilket ger ett naturligt stöd till nickelmarknaden. Nya rykten gör dock gällande att Kina börjat exportera Nickel Pig Iron. LME-lagret är på all time high. Så det är svårt att bli vara väldigt ”bullish” på nickel just nu. Nivån är attraktiv ur ett kostnadsperspektiv, men det allmänna stämningsläget just nu riskerar att sätta ytterligare press. Det stora stödet ligger kring $15 000. Precis som för aluminium och zink bedömer vi dock nickel som mycket köpvärd på 6-12 månaders sikt.
Vi rekommenderar köp av NICKEL S eller BULL NICKEL X2 / X4 S för den som vill ta mer risk. Vi varnade för en rekyl, och den kom. Priset har fallit mer än ”befarat”, men är nu på väldigt attraktiva nivåer.
Kaffe
Kaffepriset (maj 2013) fortsatte ner i veckan som gick och fortsatte därmed den fallande trenden. Vi tror att en trendvändning är nära förestående, men det är ingen idé att köpa KAFFE S innan trenden har vänt.
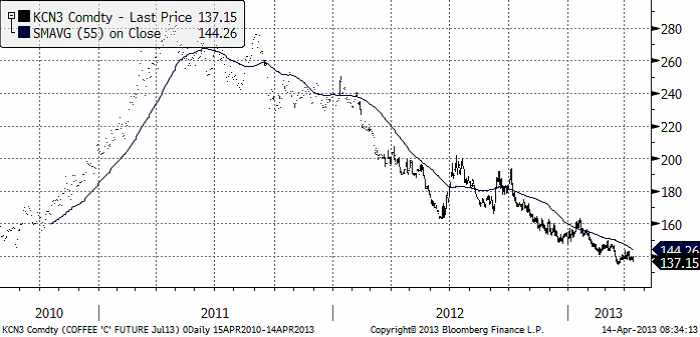
Marknaden diskonterar högre priser i framtiden, som vi ser av terminskurvan nedan. För att man ska tjäna pengar genom att köpa terminer måste uppgången vara större än vad marknaden redan har diskonterat.
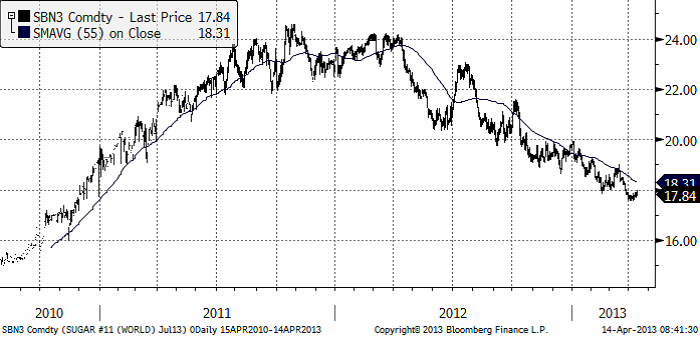
Socker
Sockerpriset (september 2013) föll i slutet av mars under 18 cent per pund. De senaste dagarna har priset rekylerat upp mot det motståndet, men inte orkat igenom. Trenden är alltjämt nedåtriktad. Vi fortsätter med neutral rekommendation.
Guld är trots allt en värdebevarare i inflationsskyddad mening och eftersom penningmängden ökar så kraftigt i alla stora och sparkapitalsfulla ekonomier


The latest weekly report from the US DOE showed a substantial drawdown across key petroleum categories, adding more upside potential to the fundamental picture.

Commercial crude inventories (excl. SPR) fell by 5.8 million barrels, bringing total inventories down to 415.1 million barrels. Now sitting 11% below the five-year seasonal norm and placed in the lowest 2015-2022 range (see picture below).
Product inventories also tightened further last week. Gasoline inventories declined by 2.1 million barrels, with reductions seen in both finished gasoline and blending components. Current gasoline levels are about 3% below the five-year average for this time of year.
Among products, the most notable move came in diesel, where inventories dropped by almost 4.1 million barrels, deepening the deficit to around 20% below seasonal norms – continuing to underscore the persistent supply tightness in diesel markets.
The only area of inventory growth was in propane/propylene, which posted a significant 5.1-million-barrel build and now stands 9% above the five-year average.
Total commercial petroleum inventories (crude plus refined products) declined by 4.2 million barrels on the week, reinforcing the overall tightening of US crude and products.


A classic case of “buy the rumor, sell the news” played out in oil markets, as Brent crude has dropped sharply – down nearly USD 10 per barrel since yesterday evening – following Iran’s retaliatory strike on a U.S. air base in Qatar. The immediate reaction was: “That was it?” The strike followed a carefully calibrated, non-escalatory playbook, avoiding direct threats to energy infrastructure or disruption of shipping through the Strait of Hormuz – thus calming worst-case fears.
After Monday morning’s sharp spike to USD 81.4 per barrel, triggered by the U.S. bombing of Iranian nuclear facilities, oil prices drifted sideways in anticipation of a potential Iranian response. That response came with advance warning and caused limited physical damage. Early this morning, both the U.S. President and Iranian state media announced a ceasefire, effectively placing a lid on the immediate conflict risk – at least for now.
As a result, Brent crude has now fallen by a total of USD 12 from Monday’s peak, currently trading around USD 69 per barrel.
Looking beyond geopolitics, the market will now shift its focus to the upcoming OPEC+ meeting in early July. Saudi Arabia’s decision to increase output earlier this year – despite falling prices – has drawn renewed attention considering recent developments. Some suggest this was a response to U.S. pressure to offset potential Iranian supply losses.
However, consensus is that the move was driven more by internal OPEC+ dynamics. After years of curbing production to support prices, Riyadh had grown frustrated with quota-busting by several members (notably Kazakhstan). With Saudi Arabia cutting up to 2 million barrels per day – roughly 2% of global supply – returns were diminishing, and the risk of losing market share was rising. The production increase is widely seen as an effort to reassert leadership and restore discipline within the group.
That said, the FT recently stated that, the Saudis remain wary of past missteps. In 2018, Riyadh ramped up output at Trump’s request ahead of Iran sanctions, only to see prices collapse when the U.S. granted broad waivers – triggering oversupply. Officials have reportedly made it clear they don’t intend to repeat that mistake.
The recent visit by President Trump to Saudi Arabia, which included agreements on AI, defense, and nuclear cooperation, suggests a broader strategic alignment. This has fueled speculation about a quiet “pump-for-politics” deal behind recent production moves.
Looking ahead, oil prices have now retraced the entire rally sparked by the June 13 Israel–Iran escalation. This retreat provides more political and policy space for both the U.S. and Saudi Arabia. Specifically, it makes it easier for Riyadh to scale back its three recent production hikes of 411,000 barrels each, potentially returning to more moderate increases of 137,000 barrels for August and September.
In short: with no major loss of Iranian supply to the market, OPEC+ – led by Saudi Arabia – no longer needs to compensate for a disruption that hasn’t materialized, especially not to please the U.S. at the cost of its own market strategy. As the Saudis themselves have signaled, they are unlikely to repeat previous mistakes.
Conclusion: With Brent now in the high USD 60s, buying oil looks fundamentally justified. The geopolitical premium has deflated, but tensions between Israel and Iran remain unresolved – and the risk of missteps and renewed escalation still lingers. In fact, even this morning, reports have emerged of renewed missile fire despite the declared “truce.” The path forward may be calmer – but it is far from stable.
Analys
A muted price reaction. Market looks relaxed, but it is still on edge waiting for what Iran will do
Brent crossed the 80-line this morning but quickly fell back assigning limited probability for Iran choosing to close the Strait of Hormuz. Brent traded in a range of USD 70.56 – 79.04/b last week as the market fluctuated between ”Iran wants a deal” and ”US is about to attack Iran”. At the end of the week though, Donald Trump managed to convince markets (and probably also Iran) that he would make a decision within two weeks. I.e. no imminent attack. Previously when when he has talked about ”making a decision within two weeks” he has often ended up doing nothing in the end. The oil market relaxed as a result and the week ended at USD 77.01/b which is just USD 6/b above the year to date average of USD 71/b.

Brent jumped to USD 81.4/b this morning, the highest since mid-January, but then quickly fell back to a current price of USD 78.2/b which is only up 1.5% versus the close on Friday. As such the market is pricing a fairly low probability that Iran will actually close the Strait of Hormuz. Probably because it will hurt Iranian oil exports as well as the global oil market.
It was however all smoke and mirrors. Deception. The US attacked Iran on Saturday. The attack involved 125 warplanes, submarines and surface warships and 14 bunker buster bombs were dropped on Iranian nuclear sites including Fordow, Natanz and Isfahan. In response the Iranian Parliament voted in support of closing the Strait of Hormuz where some 17 mb of crude and products is transported to the global market every day plus significant volumes of LNG. This is however merely an advise to the Supreme leader Ayatollah Ali Khamenei and the Supreme National Security Council which sits with the final and actual decision.
No supply of oil is lost yet. It is about the risk of Iran closing the Strait of Hormuz or not. So far not a single drop of oil supply has been lost to the global market. The price at the moment is all about the assessed risk of loss of supply. Will Iran choose to choke of the Strait of Hormuz or not? That is the big question. It would be painful for US consumers, for Donald Trump’s voter base, for the global economy but also for Iran and its population which relies on oil exports and income from selling oil out of that Strait as well. As such it is not a no-brainer choice for Iran to close the Strait for oil exports. And looking at the il price this morning it is clear that the oil market doesn’t assign a very high probability of it happening. It is however probably well within the capability of Iran to close the Strait off with rockets, mines, air-drones and possibly sea-drones. Just look at how Ukraine has been able to control and damage the Russian Black Sea fleet.
What to do about the highly enriched uranium which has gone missing? While the US and Israel can celebrate their destruction of Iranian nuclear facilities they are also scratching their heads over what to do with the lost Iranian nuclear material. Iran had 408 kg of highly enriched uranium (IAEA). Almost weapons grade. Enough for some 10 nuclear warheads. It seems to have been transported out of Fordow before the attack this weekend.
The market is still on edge. USD 80-something/b seems sensible while we wait. The oil market reaction to this weekend’s events is very muted so far. The market is still on edge awaiting what Iran will do. Because Iran will do something. But what and when? An oil price of 80-something seems like a sensible level until something do happen.


Tightening fundamentals – bullish inventories from DOE

Jonas Lindvall är tillbaka med ett nytt oljebolag, Perthro, som ska börsnoteras

Oljan, guldet och marknadens oroande tystnad

Domstolen ger klartecken till Lappland Guldprospektering
Bombs to ”ceasefire” in hours – Brent below $70

Stor uppsida i Lappland Guldprospekterings aktie enligt analys

Brookfield ska bygga ett AI-datacenter på hela 750 MW i Strängnäs

Sommaren inleds med sol och varierande elpriser

OPEC+ ökar oljeproduktionen trots fallande priser

Silverpriset släpar efter guldets utveckling, har mer uppsida
-
 Nyheter3 veckor sedan
Stor uppsida i Lappland Guldprospekterings aktie enligt analys
-
 Nyheter4 veckor sedan
Brookfield ska bygga ett AI-datacenter på hela 750 MW i Strängnäs
-
 Nyheter4 veckor sedan
Sommaren inleds med sol och varierande elpriser
-
 Nyheter4 veckor sedan
OPEC+ ökar oljeproduktionen trots fallande priser
-
 Nyheter3 veckor sedan
Silverpriset släpar efter guldets utveckling, har mer uppsida
-
Analys4 veckor sedan
Brent needs to fall to USD 58/b to make cheating unprofitable for Kazakhstan
-

 Nyheter4 veckor sedan
Tradingfirman XTX Markets bygger datacenter i finska Kajana för 1 miljard euro
-

 Nyheter2 veckor sedan
Uppgången i oljepriset planade ut under helgen