

Analys
SEB Jordbruksprodukter, 22 april 2013

 Efter två år av avvaktande lugn på råvarumarknaden, vaknade den till liv, om man får säga så när det handlar om prisfall, i veckan som gick. BNP-tillväxten under första kvartalet i Kina kom in på +7.7%, betydligt svagare än de 8% som marknaden väntat sig. IMF reviderade ner sin prognos för global BNP-tillväxt till +3.3%. Det är den svagaste tillväxten sedan åtminstone 1980, bortsett från katastrofåret 2008. Den svaga tillväxten i världen, som nu även märks i tillväxtländer, ledde till stora prisfall på råvarumarknaden i veckan som gick.
 Vädret i USA har fördröjt majssådden, vilket fått majspriset att hålla sig stabilt, men i gengäld påverkat sojabönorna negativt, eftersom denna gröda då tenderar att vinna areal. Kinas svagare ekonomi tyngde också sojabönorna. Handeln är annars mest väderstyrd nu och vi går igenom detta lite djupare än vanligt.
Odlingsväder
USA och Kanada är kallt, vått och snörikt. Australiens odlingsområden är torra och norr om Svarta-havet byggs ett högtryck upp. Norra Kina är torrt, där man odlar vete. I lördags (förrgår) föll temperaturen i Oklahoma ner till minus 4 grader och i New Mexico till minus fem grader. Samtidigt har över hälften av vetet börjat gå i ax, vilket gör plantan känslig för frost. Mer om detta nedan.
Vete
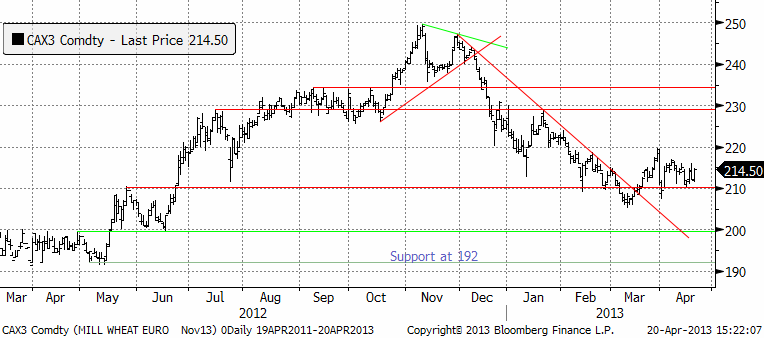
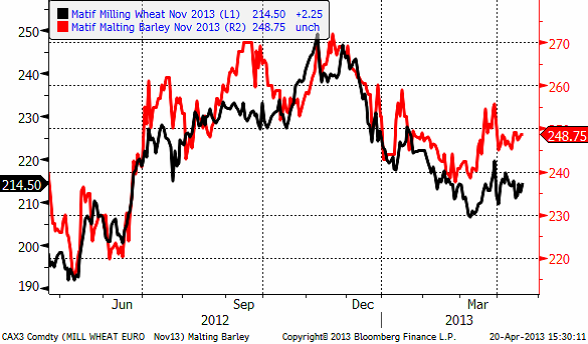
Priset på november (2013) har hållit sig över 210 euro, som nu återigen fungerar som ett tekniskt stöd. Frågan är om priset ska bryta uppåt och testa 230.
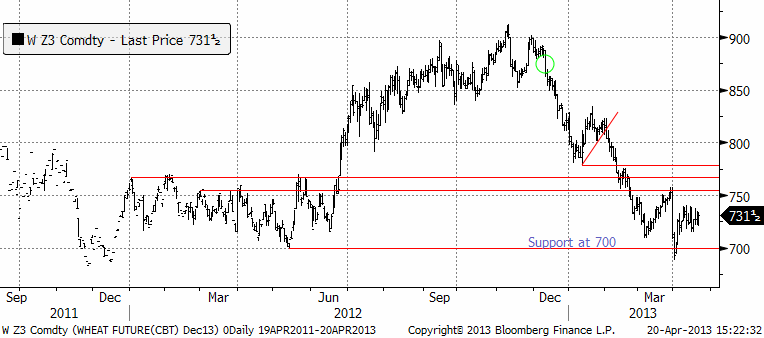
Decemberkontraktet på CBOT ser mindre ”bullish” ut än grafen för Matif-vetet. Så som Chicagovetet handlats förefaller ett test av 700 cent på nedsidan vara troligare.
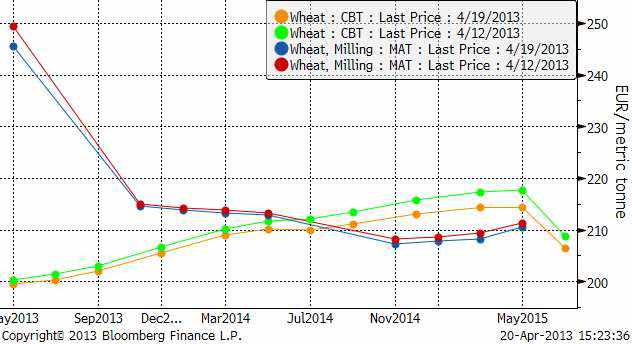
Ser vi på den senaste veckan förändring av terminskurvorna, ser vi att framförallt gammal skörd på Matif handlats ner. Det kan bero på att Tunisien faktiskt köpt ryskt vete i veckan. Det verkar alltså som om Ryssland kommit ut på exportmarknaden igen, efter att ha varit borta i nästan sex månader. I USA föll framförallt de tidsmässigt mest avlägsna leveransdatumen.
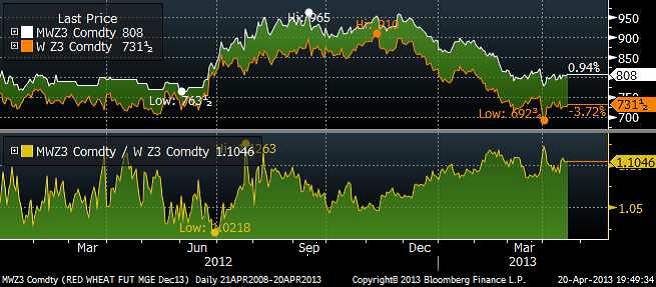
Den kalla och sena våren i USA har gjort att vårvetet på Minneapolis Grain Exchange handlats upp. I diagrammet nedan ser vi kvoten mellan priset på vårvete och chicagovete. Premien för kvalitet ökade som vi ser redan under vintern, och har legat högt – och kommer kanske att gå högre på helgens köldknäpp.
Vi ser ju faktiskt något av samma sak vad gäller maltkornet på Matif, som drar ifrån höstvetet. Strategie Grains fortsätter att justera ned sitt estimat för EU:s veteproduktion 2013/14 med ca 500 000 ton till 130 mt, vilket är den fjärde nedjusteringen i rad. Revideringen beror främst på en minskning av produktionen i Storbritannien med 330 000 ton efter förra årets katastrofala höstsådd samt lägre areal i Danmark och Spanien som resulterar i en minskning med 200 000 ton. Det blöta och kalla vädret i år har dessutom försenat höstgrödornas utveckling samtidigt som det har hämmat sådden av vårgrödor.
Estimatet för EU:s produktion plus Kroatiens, som ansluter sig och blir EU:s 28:e medlem i juli, uppgår till 131.1 mt, vilket är en nedjustering från 131.6 mt förra månaden. Men temperaturen i norra Europa, med centrum i Tyskland, har den senaste veckan legat över det normala.
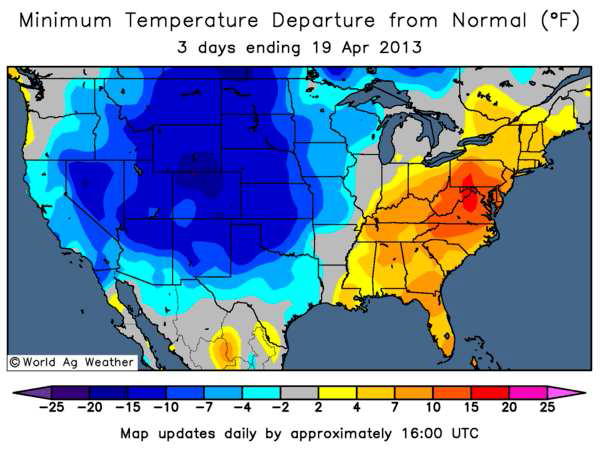
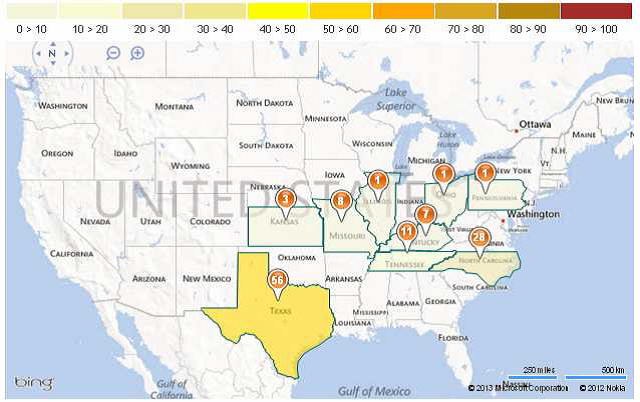
Prognosen för de närmaste två veckorna visar att värmen håller i sig. Nederbörden har också varit god och väntas vara fortsatt god. I USA har det däremot varit alarm. I Kansas, den delstat som producerar mest vete, föll temperaturen i lördags till minus 4 grader. I Texas föll temperaturen till minus 5 grader. Även Oklahoma och New Mexico berördes av frosten. Kansas, Oklahoma och Texas star för 28% av den amerikanska veteproduktionen. 68% av Oklahomas vete och 49% av Texas vete hade satt ax den 14 april enligt USDA-data. I Kansas var det bara 17% som gått i ax. Nedan ser vi de tre senaste dagarnas temperaturavvikelse från det normala. Nedan ser vi de tre senaste dagarnas temperaturavvikelse för USA.
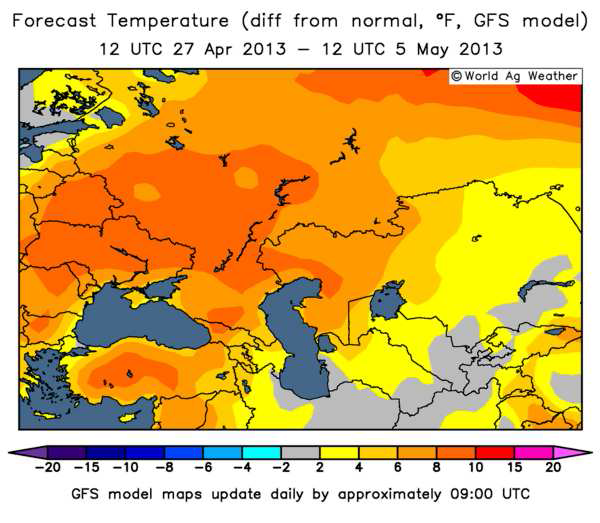
Under tiden håller ett ordentligt högtryck på att stärkas över Svartahavsområdet (Ryssland och Ukraina) med temperaturer upp till 8 grader över det normal. Det är redan ovanligt torrt i området nord – till nordost om Svarta havet.
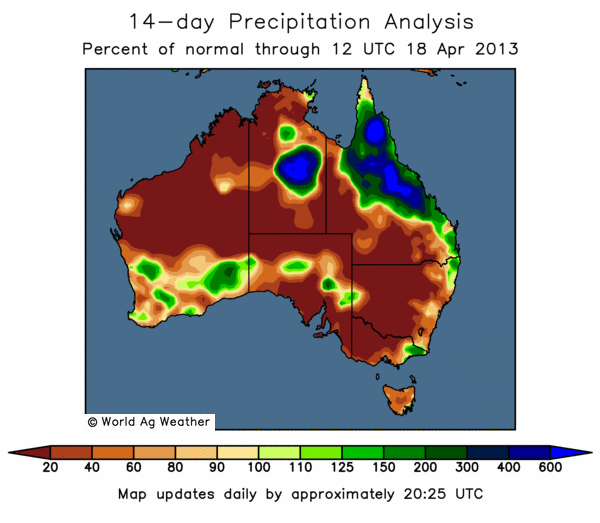
På andra sidan klotet, där vårbruket snart ska starta, är det ovanligt torrt, som vi ser av nederbördskartan nedan.
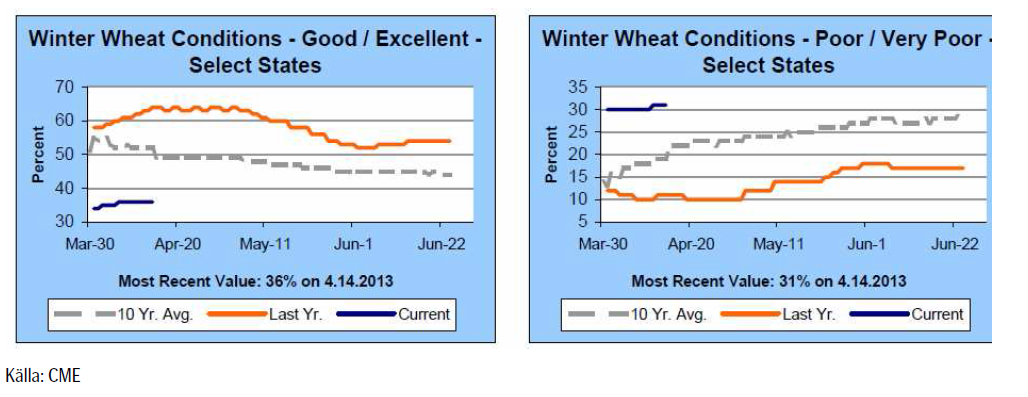
Crop progress för en vecka sedan visade oförändrat 36% i good/excellent condition.
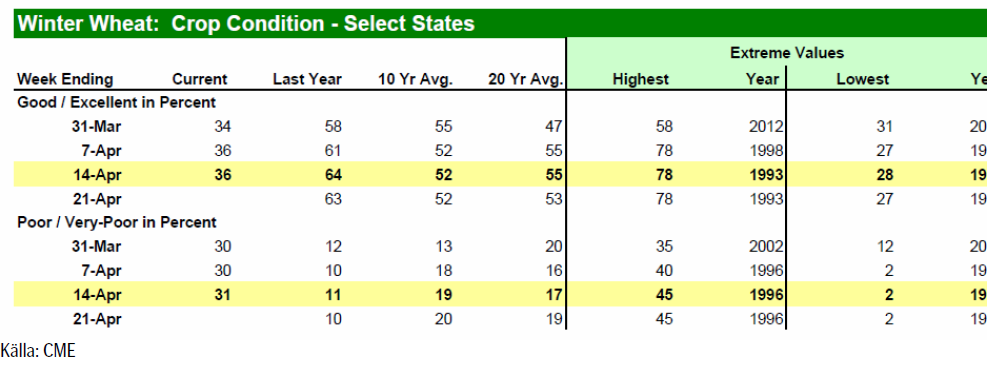
USDA bekräftar att frost har skadat somliga höstgrödor som har kommit ur vintervilan, och som då är mer utsatta för kyla. Bl.a i Kansas, oroar sig lantbrukarna över de låga temperaturernas påverkan på grödorna, men det är fortfarande för tidigt att avgöra skadornas omfattning. I måndagens Crop Progress rapport från USDA så klassas dock fortfarande 36% av det amerikanska höstvetet som ”good/excellent” vilket är oförändrat från förra veckan, men givetvis mycket lägre än förra årets 64% vid samma tid, men samtidigt bättre än vad marknaden hade förväntat sig. Andelen grödor klassade som ”poor/very poor” har dock ökat med 1% till 31%.
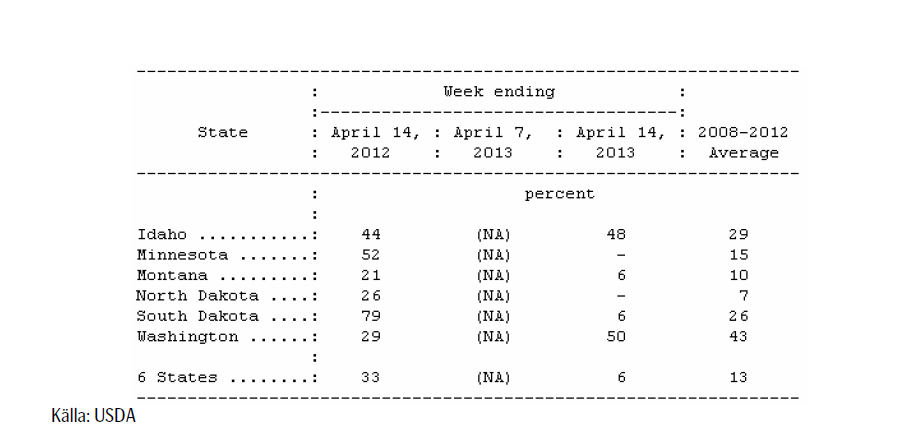
Crop Progress-rapporten visar också att sådden av vårvete i USA har fått en långsam start. 6% är i marken, vilket är att jämföra med det femåriga genomsnittet på 13% och 33% förra året, som en följd av snöfall i de norra staterna som producerar vårvete. Snön, som inte bara försenar sådden, leder också till en viss oro för översvämningar vid en snabb snösmältning framöver.
Vi fortsätter tro på sidledes prisrörelse tills vidare. Vi har sett de högsta priserna för året – om det inte blir en rejäl torka i år igen. Allt annat lika bör man passa på att sälja på uppgångar tycker jag.
Maltkorn
Priset på maltkorn med leverans i november har fortsatt att visa mer styrka än höstvetet / kvarnvetet på Matif.
Majs
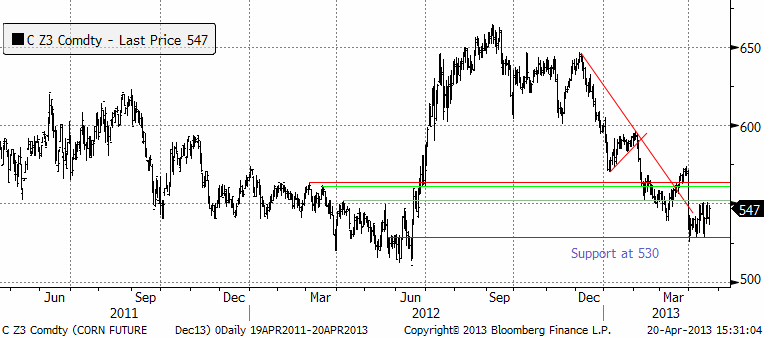
Majspriset (december 2013) har trotsat prisfallen på resten av råvarumarknaden och ligger på toppnivåer för månaden. I fredags stängde handeln i decemberkontraktet på 547 cent per bushel. Det är den låga takten i sådden som ligger bakom. I veckan var endast 2% av arealen sådd i USA, pga kallt och ogynnsamt väder. Från Argentina rapporterar BAGE att 32% är skördat.
Råoljepriset har fortsatt falla, men etanolpriset har stigit i veckan, vilket gett stöd för majspriset. I veckans energistatistik var etanollagren mindre, men så var även produktionen.
Strategie Grains höjer sitt estimat för EU:s majsproduktion 2013/14 med 500 000 ton till 64.6 mt som en följd av ett skifte i areal från vårkorn till majs i Frankrike, Polen och Tyskland. Estimatet för EU:s produktion plus Kroatiens uppgår till 66.5 mt, vilket är en ökning från förra månadens 66 mt. Kroatien ansluter sig till EU:s framgångsrika union och blir dess 28:e medlem från och med juli månad. Kroatien är ett land som är har ”credit rating” ”B”, har en frisk banksektor, statskulden är 60% av BNP, och livnär sig huvudsakligen på varvsindustri och säsongsturism.
Det kalla och blöta vädret i USA har också lett till att sådden av majs har fått en riktigt långsam start. USDA:s Crop Progress-rapport från den 14 april visar att amerikanska lantbrukare endast hade sått 2%, vilket är 5% lägre än det femåriga genomsnittet på 7%.
Det är också en enorm kontrast jämfört med förra året då det varma och torra vädret gjorde att 15% av sådden var avklarad vid denna tidpunkt på året.
Framförallt har vädret varit en bidragande faktor till begränsat fältarbete i Iowa och Illinois, de största producenterna av majs. I Illinois uppgick sådden till 1%, att jämföra med det femåriga genomsnittet på 12%, medan sådden i Iowa ännu inte har påbörjats.
Prisfallet har stannat av därför att sådden går långsamt. Det är vädret som styr. Om vädret förbättras och takten i sådden ökar, kan ett test av 530 cent bli aktuellt i veckan. Minns den stora arealen från prospective plantings-rapporten för ett par veckor sedan. Marknaden väntar bara på varmare och torrare väder i ”Corn belt” i USA för att sälja terminer.
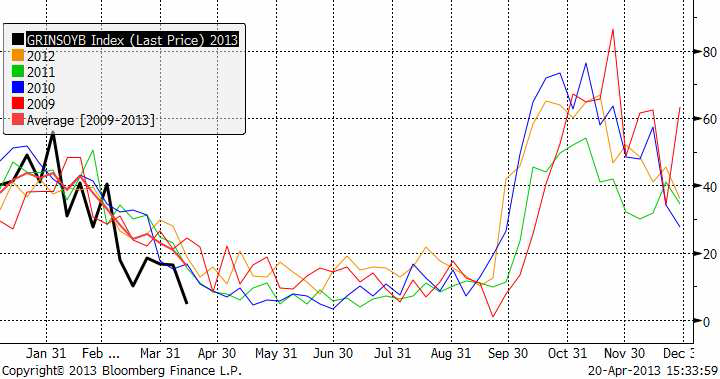
Sojabönor
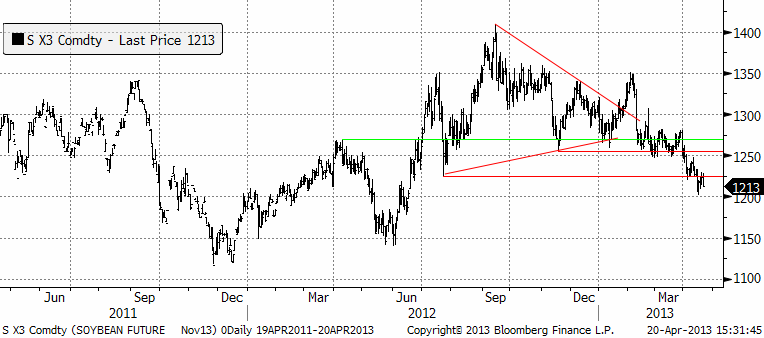
Sojabönorna (november 2013) har tagit nästa trappsteg nedåt och studsade på 1200 cent, med 1225 som övre motstånd. Chansen är stor att 1200 bryts i veckan som kommer. Det rapporterades bland annat i veckan att efterfrågan på griskött i USA utvecklas svagt och fågelinfluensan i Kina kan påverka importbehovet av sojabönor i Kina något sämre, allt annat lika. Det kalla och ogynnsamma vädret för sådden av majs i USA, där endast 2% var i backen i förra måndagens statistik, gör att mer areal kan flyttas över till soja istället. Soja sås senare än majs. På samma sätt som det amerikanska vädret ger stöd för majspriset, verkar det alltså negativt på sojapriset.
Det kommer naturligtvis vanlig veckostatistik också. Nedan ser vi export inspections enligt USDA.
BAGE rapporterade att skörden var klar till 39% och behöll skördeestimatet på 48.5 mt. USDA låg förra veckan på 51.5 mt. Brasiliens skörd är till 82% färdig. Det är lite snabbare än vanligt. Abiove sänkte skördeestimatet till 82.1 mt.
USDA låg i april månadads WASDE-rapport på 83.5 mt. Conab ligger högre. Vi tror att priset kommer att fortsätta falla och rekommenderar en såld position i sojabönor.
Raps
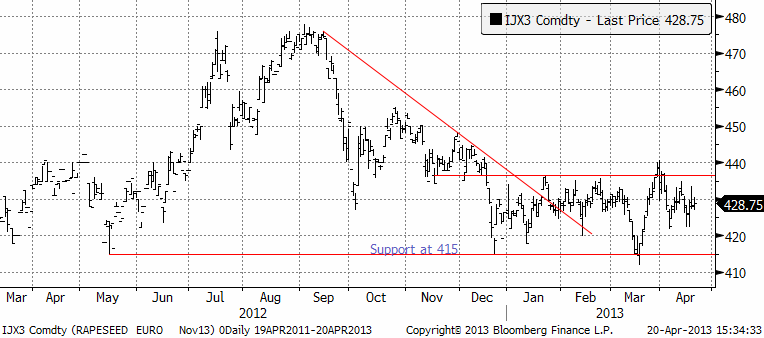
Rapspriset (november 2013) ligger kvar på någorlunda hög nivå. En anledning är att skörden i Europa väntas bli ca 1 månad senare än normalt.
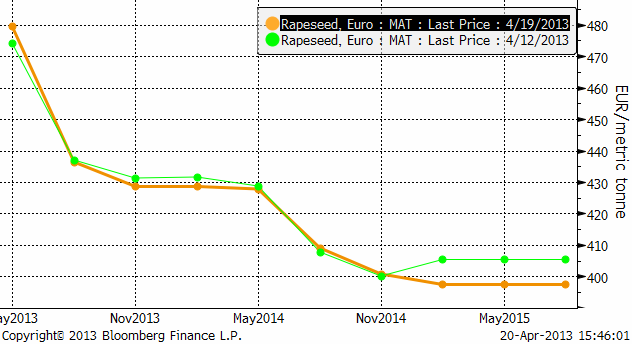
Vi ser förhållandevis små förändringar i terminskurvan från förra veckan (fredag till fredag).
Om vi däremot tänker att skörden blir senare än normalt, kan det påverka utbudet för augustikontraktet på Matif. Leveranser på det kontraktet kan ske hela augusti och det är normalt sett inga problem att leverera ny skörd på det. Men i år ligger skörden kanske en månad senare än normalt. I diagrammet nedan ser vi priset på novemberkontraktet dividerat med priset på augustikontraktet. Vi ser att marknaden har börjat prisa in en försening av skörden (och utbudet). Med väsentligt bättre väder i Europa i prognosen för de kommande 14 dagarna tror vi att det kan vara värt att sälja augusti och köpa november.
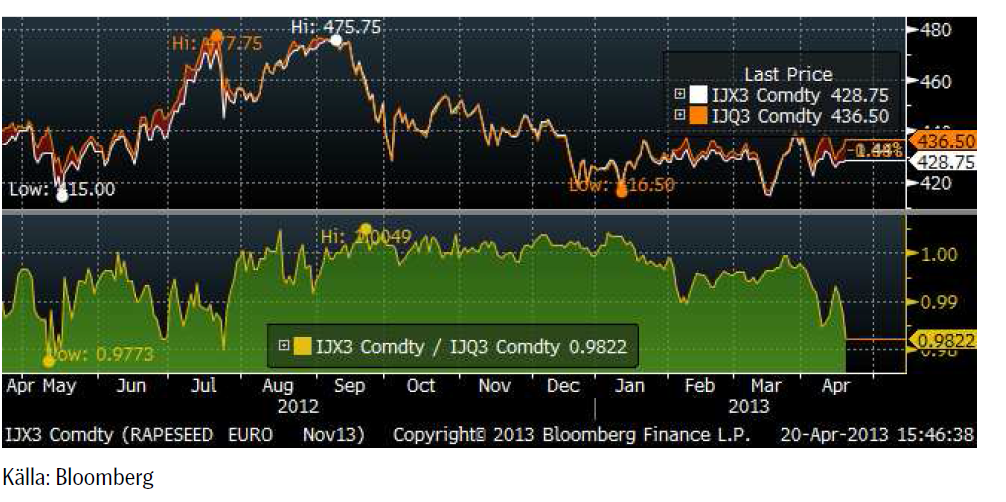
Generellt sett alltså, tror vi att en såld position i raps är bra. Vi tror också att augusti är mer säljvärd än november. Att sälja augusti och köpa november är en affär som direkt spelar på att vädret förbättras fram till skörd.
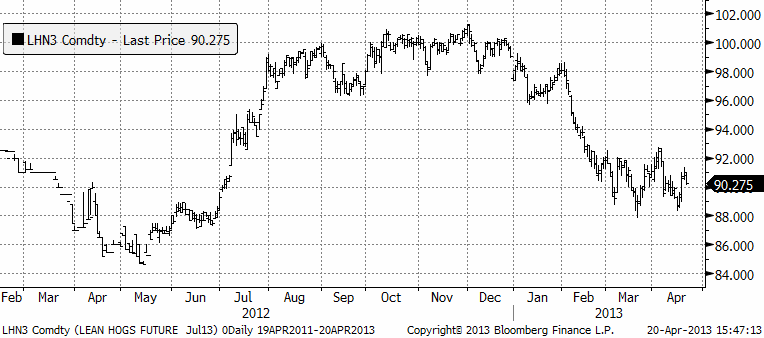
Gris
Grispriset (September 13) som har fortsatt att röra sig sidledes. Det rapporterades i veckan att efterfrågan på griskött i USA utvecklar sig svagare än väntat, vilket fick priset att falla tillbaka mot slutet av förra veckan.
Mjölk
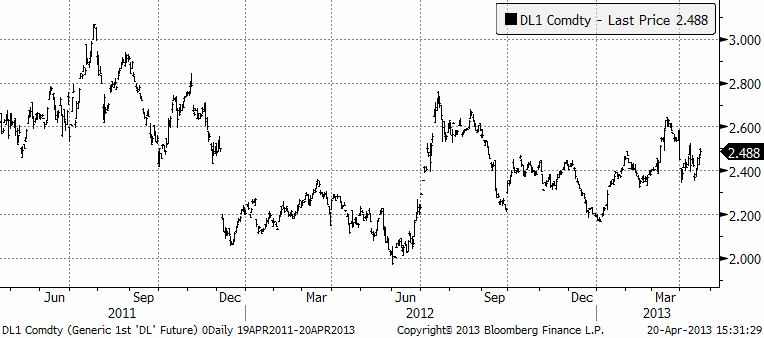
Fonterras pris på SMP tvärvände ner i veckan. Priset ligger fortfarande högt. Ser vi till tidigare tillfällen när Fonterra-priset rusat, ser vi att då har nedgången varit lika kraftig som uppgången och hela den abnorma uppgången tagits ut av nedgången.
I kursdiagrammet nedan ser vi priserna på Fonterras SMP, USDA:s prisnotering på SMP i Europa och Eurex-börsens pris, samt Eurex pris på smör. Alla priser är angivna i euro per ton.
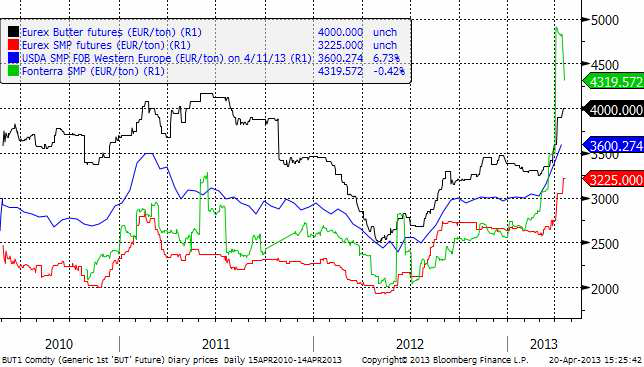
Priserna på smör och skummjölkspulver har fortsatt att stiga på Eurex. Sedan förra veckan har det implicita priset på mjölk, som man får genom att ta rätt andelar smör och SMP, stigit med 10% för leverans i maj och med 9% för leverans i juni. För leverans längre fram i tiden har det varit betydligt mindre prisrörelser.
Nedan ser vi terminskurvorna för smör och skummjölkspulver på Eurex.
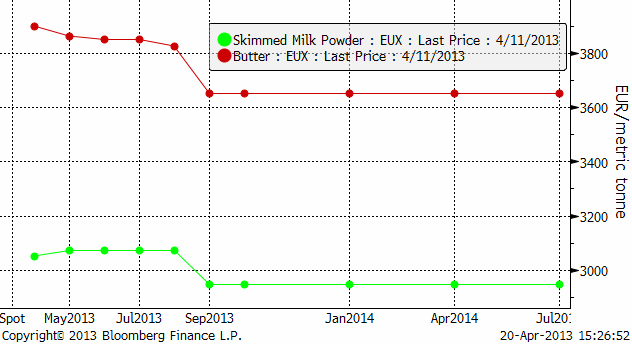
SEB Commodities erbjuder ett litet ”prova-på” kontrakt som består av 0.5 ton Eurex-smör och 0.9 ton Eurex SMP. Ett paket som motsvarar 10 ton flytande mjölkråvara. Just nu är det underliggande värdet på ett sådant kontrakt drygt 33 000 kronor. Vi garanterar börspris eller bättre.
Den som vill följa priset på SMP på Eurex gör det via länken:
www.eurexchange.com/exchange-en/products/com/agr/14016/
Vi tycker att den här haussen på världsmarknaden skapar ett bra tillfälle att säkra via terminer.
[box]SEB Veckobrev Jordbruksprodukter är producerat av SEB Merchant Banking och publiceras i samarbete och med tillstånd på Råvarumarknaden.se[/box]
Disclaimer
The information in this document has been compiled by SEB Merchant Banking, a division within Skandinaviska Enskilda Banken AB (publ) (“SEB”).
Opinions contained in this report represent the bank’s present opinion only and are subject to change without notice. All information contained in this report has been compiled in good faith from sources believed to be reliable. However, no representation or warranty, expressed or implied, is made with respect to the completeness or accuracy of its contents and the information is not to be relied upon as authoritative. Anyone considering taking actions based upon the content of this document is urged to base his or her investment decisions upon such investigations as he or she deems necessary. This document is being provided as information only, and no specific actions are being solicited as a result of it; to the extent permitted by law, no liability whatsoever is accepted for any direct or consequential loss arising from use of this document or its contents.
About SEB
SEB is a public company incorporated in Stockholm, Sweden, with limited liability. It is a participant at major Nordic and other European Regulated Markets and Multilateral Trading Facilities (as well as some non-European equivalent markets) for trading in financial instruments, such as markets operated by NASDAQ OMX, NYSE Euronext, London Stock Exchange, Deutsche Börse, Swiss Exchanges, Turquoise and Chi-X. SEB is authorized and regulated by Finansinspektionen in Sweden; it is authorized and subject to limited regulation by the Financial Services Authority for the conduct of designated investment business in the UK, and is subject to the provisions of relevant regulators in all other jurisdictions where SEB conducts operations. SEB Merchant Banking. All rights reserved.

Brent is climbing higher. Front-month is at USD 106.3/bl this morning, close to a weekly high and a USD 9/bl jump from Mondays open. This is the move we flagged as a risk earlier in the week: the market shifting from ”a deal is around the corner” to ”this is going to take longer than we thought”.

Analyst Commodities, SEB
During April, rest-of-year Brent remained remarkably stable around USD 90/bl. A stability which rested on one single assumption: the SoH reopens around 1 May. That assumption is now slowly falling apart.
As we highlighted yesterday: every week of delay beyond 1 May adds (theoretically) ish USD 5/bl to the rest-of-year average, as global inventories draw 100 million barrels per week. i.e., a mid-May reopening implies rest-of-year Brent closer to USD 100/bl, and anything pushing into June or July takes us meaningfully higher.
What’s changed in the last 48 hours:
#1: The US military has formally warned that clearing suspected sea mines from SoH could take up to six months. That is a completely different timescale from what the financial market is pricing. Even a political deal tomorrow does not immediately reopen the strait.
#2: Trump has shifted his tone from urgency to ”strategic patience”. In yesterday’s press conference: ”Don’t rush me… I want a great deal.” The market is reading this as a president no longer feeling pressured by timelines, with the naval blockade running in the background.
#3: So far, the military activity is escalating, not de-escalating. Axios reports Iran is laying more mines in SoH. The US 3rd carrier strike group (USS George H.W. Bush) is arriving with two countermine vessels. Trump yesterday ordered the US Navy to destroy any Iranian boats caught laying mines. While CNN reports that the Pentagon is actively drawing up plans to strike Iranian SoH capabilities and individual Iranian military leaders if the ceasefire collapses. i.e., NOT a attitude consistent with an imminent deal!
Spot crude and product prices eased off the early-April highs on a combination of system rerouting and deal optimism. Both now weakening. Goldman estimates April Gulf output is reduced by 14.5 mbl/d, or 57% of pre-war supply, a number that keeps getting worse the longer this drags on.
Demand-side adaptation is ongoing: S. Korea has cut its Middle East crude dependence from 69% to 56% by pulling more from the Americas and Africa, and Japan is kicking off a second round of SPR releases from 1 May. But SPRs are finite.
Ref. to the negotiations, we should not bet on speed. The current Iranian leadership is dominated by genuine hardliners willing to absorb economic pain and run the clock to extract concessions. That is not a setup for a rapid resolution. US/Israeli media briefings keep framing the delay as ”internal Iranian divisions”, the reality is more complicated and points toward weeks and months, not days.
Our point is that the complexity is large, and higher prices have only just started (given a scenario where the negotiations drag out in time). The market spent April leaning on the USD 90/bl rest-of-year assumption; that case is diminishing by the hour. If ”early May reopening” is replaced by ”June, July or later” over the next week or two, both crude and products have meaningful room to reprice higher from here. There is a high risk being short energy and betting on any immediate political resolution(!).
Down on Friday. Up on Monday. The Brent June crude oil contract traded down 5.1% last week to a close of $90.38/b. It reached a high of $103.87/b last Monday and a low of $86.09/b on Friday as Iran announced that the Strait of Hormuz was fully open for transit. That quickly changed over the weekend as the US upheld its blockade of Iranian oil exports while Iran naturally responded by closing the SoH again. The US blew a hole in the engine room of the Iranian ship TOUSKA and took custody of the ship on Sunday. Brent crude is up 5.6% this morning to $95.4/b.

The cease-fire is expiring tomorrow. The US has said it will send a delegation for a second round of negotiations in Islamabad in Pakistan. But Iran has for now rejected a second round of talks as it views US demands as unrealistic and excessive while the US is also blocking the Strait of Hormuz.
While Brent is up 5% this morning, the financial market is still very optimistic that progress will be made. That talks will continue and that the SoH will fully open by the start of May which is consistent with a rest-of-year average Brent crude oil price of around $90/b with the market now trading that balance at around $88/b.
Financial optimism vs. physical deterioration. We have a divergence where the financial market is trading negotiations, improvements and resolution while at the same time the physical market is deteriorating day by day. Physical oil flows remain constrained by disrupted flows, longer voyage times and elevated freight and insurance costs.
Financial markets are betting that a US/Iranian resolution will save us in time from violent shortages down the road. But every day that the SoH remains closed is bringing us closer to a potentially very painful point of shortages and much higher prices.
The US blockade is also a weapon of leverage against its European and Asian allies. When Iran closed the SoH it held the world economy as a hostage against the US. The US blockade of the SoH is of course blocking Iranian oil exports. But it is also an action of disruption directed towards Europe and Asia. The US has called for the rest of the world to engaged in the war with Iran: ”If you want oil from the Persian Gulf, then go and get it”. A risk is that the US plays brinkmanship with the global oil market directed towards its European and Asian allies and maybe even towards China to force them to engage and take part. Maybe unthinkable. But unthinkable has become the norm with Trump in the White House.
Wild moves yesterday. Brent crude traded to a high of $114.43/b and a low of $96.0/b and closed at $99.94/b yesterday.
US – Iran negotiations ongoing or not? What a day. Donald Trump announced that good talks were ongoing between Iran and the US and that the 48 hour deadline before bombing Iranian power plants and energy infrastructure was postponed by five days subject to success of ongoing meetings. Iranian media meanwhile stated that no meetings were ongoing at all.
Today we are scratching our heads trying to figure out what yesterday was all about.
Friends and family playing the market? Was it just Trump and his friends and family who were playing with oil and equity markets with $580m and $1.46bn in bets being placed by someone in oil and equity markets just 15 minutes before Trump’s announcement?
Was Trump pulling a TACO as he reached his political and economic pain point: Brent at $112/b, US Gas at $4/gal, SPX below 200dma and US 10yr above 4.4%?
Different Iranian factions with Trump talking with one of them? Are there real negotiations going on but with the US talking to one faction in Iran while another, the hardliners, are not involved and are denying any such negotiations going on?
Extending the ultimatum to attack and invade Kharg island next weekend? Or, is the five day delay of the deadline a tactical decision to allow US amphibious assault ships and marines to arrive in the Gulf in the upcoming weekend while US and Israeli continues to degrade Iranian military targets till then. And then next weekend a move by the US/Israel to attack and conquer for example the Kharg island?
We do not really know which it is or maybe a combination of these.
We did get some kind of TACO ydy. But markets have been waiting for some kind of TACO to happen and yesterday we got some kind of TACO. And Brent crude is now trading at $101.5/b as a result rather than at $112-114/b as it did no the high yesterday.
But what really matters in our view is the political situation on the ground in Iran. Will hardliners continue to hold power or will a more pragmatic faction gain power?
If the hardliners remain in power then oil pain should extend all the way to US midterm elections. The hardliners were apparently still in charge as of last week. Iran immediately retaliated and damaged LNG infrastructure in Qatar after Israel hit Iranian South Pars. The SoH was still closed and all messages coming out of Iran indicated defiance. Hardliners continues in power has a huge consequence for oil prices going forward. The regime has played its ’oil-weapon’ (closing or chocking the Strait of Hormuz). It is using it to achieve political goals. Deterrence: it needs to be so politically and economically expensive to attack Iran that it won’t happen again in the future. Or at least that the US/Israel thinks 10-times over before they attack again. The highest Brent crude oil closing price since the start of the war is $112.19/b last Friday. In comparison the 20-year inflation adjusted Brent price is $103/b. So Brent crude last Friday at $112.19/b isn’t a shockingly high price. And it is still far below the nominal high of $148/b from 2008 which is $220/b if inflation adjusted. So once in a lifetime Iran activates its most powerful weapon. The oil weapon. It needs to show the power of this weapon and it needs to reap political gains. Getting Brent to $112/b and intraday high of $119.5/b (9 March) isn’t a display of the power of that weapon. And it is not a deterrence against future attacks.
So if the hardliners remain in power in Iran, then the SoH will likely remain chocked all the way to US midterm elections and Brent crude will at a minimum go above the historical nominal high of $148/b from 2008.
Thus the outlook for the oil price for the rest of the year doesn’t depend all that much of whether Trump pulls a TACO or not. Stops bombing or not. It depends more on who is in charge in Iran. If it is the hardliners, then deterrence against future attacks via chocking of the SoH and high oil prices is the likely line of action. It is impacting the world but the Iranian ’oil-weapon’ is directed towards the US president and the the US midterm elections.
If a pragmatic faction gets to power in Iran, then a very prosperous future is possible. However, if power is shifting towards a more pragmatic faction in Iran then a completely different direction could evolve. Such a faction could possibly be open for cooperation with the US and the GCC and possibly put its issues versus Israel aside. Then the prosperity we have seen evolving in Dubai could be a possible future also for Iran.
So far it looks like the hardliners are fully in charge. As far as we can see, the hardliners are still fully in control in Iran. That points towards continued chocking of the SoH and oil prices ticking higher as global inventories (the oil market buffers) are drawn lower. And not just for a few more weeks, but possibly all the way to the US midterm elections.


Brent crude up USD 9/bl on the week… ”deal around the corner” narrative fades
Market Still Betting on Timely Resolution, But Each Day Raises Shortage Risk

Christian Kopfer om läget för oljan

Marknaden måste börja betrakta de höga kopparpriserna som det nya normala

Det fysiska spotpriset på brentolja har slagit nytt rekord

40 minuter med Javier Blas om hur världen verkligen påverkas av energikrisen

Elpriserna fördubblas, stor osäkerhet inför sommaren
Det fysiska spotpriset på brentolja har slagit nytt rekord
Marknaden måste börja betrakta de höga kopparpriserna som det nya normala
Christian Kopfer om läget för oljan
-
 Nyheter3 veckor sedan
40 minuter med Javier Blas om hur världen verkligen påverkas av energikrisen
-
 Nyheter4 veckor sedan
Elpriserna fördubblas, stor osäkerhet inför sommaren
-
 Nyheter3 veckor sedan
Det fysiska spotpriset på brentolja har slagit nytt rekord
-
 Nyheter3 veckor sedan
Marknaden måste börja betrakta de höga kopparpriserna som det nya normala
-
 Nyheter2 veckor sedan
Christian Kopfer om läget för oljan
-

 Nyheter3 veckor sedan
Efter tillväxten: Guldbrev satsar på expansion i Europa
-
Analys5 dagar sedan
Market Still Betting on Timely Resolution, But Each Day Raises Shortage Risk
-
Analys16 timmar sedan
Brent crude up USD 9/bl on the week… ”deal around the corner” narrative fades