

Analys
SHB Råvarubrevet 18 januari 2013
 Allt fokus på USA
Vi håller fast vid en i grunden positiv syn på global makro i början på året, framförallt relaterat till Kina och USA. Synen på stigande riskaptit globalt ligger fast även om amerikansk politik kan hålla tillbaka något. Välkomna tecken på förbättringar i Kina kom denna vecka i form av BNP tillväxt för sista kvartalet på 7,9 %, upp från 7,4 % i Q3. Allt pekar nu på att botten i den kinesiska konjunkturcykeln var i september och att återhämtningen sprider sig.
Amerikanska konsumenter möter däremot stramare finanspolitik 2013. Förbättrade bo-, aktie- och arbetsmarknader ger dock framtidshopp. Aktiviteten inom industrin ser svagare ut än förväntat i inledningen på året trots att viss finanspolitisk osäkerhet skingrats. Risk finns att stundande finanspolitiska förhandlingar håller tillbaka aktiviteten fram till sista februari. Om inga nya överenskommelser kommer till stånd kommer skuldtaket slås vid mitten av februari eller något därefter, automatiska nedskärningar (0.5% av BNP) stundar den första mars, och den 27:e mars tvingas staten att stänga ned icke-essentiella områden
Basmetallerna
Lagerpåfyllnad och Kinas återhämtning i fokus
Kinas återhämtning har givit stöd åt metallmarknaden under hösten där man successivt byggt upp lager som betats av tidigare under året. Vi förväntar oss att uppgången fortsätter under första kvartalet även om ett skuldtyngt Europa samt diskussionerna kring USA’s skuldtak begränsar uppgången något. Blandade rörelser där nickel och koppar visat mest styrka och stigit med 3,4 respektive 1,94 %. Zink och aluminium har däremot tappat 2,5 % respektive 0,8 %.
Uppgången på koppar kom av sig och kontraktet handlades på 2-veckors lägsta efter att Barack Obama gick ut och varnade om en ekonomisk katastrof ifall kongressen misslyckas med att öka landets upplåningsgräns, men har nu återhämtat sig efter positiva försäljningssiffror från USA. Vi håller koppar som vår favorit bland basmetallerna, men ser positivt på hela sektorn under det kommande kvartalet
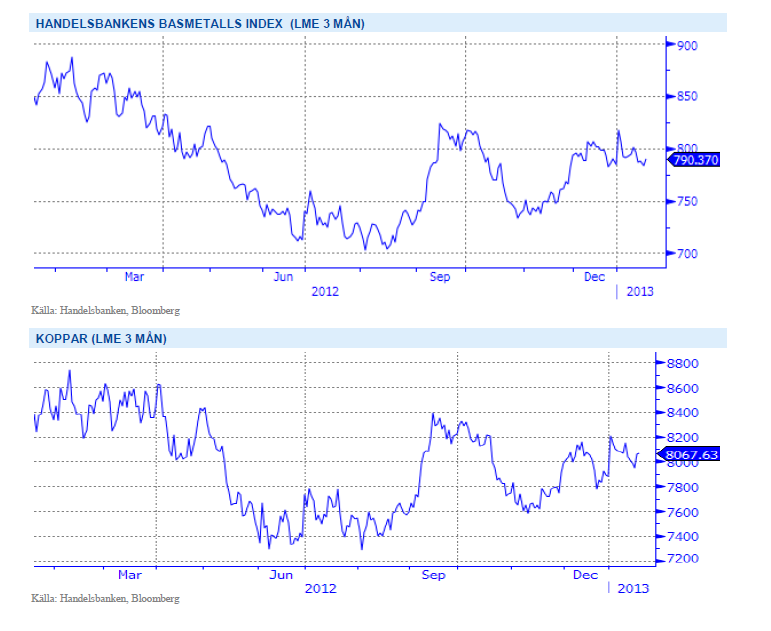
Med Kinas återhämtning i ryggen tror vi på stigande priser på basmetaller. Vi tror på: BASMET H
Ädelmetaller
Låga räntor stödjer ädelmetallerna
2012 avslutades med ganska stora prisrörelser för ädelmetaller, de avslutande veckorna förra året såg guldet falla med 4 procent, och silvret med hela 10 procent. Dessa fall har i stort sett återhämtats under inledningen av 2013, och vi håller kvar vid vår positiva syn. Dock är vi lite mindre övertygade för tillfället, och vi anser att man bör vara observant på utvecklingen de närmaste veckorna.
De underliggande orsakerna till vår positiva syn är alltjämt de extremt låga räntorna världen över, och den risk vi ser för stigande inflationsförväntningar framöver. Låga räntor gör ju som bekant att alternativkostnaden för att hålla guld blir låg, och sjunkande korta räntor har historiskt varit nära länkat till stigande guldpris. Samtidigt så har guldet visat sig vara ett mycket bra skydd mot inflation, och en tillgång som tenderat att fungera bra när det varit kriser och finansiell oro i världen.
Det vi ser nu när vi går in i 2013 är begynnande optimism om både återhämtning i Kina och USA, och möjligheter till en överenskommelse under februari när det gäller den amerikanska budgeten. Detta kan leda till viss kortsiktig press nedåt på guldpriset, så vi känner att det är bra att ”dansa nära nödutgången” när det gäller långa guldpositioner. Men – skulle Obama och republikanerna inte nå en överenskommelse, då kommer guldet sannolikt vara en vinnare.
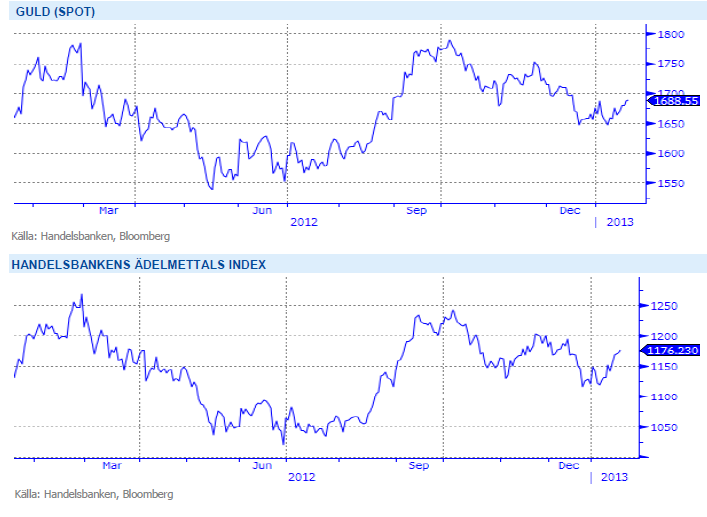
Inför 2013 är vi fortsatt positiva till ädelmetaller. Fortsatt mjuk penningpolitik, svag makroekonomi, starkare efterfrågan från Kina och Indien och att centralbanker i utvecklingsekonomier köper guld gör att vi tror på: ADELMET H
Energi
Svagt för både el och utsläppsrätter
Sentimentet fortsätter ned på elmarknaden där kontraktet Q2 2013 faller med över 2 procent. En tillfällig prisuppgång efter att Ringhals tillfälligt fallit ur. Såväl energikol (-3 % i år) som utsläppsrätter (-22% i år!) faller och de låga elpriserna på kontinenten bidrar till det svaga sentimentet på nordiska el. Det enda som givit stöd är en försvagad energibalans om 3 TWh ned till -16TWh (blått i grafen nedan) men prognoserna slår nu om från högtrycksbetonat väder till normala temperaturer och nederbörd för perioden så de flesta faktorer pekar ned. Kontraktet Q2 13 bör kunna falla ytterligare någon euro eller två. Intressant att se huruvida EU Kommissionen väljer att agera för att upprätta förtroendet för CO2-marknaden, annars finns det stor risk att rätterna faller tillbaka mot 0 nivån precis som de gjorde 2007.
Oljan har nu handlats i intervallet 105-117 USD sedan augusti förra året, och frågan är nu om detta mönster kommer fortsätta även under detta år. Vi ser ett antal risker som har god potential att föra oljan ut ur kanalen de kommande 6 månaderna. Tillsvidare håller vi neutral syn på oljan då ingen sida väger tyngre än den andra i nuläget. Det som talar för stigande priser är en starkare global konjunktur där vi har Kina i spetsen. Vidare har Saudiarabien, som lovat kompensera för Irans produktionsbortfall, den senaste tiden sänkt produktionen för att stabilisera priset när den globala konjunkturen blivit sämre under 2012. Även fortsatt politisk risk i Mellanöstern med risk för produktionsstörningar talar för ett högre pris. Samtidigt finns risk på nedsidan om Irans blockerade export kommer tillbaka till marknaden, den stigande produktionen i USA och Kanada och konjunkturrisker i USA och Europa. OECD-lagren är dessutom på femårs högsta.
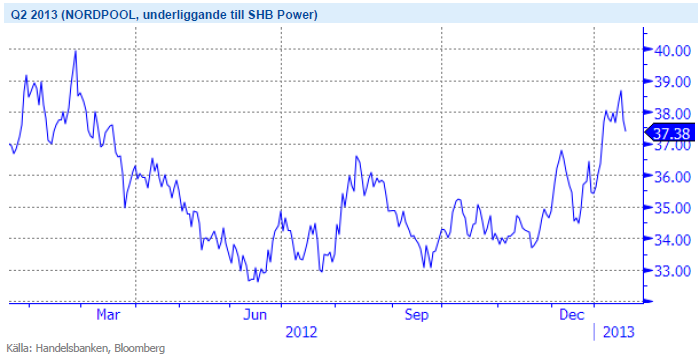
Fallande priser på energikol och utsläppsrätter parat med låga elpriser på kontinenten bidrar till det svaga sentimentet på nordisk el. Vi tror på: BEAR EL H
Livsmedel
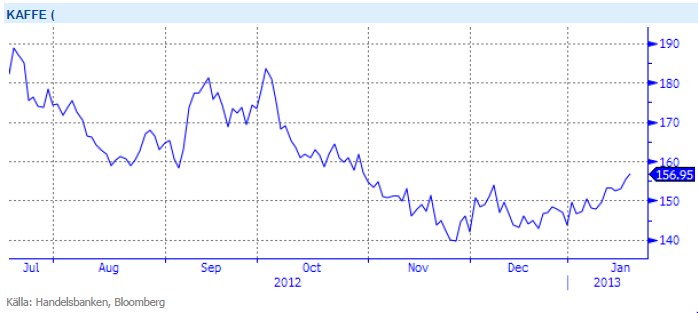
Kaffepriset stiger från de rekordlåga nivåerna
Kaffepriset har under en fem års period varit uppe och nosat på nivåer kring 3 dollar/Ib men handlas idag till det halverade priset. Rekordskördar i de kaffeproducerande länderna, Brasilien och Vietnam fick kaffepriset att falla 37 procent under 2012 och därmed var kaffe den råvara som backade mest under året som gått. Det har rapporterats om svampsjukdomar som spridits bland kaffeträd och dess blad, det råder därför en viss oro att dessa förstörelser kan komma att påverka nästa års skörd i Centralamerika. Detta har fått priset på Arabica terminen (underliggande till SHB Coffee) att stiga ca 8 procent sen årsskiftet.
Priset på vete har stigit under veckan och uppgången är till stor del påverkad av USDA:s rapport från förra fredagen där lagernivåer vad mindre än för väntat. Viss oro över situationen i USA där höstvetet bland annat behöver mer regn innan vintervilan är över, än finns det dock tid och oron är ganska begränsad. Effekten av förra veckans WASDE-rapport är nu över och det kommer krävas mer negativa nyheter för att priserna ska stiga ytterligare. Grödorna närmar sig dock ett känsligt utvecklingsstadium i flera viktiga spannmålsregioner och så länge risken för väderproblem inte känns mindre överhängande väntar vi oss en marknad som får ganska svårt att gå nedåt. Givet inga större väderproblem bör vi dock vänta oss fallande priser lite längre fram på året, veteproduktionen 2013 beräknas nå klart större volymer än 2012, en del prognoser pekar t.ex. på en drygt 8-procentig uppgång för den europeiska veteproduktionen.
Vi ser fortfarande framför oss fallande priser på livsmedelsektor på lite längre sikt. Vi tror på: LIVSMEDEL S H
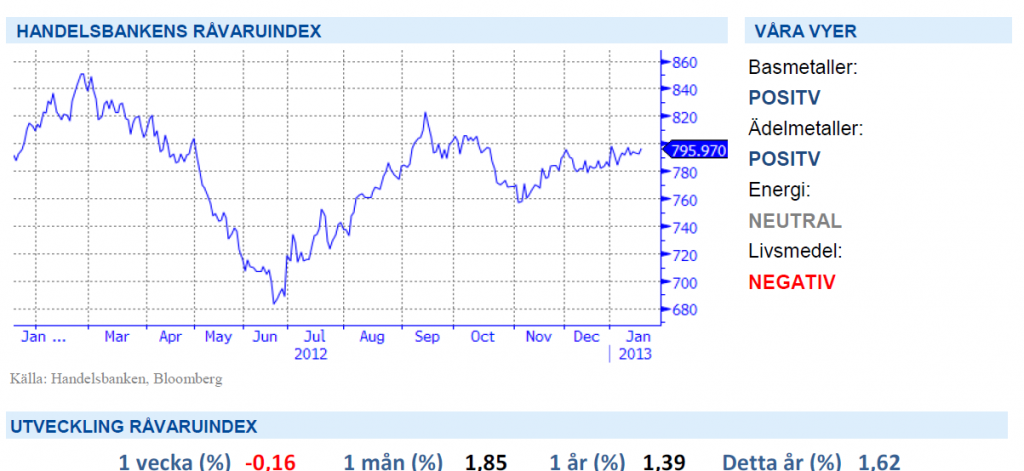
Handelsbankens Råvaruindex
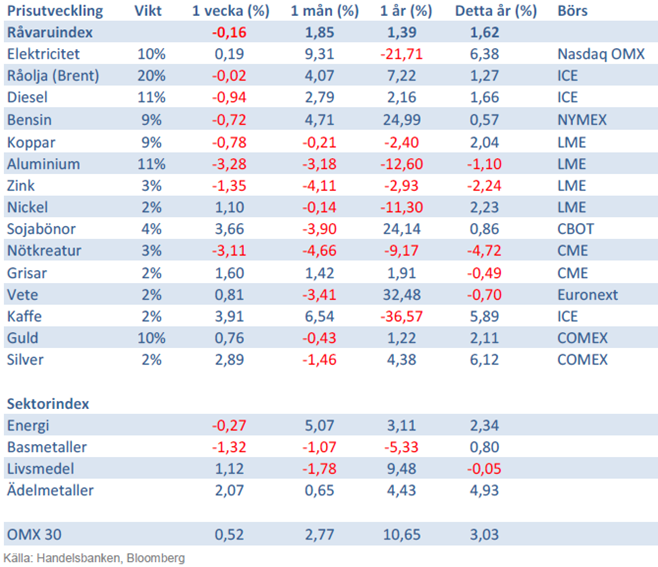
Handelsbankens råvaruindex består av de underliggande indexen för respektive råvara. Vikterna är bestämda till hälften från värdet av global produktion och till hälften från likviditeten i terminskontrakten.
[box]SHB Råvarubrevet är producerat av Handelsbanken och publiceras i samarbete och med tillstånd på Råvarumarknaden.se[/box]
Ansvarsbegränsning
Detta material är producerat av Svenska Handelsbanken AB (publ) i fortsättningen kallad Handelsbanken. De som arbetar med innehållet är inte analytiker och materialet är inte oberoende investeringsanalys. Innehållet är uteslutande avsett för kunder i Sverige. Syftet är att ge en allmän information till Handelsbankens kunder och utgör inte ett personligt investeringsråd eller en personlig rekommendation. Informationen ska inte ensamt utgöra underlag för investeringsbeslut. Kunder bör inhämta råd från sina rådgivare och basera sina investeringsbeslut utifrån egen erfarenhet.
Informationen i materialet kan ändras och också avvika från de åsikter som uttrycks i oberoende investeringsanalyser från Handelsbanken. Informationen grundar sig på allmänt tillgänglig information och är hämtad från källor som bedöms som tillförlitliga, men riktigheten kan inte garanteras och informationen kan vara ofullständig eller nedkortad. Ingen del av förslaget får reproduceras eller distribueras till någon annan person utan att Handelsbanken dessförinnan lämnat sitt skriftliga medgivande. Handelsbanken ansvarar inte för att materialet används på ett sätt som strider mot förbudet mot vidarebefordran eller offentliggörs i strid med bankens regler.


Wild moves yesterday. Brent crude traded to a high of $114.43/b and a low of $96.0/b and closed at $99.94/b yesterday.

US – Iran negotiations ongoing or not? What a day. Donald Trump announced that good talks were ongoing between Iran and the US and that the 48 hour deadline before bombing Iranian power plants and energy infrastructure was postponed by five days subject to success of ongoing meetings. Iranian media meanwhile stated that no meetings were ongoing at all.
Today we are scratching our heads trying to figure out what yesterday was all about.
Friends and family playing the market? Was it just Trump and his friends and family who were playing with oil and equity markets with $580m and $1.46bn in bets being placed by someone in oil and equity markets just 15 minutes before Trump’s announcement?
Was Trump pulling a TACO as he reached his political and economic pain point: Brent at $112/b, US Gas at $4/gal, SPX below 200dma and US 10yr above 4.4%?
Different Iranian factions with Trump talking with one of them? Are there real negotiations going on but with the US talking to one faction in Iran while another, the hardliners, are not involved and are denying any such negotiations going on?
Extending the ultimatum to attack and invade Kharg island next weekend? Or, is the five day delay of the deadline a tactical decision to allow US amphibious assault ships and marines to arrive in the Gulf in the upcoming weekend while US and Israeli continues to degrade Iranian military targets till then. And then next weekend a move by the US/Israel to attack and conquer for example the Kharg island?
We do not really know which it is or maybe a combination of these.
We did get some kind of TACO ydy. But markets have been waiting for some kind of TACO to happen and yesterday we got some kind of TACO. And Brent crude is now trading at $101.5/b as a result rather than at $112-114/b as it did no the high yesterday.
But what really matters in our view is the political situation on the ground in Iran. Will hardliners continue to hold power or will a more pragmatic faction gain power?
If the hardliners remain in power then oil pain should extend all the way to US midterm elections. The hardliners were apparently still in charge as of last week. Iran immediately retaliated and damaged LNG infrastructure in Qatar after Israel hit Iranian South Pars. The SoH was still closed and all messages coming out of Iran indicated defiance. Hardliners continues in power has a huge consequence for oil prices going forward. The regime has played its ’oil-weapon’ (closing or chocking the Strait of Hormuz). It is using it to achieve political goals. Deterrence: it needs to be so politically and economically expensive to attack Iran that it won’t happen again in the future. Or at least that the US/Israel thinks 10-times over before they attack again. The highest Brent crude oil closing price since the start of the war is $112.19/b last Friday. In comparison the 20-year inflation adjusted Brent price is $103/b. So Brent crude last Friday at $112.19/b isn’t a shockingly high price. And it is still far below the nominal high of $148/b from 2008 which is $220/b if inflation adjusted. So once in a lifetime Iran activates its most powerful weapon. The oil weapon. It needs to show the power of this weapon and it needs to reap political gains. Getting Brent to $112/b and intraday high of $119.5/b (9 March) isn’t a display of the power of that weapon. And it is not a deterrence against future attacks.
So if the hardliners remain in power in Iran, then the SoH will likely remain chocked all the way to US midterm elections and Brent crude will at a minimum go above the historical nominal high of $148/b from 2008.
Thus the outlook for the oil price for the rest of the year doesn’t depend all that much of whether Trump pulls a TACO or not. Stops bombing or not. It depends more on who is in charge in Iran. If it is the hardliners, then deterrence against future attacks via chocking of the SoH and high oil prices is the likely line of action. It is impacting the world but the Iranian ’oil-weapon’ is directed towards the US president and the the US midterm elections.
If a pragmatic faction gets to power in Iran, then a very prosperous future is possible. However, if power is shifting towards a more pragmatic faction in Iran then a completely different direction could evolve. Such a faction could possibly be open for cooperation with the US and the GCC and possibly put its issues versus Israel aside. Then the prosperity we have seen evolving in Dubai could be a possible future also for Iran.
So far it looks like the hardliners are fully in charge. As far as we can see, the hardliners are still fully in control in Iran. That points towards continued chocking of the SoH and oil prices ticking higher as global inventories (the oil market buffers) are drawn lower. And not just for a few more weeks, but possibly all the way to the US midterm elections.
A brief sigh of relief yesterday as oil infra at Kharg wasn’t damaged. But higher today. Brent crude dabbled around a bit yesterday in relief that oil infrastructure at Iran’s Kharg island wasn’t damaged. It traded briefly below the 100-line and in a range of $99.54 – 106.5/b. Its close was near the low at $100.21/b.
No easy victorious way out for Trump. So no end in sight yet. Brent is up 3.2% today to $103.4/b with no signs that the war will end anytime soon. Trump has no easy way to declare victory and mission accomplished as long as Iran is in full control of the Strait of Hormuz while also holding some 440 kg of uranium enriched to 60% and not far from weapons grade at 90%. As long as these two factors are unresolved it is difficult for Trump to pull out of the Middle East. Naturally he gets increasingly frustrated over the situation as the oil price and US retail gas prices keeps ticking higher while the US is tied into the mess in the Middle East. Trying to drag NATO members into his mess but not much luck there.
When commodity prices spike they spike 2x, 3x, 4x or 5x. Supply and demand for commodities are notoriously inflexible. When either of them shifts sharply, the the price can easily go to zero (April 2022) or multiply 2x, 3x, or even 5x of normal. Examples in case cobalt in 2025 where Kongo restricted supply and the price doubled. Global LNG in 2022 where the price went 5x normal for the full year average. Demand for tungsten in ammunition is up strongly along with full war in the middle east. And its price? Up 537%.
Why hasn’t the Brent crude oil price gone 2x, 3x, 4x or 5x versus its normal of $68/b given close to full stop in the flow of oil of the Strait of Hormuz? We are after all talking about close to 20% of global supply being disrupted. The reason is the buffers. It is fairly easy to store oil. Commercial operators only hold stocks for logistical variations. It is a lot of oil in commercial stocks, but that is predominantly because the whole oil system is so huge. In addition we have Strategic Petroleum Reserves (SPRs) of close to 2500 mb of crude and 1000 mb of oil products. The IEA last week decided to release 400 mb from global SPR. Equal to 20 days of full closure of the Strait of Hormuz. Thus oil in commercial stocks on land, commercial oil in transit at sea and release of oil from SPRs is currently buffering the situation.
But we are running the buffers down day by day. As a result we see gradually increasing stress here and there in the global oil market. Asia is feeling the pinch the most. It has very low self sufficiency of oil and most of the exports from the Gulf normally head to Asia. Availability of propane and butane many places in India (LPG) has dried up very quickly. Local prices have tripled as a result. Local availability of crude, bunker oil, fuel oil, jet fuel, naphtha and other oil products is quickly running down to critical levels many places in Asia with prices shooting up. Oman crude oil is marked at $153/b. Jet fuel in Singapore is marked at $191/b.
Oil at sea originating from Strait of Hormuz from before 28 Feb is rapidly emptied. Oil at sea is a large pool of commercial oil. An inventory of oil in constant move. If we assume that the average journey from the Persian Gulf to its destinations has a volume weighted average of 13.5 days then the amount of oil at sea originating from the Persian Gulf when the the US/Israel attacked on 28 Feb was 13.5 days * 20 mb/d = 269 mb. Since the strait closed, this oil has increasingly been delivered at its destinations. Those closest to the Strait, like Pakistan, felt the emptying of this supply chain the fastest. Propane prices shooting to 3x normal there already last week and restaurants serving cold food this week is a result of that. Some 50-60% of Asia’s imports of Naphtha normally originates from the Persian Gulf. So naphtha is a natural pain point for Asia. The Gulf also a large and important exporter of Jet fuel. That shut in has lifted jet prices above $200/b.
To simplify our calculations we assume that no oil has left the Strait since that date and that there is no increase in Saudi exports from Yanbu. Then the draining of this inventory at sea originated from the Persian Gulf will essentially look like this:
The supply chain of oil at sea originating from the Strait of Hormuz is soon empty. Except for oil allowed through the Strait of Hormuz by Iran and increased exports from Yanbu in the Red Sea. Not included here.

Oil at sea is falling fast as oil is delivered without any new refill in the Persian Gulf. Waivers for Russian crude is also shifting Russian crude to consumers. Brent crude will likely start to feel the pinch much more forcefully when oil at sea is drawn down another 200 mb to around 1000 mb. That is not much more than 10 days from here.

Oil and oil products are starting to become very pricy many places. Brent crude has still been shielded from spiking like the others.

Closing at highest since Aug 2022. Brent crude gained 9.2% yesterday. The trading range was limited to $95.2 – 101.85/b with a close at $100.46/b and higher than the Monday close of $98.96/b. Ydy close was the highest close since August 2022. This morning Brent is up 2% to $102.4/b and is trading at the highest intraday level since Monday when it high an intraday high of $119.5/b.
A military hit at Iran’s Kharg island would be a big, big bang for the oil price. The big, big risk for the weekend is that oil infrastructure could be damaged. For example Iran’s Kharg island which is Iran’s major oil export hub. If damaged we would have a longer lasting loss of supply stretching way beyond Trump’s announced ”two more weeks”. It will make the spot price spike higher and it will lift the curve. Brent crude 2027 swap would jump above $80/b immediately. An attack on Kharg island would naturally lead Iran to strike back at other oil infrastructures in the Gulf. Especially those belonging to countries who harbor US military bases. I.e. countries who essentially are supporting the attack by US and Israel towards Iran. Though if not in spirit, then in practical operational terms. An attack on Kharg island would not just lead to a lasting outage of supply from Iran until it would be repaired. It would immediately endanger other oil infrastructure in the region as well and additional lasting loss of supply.
No one in their right mind would dare to sit short oil over the coming weekend. Oil is thus set to close the week at a very strong note today.
Prepare for another 400 mb SPR release next week. This week’s announcement of a 400 mb release from Strategic Oil Reserves totally underwhelmed the market with the oil price going higher rather than lower following the announcement. For one it means that the market expects the war and the closure of the Strait of Hormuz to last longer than Trump’s recent announced ”two more weeks”. 400 mb only amounts to 20 days of lost supply to the world through Hormuz and we are already at day 14. So next week when we are getting close to the 20 day mark, we are likely to see another announcement of another 400 mb release of SPR stocks to the market. Preparing for the next 20 days of war.
Global oil logistics in total disarray. We have previously addressed the issue of the huge logistical web of the global oil market which is now in total disarray. The logistical disruption started to fry the oil market at the end of last week. Helped to spike the oil market on Monday. What we hear from our shipping clients is that the problems with supply of fuels locally in Korea, Singapore, India and Africa are getting worse with physical availability of fuels there drying up. It is getting increasingly difficult to find physical supply of bunker oil with local, physical prices shooting way higher than financial benchmarks. To the point that biofuels have become the cheap option many places. Availability of fuels in the US is still good. Not so surprising as the US is self-sufficient with crude and refineries.
The disruption in global oil logistics doesn’t seem to improve. Rather the opposite. If you cannot get fuel to run your ships, then how can you distribute fuels to where it is needed.
Buy Brent Dec-2026 calls with strike $150/b!! As the days goes by the oil price is ticking higher while Trump is getting one day closer to US midterm elections. Trump was betting that he could put this war to bead well before November. But that will probably not be up to him to decide. It will be up to Iran to decide when to reopen the Strait of Hormuz. It is very hard to imagine that Iran will let Trump easily off the hock after he has killed its Supreme Leader. This will likely go all the way to November. Buy Brent Dec-2026 calls with strike $150/b!!
Brent closed at highest since 2022 ydy. Will end this Friday at a very strong note! Consumers still dreaming of $60/b oil


Christian Kopfer om läget för oljan

Marknaden måste börja betrakta de höga kopparpriserna som det nya normala

Det fysiska spotpriset på brentolja har slagit nytt rekord

40 minuter med Javier Blas om hur världen verkligen påverkas av energikrisen

Efter tillväxten: Guldbrev satsar på expansion i Europa
40 minuter med Javier Blas om hur världen verkligen påverkas av energikrisen

Elpriserna fördubblas, stor osäkerhet inför sommaren

MP Materials, USA:s svar på Kinas dominans över sällsynta jordartsmetaller
Det fysiska spotpriset på brentolja har slagit nytt rekord

Studsvik har idag ansökt om att få bygga 1200-1600 MW kärnkraft i Valdemarsvik
-
 Nyheter2 veckor sedan
40 minuter med Javier Blas om hur världen verkligen påverkas av energikrisen
-
 Nyheter4 veckor sedan
Elpriserna fördubblas, stor osäkerhet inför sommaren
-
 Nyheter4 veckor sedan
MP Materials, USA:s svar på Kinas dominans över sällsynta jordartsmetaller
-
 Nyheter2 veckor sedan
Det fysiska spotpriset på brentolja har slagit nytt rekord
-
 Nyheter4 veckor sedan
Studsvik har idag ansökt om att få bygga 1200-1600 MW kärnkraft i Valdemarsvik
-
 Nyheter2 veckor sedan
Marknaden måste börja betrakta de höga kopparpriserna som det nya normala
-

 Nyheter4 veckor sedan
Matproduktion är beroende av gödsel, Gulfkriget skapar brist
-
Analys4 veckor sedan
TACO (or Whatever It Was) Sends Oil Lower — Iran Keeps Choking Hormuz