

Analys
SEB Jordbruksprodukter, 21 januari 2013
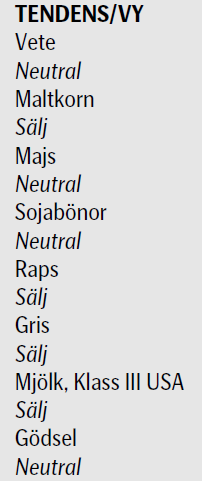
 Det var allmän prisuppgång – mot de fallande pristrenderna – i veckan på spannmål och oljeväxter. Även om torkan i USA slog nya rekord i veckan som gick, ser den tekniska bilden inte så tydligt positiv ut. Vi går därför över från köprekommendation på vete och majs, till neutral rekommendation. Vi byter rekommendation från sälj till neutral på sojabönor. Effekten av WASDE-rapporten har ebbat ut och på ena sidan har marknaden nu torkan i USA och kanske bristen på nederbörd i Argentina. På den andra finns det faktum att priset är högt och därmed ska stimulera till högre produktion.
Ny börs för durum-vete öppnar i Italien
 Borsa Italiana, som driver den italienska aktiebörsen i Milano, startar handel med terminer på durumvete idag, måndagen den 21 januari. Futureskontrakten går under namnet ”AGREX”. Syftet är att hjälpa pastaproducenterna att hantera prissvängningarna. Italien är också världens största producent av grödan, som också går på export till länder i Nordafrika och Mellanöstern, där den anrättas till couscous. Barilla, som är världens största pastaproducent och köper 70% av sin råvara från Italien, välkomnar börsen och de möjligheter den ger att minska riskerna. Barilla har också väglett börsen i skapandet av ett kontrakt som ska vara så användbart som möjligt för riskhantering i branschen. AGREX-kontrakten är på 50 ton och kontraktsmånaderna är mars, maj, september och december. Handeln sker på derivatbörsen IDEM och leveranspunkten är den syditalienska staden Foggia.
Odlingsväder
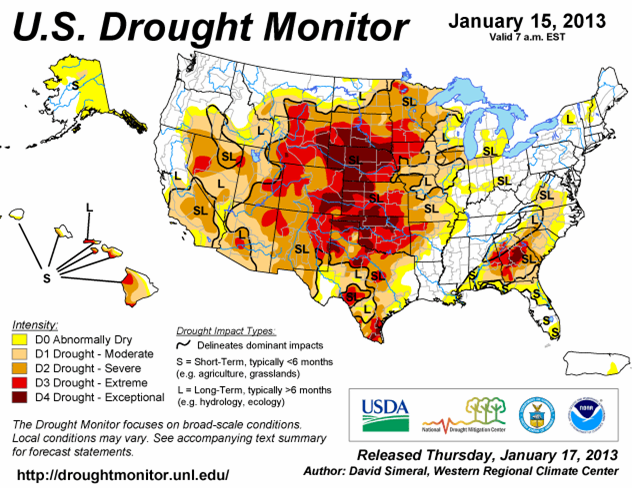
Torkan i USA håller i sig, som vi ser i den senaste ”Drought Monitor”, som publicerades i torsdags. Sedan förra veckan har torkan förvärrats.
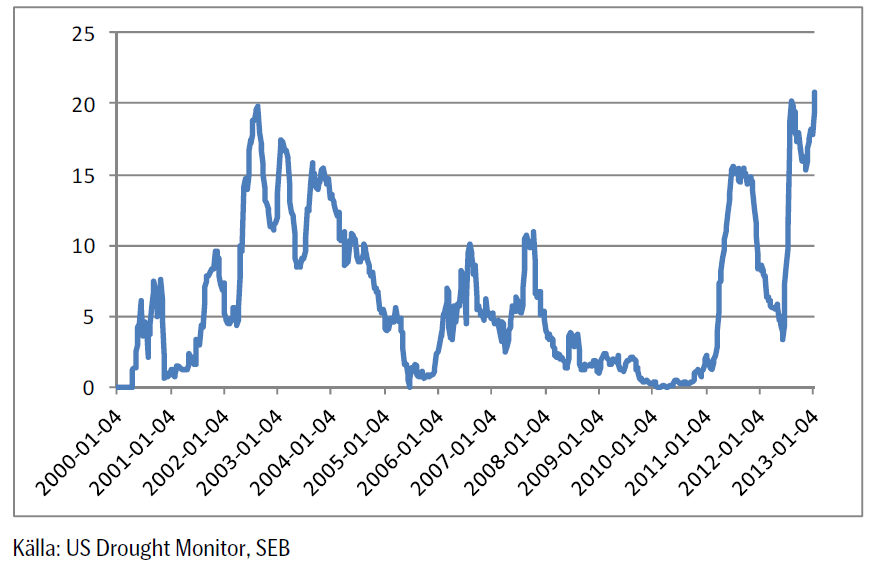
Om vi summerar andelen av USA som är drabbad av D3 (extrem torka) och D4 (exceptionell torka) och gör ett diagram över tiden, får vi nedanstående bild. Där ser vi att 20.8% av USA är drabbat av de svåraste kategorierna av torka. Det är det mesta de senaste tio åren, så långt det finns data tillgängligt.
Torsdagens långtidsprognos från NOAA sade att ”varmt och torrt” väder kommer att fortsätta råda på Prärien fram till och under sommaren.
Det regnar normalt i norra Brasilien. Argentina och södra Brasilien är torrt och väntas fortsätta vara torrt så långt som prognoserna är tillförlitliga (10 dagar). Argentina har varit torrt ett ganska långt tag nu. Hela EU får mer nederbörd än normalt nu, utom Skandinavien. Det är också kallare än normalt i praktiskt taget hela EU.
Den senaste IGC-rapporten
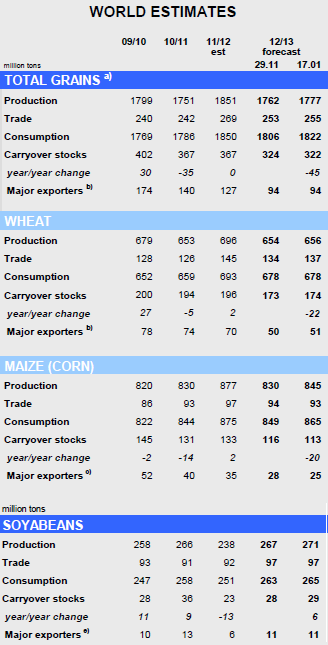
IGC (International Grains Council) justerar upp sitt estimat något för den globala spannmålsproduktionen 2012/13 från 1762 mt till 1777 mt, vilket dock är betydligt lägre än produktionen 2011/12. Trots en förväntad nedgång i konsumtionen för första gången på 14 år, så väntas lagren att minska med 45 mt.
Den globala produktionen av vete 2012/13 justeras upp med 2 mt till 656 mt, som en följd av högre produktion i Australien (+0.5 mt) , Kanada (+0.5 mt), Kina (+0.6 mt) och EU-27 (+0.3 mt), vilket dock är en minskning från 696 mt 2011/12. Utgående lager justeras upp med 1 mt till 174 mt, vilket dock är en minskning med 22 procent på årsbasis till följd av markant nedgång i OSS. Fokus ligger nu på tillståndet för norra halvklotets höstgrödor 2013/13, särskilt för de områden i USA som drabbats av torka. På andra håll i världen är utsikterna generellt mer lovande och den globala produktionen förväntas preliminärt att öka med 4 procent på årsbasis för 2013/14, med en ökning av areal på 2 procent.
IGC justerar upp estimatet för den globala majsproduktionen med nästan 2 procent jämfört med förra månaden som en följd av högre estimat för Kina (+10 mt), USA (+1.4 mt) och ljusare utsikter för Argentina, men då även konsumtionen justeras upp så revideras utgående lager ner med 3 mt till 113 mt, den snävaste nivån på nio år. Den globala produktionen av sojabönor 2012/13 justeras upp av IGC till rekordhöga 271 mt, vilket är en ökning med 14 procent på årsbasis som en följd av en förväntad markant ökning av produktionen i Sydamerika. Den globala produktionen av raps/canola 2012/13 förväntas minska med 3 procent på årsbasis.

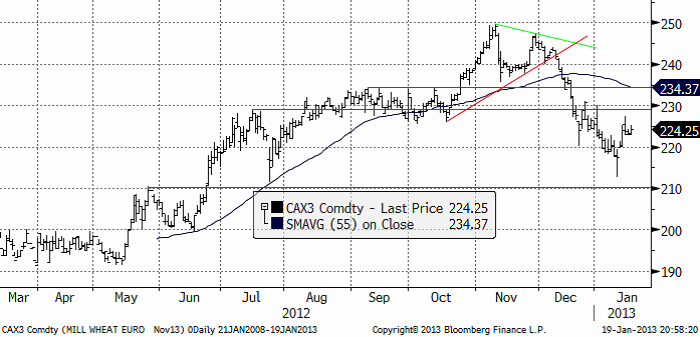
Vete
Nedan ser vi november (2013) kontraktet, där priset föll kraftigt i fredags, men återhämtade sig och stängde på 217.50, nästan oförändrat på dagen.
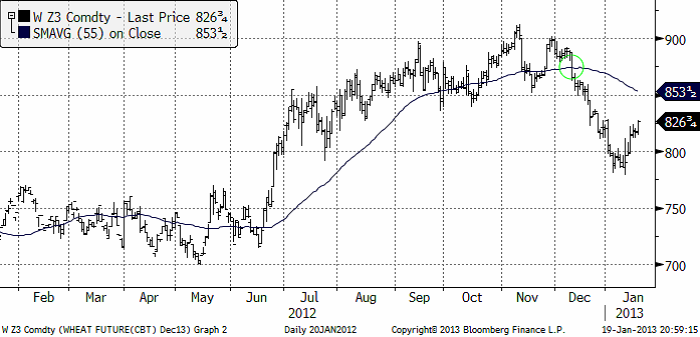
Nedan ser vi decemberkontraktet på CBOT. Chicago-vetet var ovanligt starkt i veckan, men så är det också världens billigaste vete.
Vi ser här en bild på terminskurvorna för Matif och Chicago, båda omräknade till euro per ton.
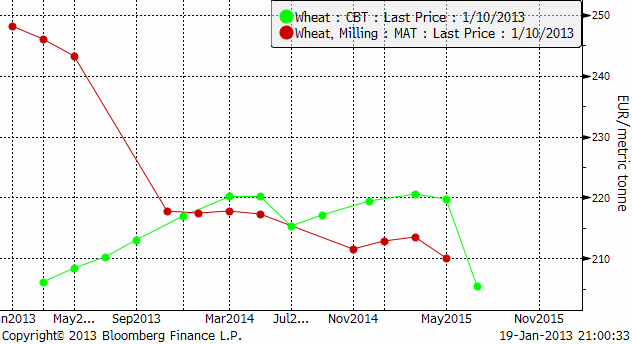
Av diagrammet ovan ser man att gammal skörd av Matif-vete är avsevärt mycket dyrare än Chicagovetet. Maj-terminen handlas dessutom lägre än mars-terminen. Det säger att den som väntar med att sälja till maj riskerar att få väsentligt sämre betalt – och dessutom får bära ränte- och lagerkostnader fram till dess.
Den som vill ta en position på högre priser och har fysiskt vete i lager gör därför sannolikt bäst i att sälja den fysiska varan och istället köpa terminer.
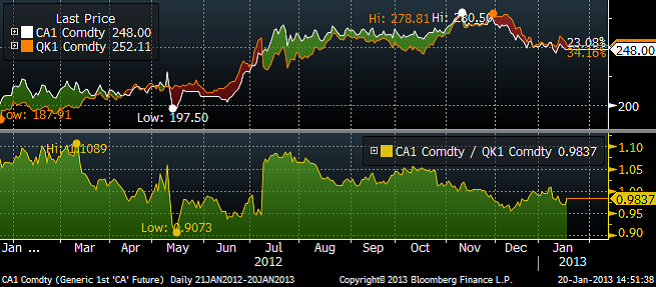
En annan utveckling vi sett den senaste tiden är att bristen på fodervete i norra Europa inneburit att denna blivit dyrare än brödvete. I veckan gick en last fodervete från Frankrike till norra Tyskland erfar vi.
I diagrammet nedan ser vi, i den nedre delen, kvoten mellan ”spotkontraktet” på Matif och spotkontraktet på Liffe för engelskt fodervete. Vi ser att fodervetet i år blivit ett par procent dyrare än brödvetet.
Strategie Grains justerar ner sitt estimat för EU:s veteproduktion 2013/14 med 1.7 mt till 133.3 mt som en följd av det blöta vädret under sådden och lägre areal. Nedjusteringar görs för grödor i bl.a Sverige, Danmark, Frankrike Tyskland, och framförallt Storbritannien. En produktion på 133 mt skulle dock fortfarande innebära en förbättring jämfört med de 123.9 mt som unionen uppnådde förra året då blött väder förstörde skördar i delar av nordvästra Europa medan de östra delarna drabbades av torka.
Argentinas jordbruksdepartement sänkte skördeestimatet med 400,000 ton till 10.1 mt. USDA hade 11 mt i WASDE:n från den 11 januari. Buenos Aires Grain Exchange (BAGE) ligger på 9.8 mt.
Det kinesiska vetepriset FOB lagerhus i Shanghai (svart linje nedan) har hittills i år fallet ner med 5 euro till 294.74 euro / ton. Vi får tolka det som ett styrketecken, eftersom det är ordentligt mycket mindre än t ex Matif (blå linje nedan).
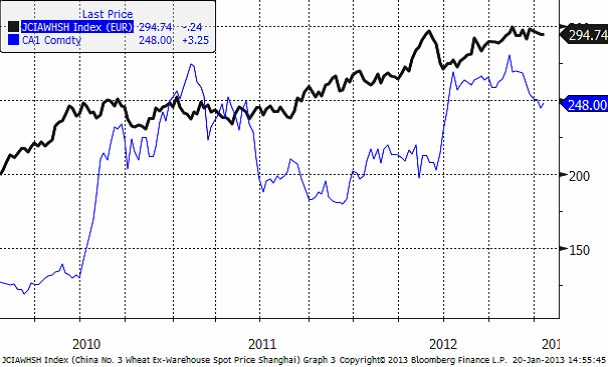
Fundamentalt talar de flesta faktorer för ett stigande pris. Rapporten från Strategie Grains gör det däremot inte. Tekniskt ser uppgången ut som en rekyl i en fallande marknad. Därför går vi nu över till neutral rekommendation på vete.
Maltkorn
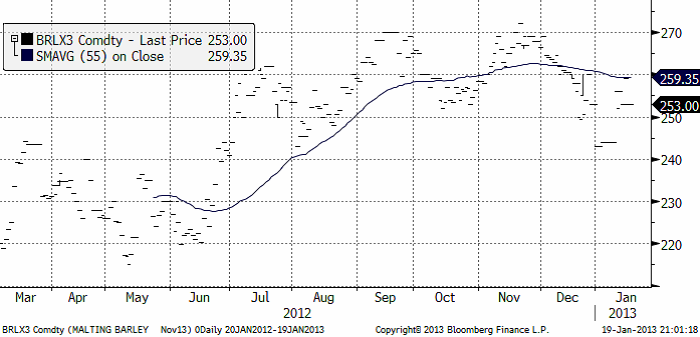
November 2013-kontraktet steg först upp till 260 euro men föll sedan ner till 253 euro, 1 euro högre än förra veckans stängning. Detta innebär att 240 euro-nivån höll. Där fanns verkligen motiverade köpare.
Potatis
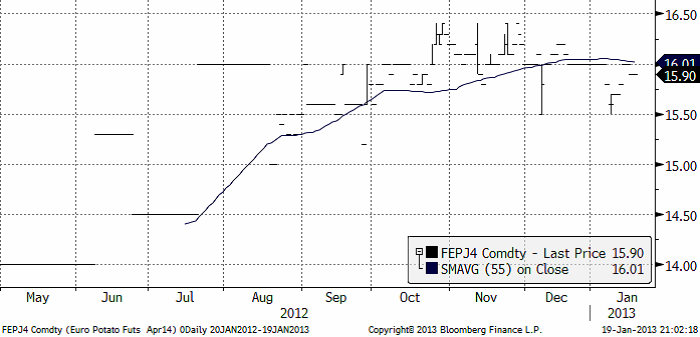
Potatispriset för leverans i april nästa år (2014) steg från 15.70 för en vecka sedan till 15.90 i fredags vid stängning.
Majs
Majspriset (december 2013) fortsatte att stiga hela förra veckan, efter WASDE-rapporten fredagen den 11 januari. Tekniskt ser det ut som en rekyl uppåt mot en fallande trend. 600 cent på decemberkontraktet har tidigare bevisat sig vara en viktig nivå, som nu fungerar som ett motstånd. Den tekniska analysen indikerar alltså att prisuppgången efter lager- och WASDE-rapporten från USDA, börjar närma sig sitt slut och att trenden nedåt kan fortsätta.
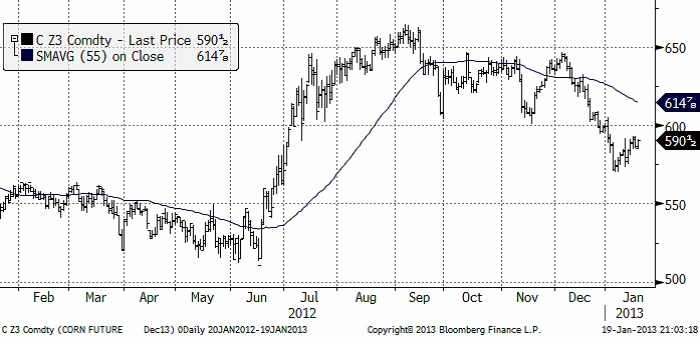
Fundamentalt pekar nyhetsflödet dock i motsatt riktning. Nyheterna, särskilt NOAA:s långtidsprognos om varmt och torrt väder i centrala USA (corn belt), gör att oron ökat i veckan.
Den veckovisa exportstatistiken för majs från USA förbättrades 16 Mbu, till en ackumulerad nivå på 518 Mbu för marknadsföringsåret. Det är dock 49% mindre än förra året.
Antalet nötkreatur i USA rapporteras nu ligga på 60-års-lägsta, efter att de slaktats ut i brist på foder (crop condition var ännu sämre för betesmark i USA, än de var för majs i somras/höstas).
BAGE rapporterade i veckan att 93% av sådden är klar i Argentina. Det väntas vara fortsatt torrt i landet. De flesta lokala estimat på skörden ligger väsentligt under jordbruksdepartementets och USDA:s estimat på 28 – 30 mt. De lokala estimaten ligger ca 5 mt lägre kring 24 – 25 mt. Argentinas export väntas vara tidig. Dels för att terminskurvan är i backwardation. Att vänta ger förmodligen lägre pris. Man vill säkert också komma före Brasiliens bönder, som skördar lite efter Argentinas – vilket återspeglar sig i terminskurvan.
Tisdagens Department of Energy (DOE) rapport var en besvikelse vad gäller etanolefterfrågan. Sammanfattnignsvis: Ihållande torka i USA, som enligt NOAA väntas hålla i sig till sommaren, gör att många lär hålla i sin gamla skörd av majs. Argentinas skörd tycks av dem närmast marken (lokala estimat) ligga väsentligt lägre än vad USDA förutspådde för en vecka sedan. Nästan allt – utom etanolefterfrågan och foderefterfrågan i USA – pekar på att priset borde kunna fortsätta att stiga. Mot detta talar den tekniska analysen. Så där är vi. Till nästa vecka behåller vi vår positiva vy, men tycker att man ska ta hem vinster på långa positioner om priset närmar sig 600 cent – i väntan på mer information
Sojabönor
Sojabönorna hängde med majs och vete uppåt, också med stöd av en något svagare dollar i veckan. Trenden är alltjämt nedåtriktad. Brottet av stödlinjen visade sig falskt, än så länge. 55-dagars glidande medelvärde, som många tittar på, ligger strax över dagens kursnivå och kan ge anledning till säljordrar kring den. Tekniskt är bilden ännu i vänteläge. Stiger kursen från de här nivåerna, bryts den nedåtgående trenden.
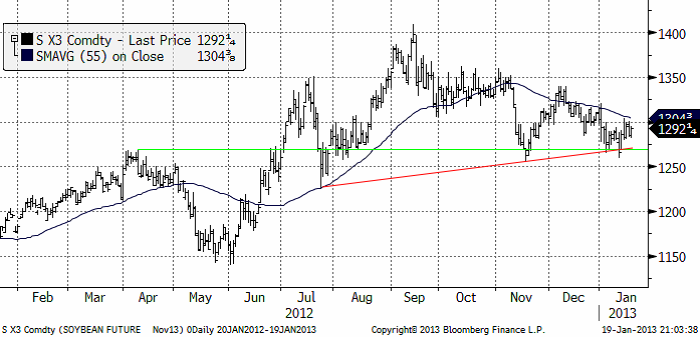
Just nu finns inga signaler om styrka eller svaghet, så bäst är att vara neutral. Vi byter alltså rekommendation från sälj till neutral.
Raps
Rapspriset (november 2013) fann stöd vid 415 euro. Det senaste prisfallet nådde faktiskt inte ända ner till 415 euro. Det fanns alltså ivriga fyndköpare som väntade.
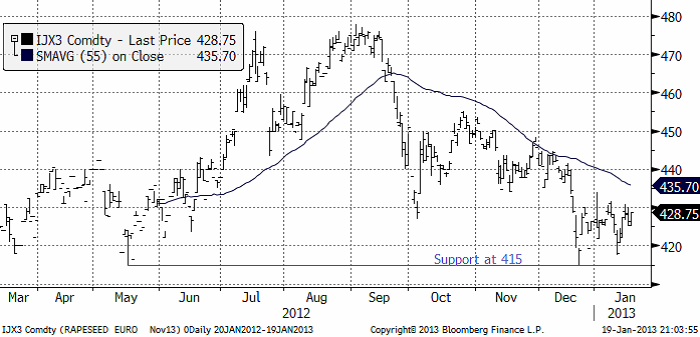
Trenden har varit nedåtriktad sedan i september / oktober. Frågan är om det håller på att vända nu. Det är lite för tidigt att ändra rekommendation och med tanke på att det finns motstånd på ovansidan redan på 430 euro-nivån, går det inte att ändra rekommendation från sälj till köp. Vi ligger alltså kvar med säljrekommendation i väntan på ny information.
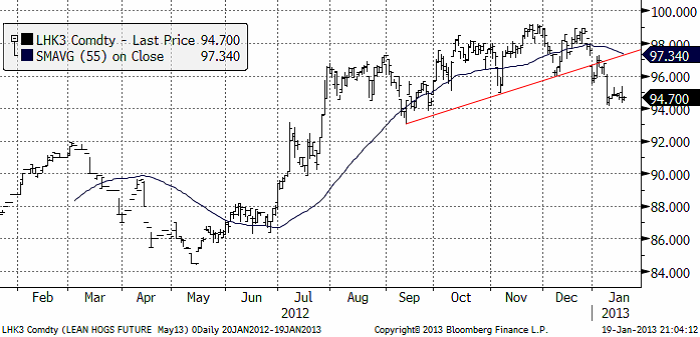
Gris
Grispriset (Maj 13), amerikansk Lean Hogs, har brutit en teknisk stödnivå (röd linje i diagrammet nedan). 94 cent per pund var första stödnivån, men antagligen fortsätter priset ner mot 92 cent i första hand.
Omfattningen av grisbranschen i USA visade en liten uppgång det sista kvartalet förra året. Det var en ökning med 29,000 djur. Antalet djur har sedan 90-talet minskat från 7.5 miljoner djur till 5.8 miljoner, som vi ser i diagrammet nedan.
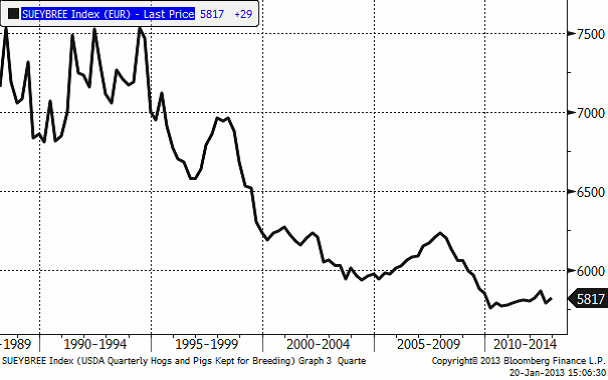
Antal djur
På samma sätt har hjorden av nötkreatur i USA fortsatt att minska, men där såg vi en ny bottennotering i den senaste statistiken.
Mjölk
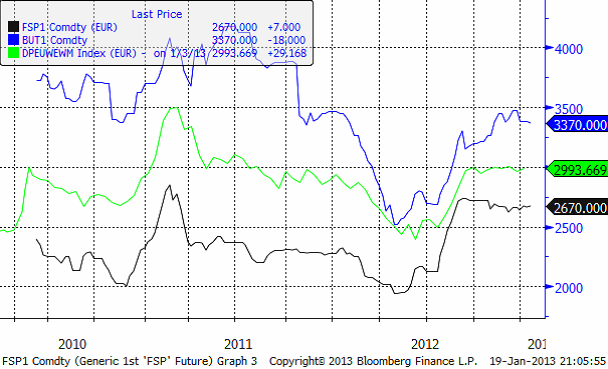
I diagrammet nedan ser vi tre kurvor.Den gröna linjen är priset på skummjölkspulver i euro per ton på Eurex-börsen. Den blå är priset på smör på Eurex börsen. Priserna på Eurex anges i euro per ton.
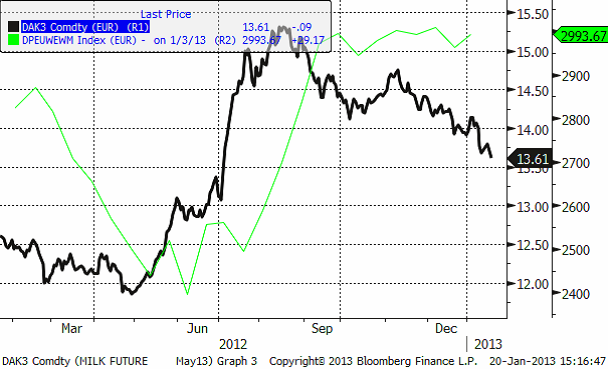
Slutligen så den gröna linjen. Den visar priset på helmjölkspulver (WMP) FOB Västeuropa. Källan är USDA och priserna uppdateras varannan vecka. Vi ser att WMP-priset legat stabilt det fjärde kvartalet förra året, med en liten nedgång mot slutet av året. 2013 har dock börjat med en liten prisuppgång.
Det börsbaserade priset i svenska kronor beräknas med formeln:
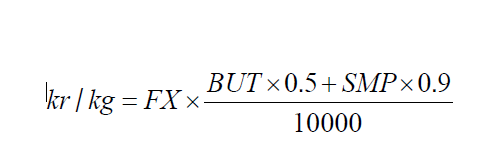
där
BUT = priset på smör i euro per ton
SMP = priset på skummjölkspulver i euro per ton
FX = växelkursen för EURSEK.
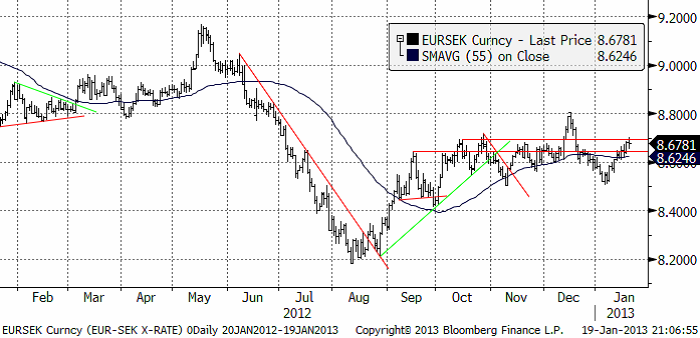
EURSEK
EURSEK stärktes successivt under veckan som gick och nådde upp till de gamla motståndsnivåerna. Det finns inte mycket ny information som ger anledning till att anta annat än att den ”sidledes” rörelse vi sett de senaste månaderna ska fortsätta.
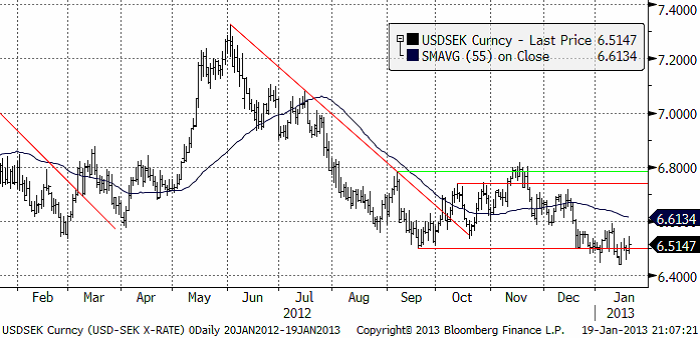
USDSEK
Dollarn föll mot kronan i veckan som gick. Det är fortsatt instabilt finansiellt och politiskt i USA. Stödnivån från botten i september är bruten, men det blev inte något förnyat kursfall i veckan. Trenden är dock nedåt och även om det blir lite ”sidledes” rörelse i veckan, tycks trenden vara nedåt.
[box]SEB Veckobrev Jordbruksprodukter är producerat av SEB Merchant Banking och publiceras i samarbete och med tillstånd på Råvarumarknaden.se[/box]
Disclaimer
The information in this document has been compiled by SEB Merchant Banking, a division within Skandinaviska Enskilda Banken AB (publ) (“SEB”).
Opinions contained in this report represent the bank’s present opinion only and are subject to change without notice. All information contained in this report has been compiled in good faith from sources believed to be reliable. However, no representation or warranty, expressed or implied, is made with respect to the completeness or accuracy of its contents and the information is not to be relied upon as authoritative. Anyone considering taking actions based upon the content of this document is urged to base his or her investment decisions upon such investigations as he or she deems necessary. This document is being provided as information only, and no specific actions are being solicited as a result of it; to the extent permitted by law, no liability whatsoever is accepted for any direct or consequential loss arising from use of this document or its contents.
About SEB
SEB is a public company incorporated in Stockholm, Sweden, with limited liability. It is a participant at major Nordic and other European Regulated Markets and Multilateral Trading Facilities (as well as some non-European equivalent markets) for trading in financial instruments, such as markets operated by NASDAQ OMX, NYSE Euronext, London Stock Exchange, Deutsche Börse, Swiss Exchanges, Turquoise and Chi-X. SEB is authorized and regulated by Finansinspektionen in Sweden; it is authorized and subject to limited regulation by the Financial Services Authority for the conduct of designated investment business in the UK, and is subject to the provisions of relevant regulators in all other jurisdictions where SEB conducts operations. SEB Merchant Banking. All rights reserved.


The latest weekly report from the US DOE showed a substantial drawdown across key petroleum categories, adding more upside potential to the fundamental picture.

Commercial crude inventories (excl. SPR) fell by 5.8 million barrels, bringing total inventories down to 415.1 million barrels. Now sitting 11% below the five-year seasonal norm and placed in the lowest 2015-2022 range (see picture below).
Product inventories also tightened further last week. Gasoline inventories declined by 2.1 million barrels, with reductions seen in both finished gasoline and blending components. Current gasoline levels are about 3% below the five-year average for this time of year.
Among products, the most notable move came in diesel, where inventories dropped by almost 4.1 million barrels, deepening the deficit to around 20% below seasonal norms – continuing to underscore the persistent supply tightness in diesel markets.
The only area of inventory growth was in propane/propylene, which posted a significant 5.1-million-barrel build and now stands 9% above the five-year average.
Total commercial petroleum inventories (crude plus refined products) declined by 4.2 million barrels on the week, reinforcing the overall tightening of US crude and products.


A classic case of “buy the rumor, sell the news” played out in oil markets, as Brent crude has dropped sharply – down nearly USD 10 per barrel since yesterday evening – following Iran’s retaliatory strike on a U.S. air base in Qatar. The immediate reaction was: “That was it?” The strike followed a carefully calibrated, non-escalatory playbook, avoiding direct threats to energy infrastructure or disruption of shipping through the Strait of Hormuz – thus calming worst-case fears.
After Monday morning’s sharp spike to USD 81.4 per barrel, triggered by the U.S. bombing of Iranian nuclear facilities, oil prices drifted sideways in anticipation of a potential Iranian response. That response came with advance warning and caused limited physical damage. Early this morning, both the U.S. President and Iranian state media announced a ceasefire, effectively placing a lid on the immediate conflict risk – at least for now.
As a result, Brent crude has now fallen by a total of USD 12 from Monday’s peak, currently trading around USD 69 per barrel.
Looking beyond geopolitics, the market will now shift its focus to the upcoming OPEC+ meeting in early July. Saudi Arabia’s decision to increase output earlier this year – despite falling prices – has drawn renewed attention considering recent developments. Some suggest this was a response to U.S. pressure to offset potential Iranian supply losses.
However, consensus is that the move was driven more by internal OPEC+ dynamics. After years of curbing production to support prices, Riyadh had grown frustrated with quota-busting by several members (notably Kazakhstan). With Saudi Arabia cutting up to 2 million barrels per day – roughly 2% of global supply – returns were diminishing, and the risk of losing market share was rising. The production increase is widely seen as an effort to reassert leadership and restore discipline within the group.
That said, the FT recently stated that, the Saudis remain wary of past missteps. In 2018, Riyadh ramped up output at Trump’s request ahead of Iran sanctions, only to see prices collapse when the U.S. granted broad waivers – triggering oversupply. Officials have reportedly made it clear they don’t intend to repeat that mistake.
The recent visit by President Trump to Saudi Arabia, which included agreements on AI, defense, and nuclear cooperation, suggests a broader strategic alignment. This has fueled speculation about a quiet “pump-for-politics” deal behind recent production moves.
Looking ahead, oil prices have now retraced the entire rally sparked by the June 13 Israel–Iran escalation. This retreat provides more political and policy space for both the U.S. and Saudi Arabia. Specifically, it makes it easier for Riyadh to scale back its three recent production hikes of 411,000 barrels each, potentially returning to more moderate increases of 137,000 barrels for August and September.
In short: with no major loss of Iranian supply to the market, OPEC+ – led by Saudi Arabia – no longer needs to compensate for a disruption that hasn’t materialized, especially not to please the U.S. at the cost of its own market strategy. As the Saudis themselves have signaled, they are unlikely to repeat previous mistakes.
Conclusion: With Brent now in the high USD 60s, buying oil looks fundamentally justified. The geopolitical premium has deflated, but tensions between Israel and Iran remain unresolved – and the risk of missteps and renewed escalation still lingers. In fact, even this morning, reports have emerged of renewed missile fire despite the declared “truce.” The path forward may be calmer – but it is far from stable.
Analys
A muted price reaction. Market looks relaxed, but it is still on edge waiting for what Iran will do
Brent crossed the 80-line this morning but quickly fell back assigning limited probability for Iran choosing to close the Strait of Hormuz. Brent traded in a range of USD 70.56 – 79.04/b last week as the market fluctuated between ”Iran wants a deal” and ”US is about to attack Iran”. At the end of the week though, Donald Trump managed to convince markets (and probably also Iran) that he would make a decision within two weeks. I.e. no imminent attack. Previously when when he has talked about ”making a decision within two weeks” he has often ended up doing nothing in the end. The oil market relaxed as a result and the week ended at USD 77.01/b which is just USD 6/b above the year to date average of USD 71/b.

Brent jumped to USD 81.4/b this morning, the highest since mid-January, but then quickly fell back to a current price of USD 78.2/b which is only up 1.5% versus the close on Friday. As such the market is pricing a fairly low probability that Iran will actually close the Strait of Hormuz. Probably because it will hurt Iranian oil exports as well as the global oil market.
It was however all smoke and mirrors. Deception. The US attacked Iran on Saturday. The attack involved 125 warplanes, submarines and surface warships and 14 bunker buster bombs were dropped on Iranian nuclear sites including Fordow, Natanz and Isfahan. In response the Iranian Parliament voted in support of closing the Strait of Hormuz where some 17 mb of crude and products is transported to the global market every day plus significant volumes of LNG. This is however merely an advise to the Supreme leader Ayatollah Ali Khamenei and the Supreme National Security Council which sits with the final and actual decision.
No supply of oil is lost yet. It is about the risk of Iran closing the Strait of Hormuz or not. So far not a single drop of oil supply has been lost to the global market. The price at the moment is all about the assessed risk of loss of supply. Will Iran choose to choke of the Strait of Hormuz or not? That is the big question. It would be painful for US consumers, for Donald Trump’s voter base, for the global economy but also for Iran and its population which relies on oil exports and income from selling oil out of that Strait as well. As such it is not a no-brainer choice for Iran to close the Strait for oil exports. And looking at the il price this morning it is clear that the oil market doesn’t assign a very high probability of it happening. It is however probably well within the capability of Iran to close the Strait off with rockets, mines, air-drones and possibly sea-drones. Just look at how Ukraine has been able to control and damage the Russian Black Sea fleet.
What to do about the highly enriched uranium which has gone missing? While the US and Israel can celebrate their destruction of Iranian nuclear facilities they are also scratching their heads over what to do with the lost Iranian nuclear material. Iran had 408 kg of highly enriched uranium (IAEA). Almost weapons grade. Enough for some 10 nuclear warheads. It seems to have been transported out of Fordow before the attack this weekend.
The market is still on edge. USD 80-something/b seems sensible while we wait. The oil market reaction to this weekend’s events is very muted so far. The market is still on edge awaiting what Iran will do. Because Iran will do something. But what and when? An oil price of 80-something seems like a sensible level until something do happen.


Sommarvädret styr elpriset i Sverige

Samtal om flera delar av råvarumarknaden
Tightening fundamentals – bullish inventories from DOE

Jonas Lindvall är tillbaka med ett nytt oljebolag, Perthro, som ska börsnoteras

Oljan, guldet och marknadens oroande tystnad

Stor uppsida i Lappland Guldprospekterings aktie enligt analys

Brookfield ska bygga ett AI-datacenter på hela 750 MW i Strängnäs
Silverpriset släpar efter guldets utveckling, har mer uppsida

Tradingfirman XTX Markets bygger datacenter i finska Kajana för 1 miljard euro

Uppgången i oljepriset planade ut under helgen
-
 Nyheter3 veckor sedan
Stor uppsida i Lappland Guldprospekterings aktie enligt analys
-
 Nyheter4 veckor sedan
Brookfield ska bygga ett AI-datacenter på hela 750 MW i Strängnäs
-
 Nyheter3 veckor sedan
Silverpriset släpar efter guldets utveckling, har mer uppsida
-
 Nyheter4 veckor sedan
Tradingfirman XTX Markets bygger datacenter i finska Kajana för 1 miljard euro
-
 Nyheter2 veckor sedan
Uppgången i oljepriset planade ut under helgen
-

 Nyheter2 veckor sedan
Låga elpriser i sommar – men mellersta Sverige får en ökning
-
Analys2 veckor sedan
Very relaxed at USD 75/b. Risk barometer will likely fluctuate to higher levels with Brent into the 80ies or higher coming 2-3 weeks
-

 Nyheter1 vecka sedan
Mahvie Minerals växlar spår – satsar fullt ut på guld