

Analys
SEB – Råvarukommentarer, 21 januari 2013
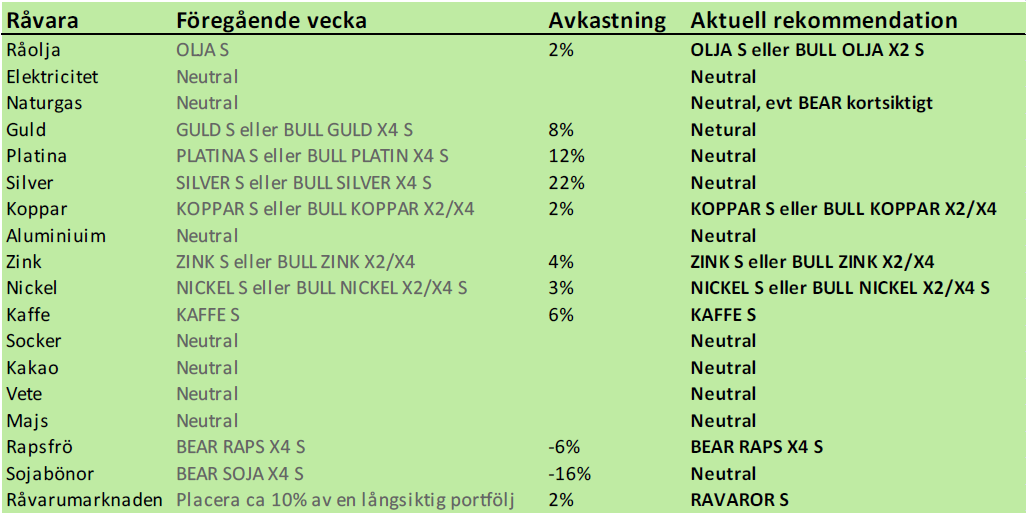
Rekommendationer
Inledning
SEB:s råvaruindex var oförändrat i veckan som gick. Däremot steg dollarn, vilket medförde att certifikatet RAVAROR S, som följer indexet, steg med 2%.
Till vinnarna i veckan hörde platina (igen), silver och guld, även kaffe utvecklades väl: alla dessa helt i linje med våra rekommendationer. Elpriset steg i början på veckan, men föll sedan ganska kraftigt i pris. Vi tycker att man ska avvakta med köp av EL S eller BULL EL X2/X4 S, då priset kanske kommer ner ytterligare lite grand innan marknaden vänder. Nästa vecka kanske tiden är mogen för gå in på långa sidan igen.
Ädelmetallerna har alla nått upp till kritiska nivåer och tekniskt är risken överhängande att rekylen uppåt den senaste tiden, övergår i fallande pris igen. Vi tar därför hem vinsterna på långa positioner i ädelmetaller och gör i första hand över till neutral rekommendation.
Vi ändrar rekommendationen att ligga kort sojabönor. Tekniskt är läget svårtolkat och vi måste gå över till neutralt läge.
Kanske kommer det ny information i veckan som ger vägledning om trenden framöver. Raps är relaterat till sojabönorna. Där är det också sidledes rörelse, men man kan fortfarande betrakta trenden nedåt som obruten.
På oljemarknaden börjar det hända saker, efter att Saudiarabien minskat produktionen och den globala konjunkturen följer en dynamik som stämmer överens med “sen recession”. Detta gör också basmetallerna intressanta på uppsidan.
Råolja – Brent
International Energy Agency, köparländernas motpol till OPEC publicerade sin månadsrapport i fredags. IEA förutspår mindre utbud i förhållande till efterfrågan under året. Global oljefterfrågan väntas stiga med 1% till 90.8 miljoner fat om dagen. Utbudet växer snabbare från länder utanför OPEC och den tillväxten väntas öka till den högsta takten sedan 2012, men amerikanska exportbegränsningar kan begränsa tillväxten i amerikansk produktion. OPEC:s decemberproduktion föll till lägsta nivån under 2012, efter att Saudiarabien dragit ner produktionen. OPEC:s decemberproduktion föll till 30.65 mb/d.
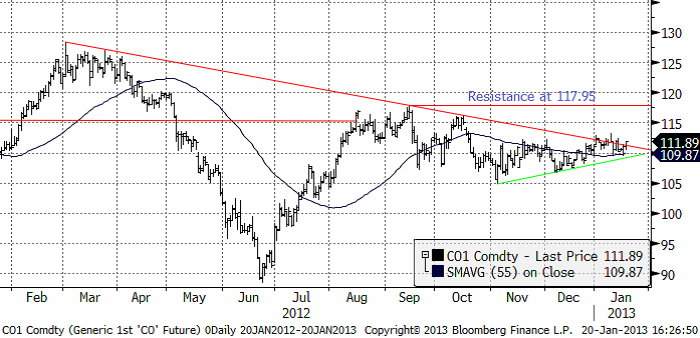
Priset på råolja fortsätter att röra sig inom ett snävt prisintervall. Hittills i år har 110 dollar utgjort ett golv. På den övre sidan av intervallet har 113 dollar varit ett motstånd. Goldman Sachs förvånade alla i veckan som gick genom att förutspå 150 dollar / fat. Motivet var Iran och spridningen av den arabiska våren.
Tekniskt ser vi att en triangelformation bildats och den tycks brytas på uppsidan. På kort sikt finns det då potential upp mot motståndet på 117.95.
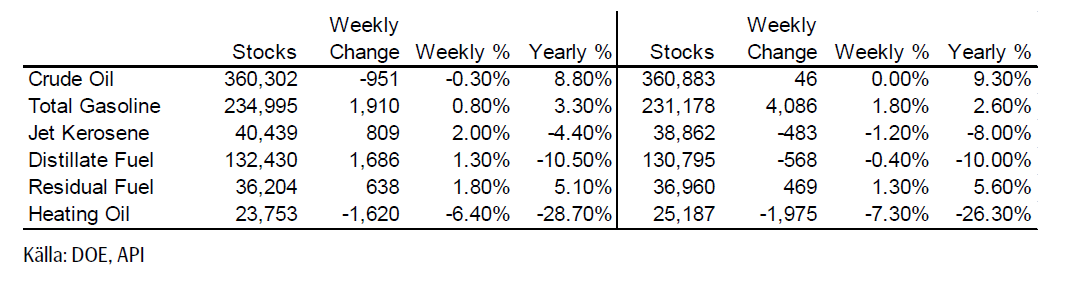
Nedan ser vi den veckovisa lagerstatistiken från USA. Lagren av heating oil minskade rätt så mycket och ligger också långt under förra årets nivå. Råoljelagren minskade också enligt DOE, men ligger nästan 10% över förra årets nivå.
Det ser alltså ut att hända saker på oljemarknaden. Månader av sidledes rörelse kan vara över. Utöver att bara vara köpt OLJA S och tjäna in rabatten på oljan i terminsmarknaden på +6% per år, tror vi att det kan komma en uppgång som motiverar ett köp av t ex BULL OLJA X2 S.
Elektricitet
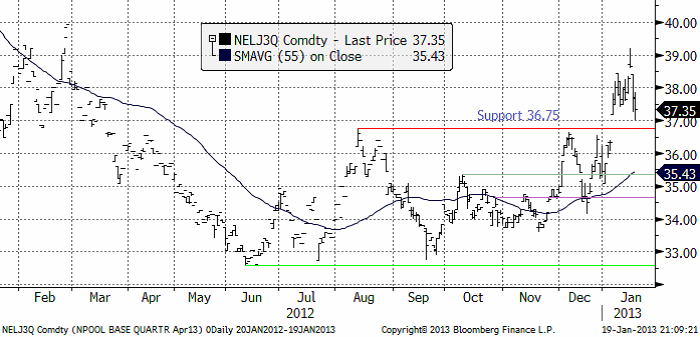
Elpriset, för det andra kvartalet, reagerade något ologiskt på kyla just nu i Norden och gick upp och noterade det högsta priset på ett år. Det är påverkan på den hydrologiska balansen som dragit upp priset. Euforin blev dock kortvarig och rörelsen på dagen liknar en ”key reversal day”. En sådan signalerar trendvändning. Nedåt i det här fallet. Stöd finns nu på 36.75 och så som priset faller nu kan den stödnivån mycket väl komma att brytas.
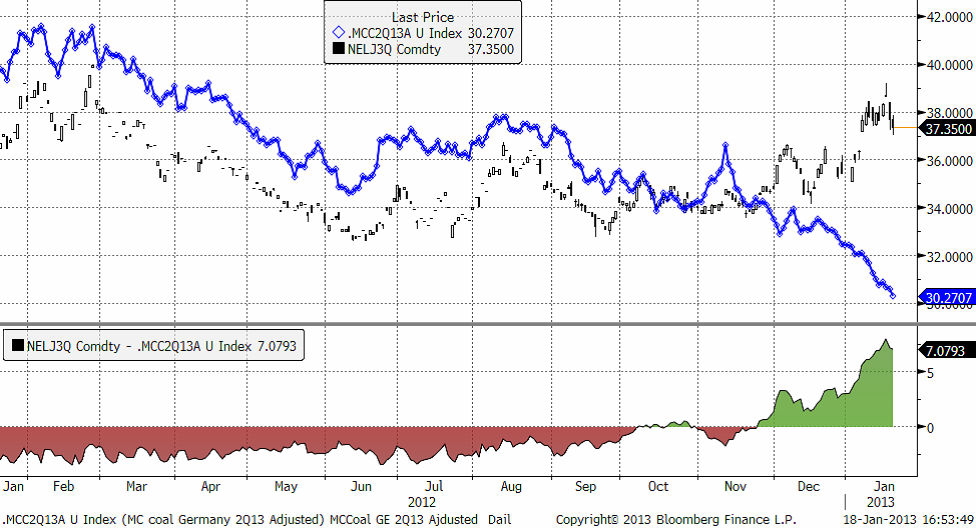
Nedan ser vi terminspriset för andra kvartalet och marginalkostnaden för att producera elektricitet med kol, i euro per MWh. På lång sikt är det marginalkostnaden för kolkraft som styr elpriset i Sverige. Vatten- och kärnkraft räcker inte till och då är det kol som styr vid den konsumtion vi ligger på idag (och konsumtionen har varit ungefär på konstant nivå de senaste åren). Vi ser att kolkraften fortsatt att falla i kostnad och gapet är förvånande stort.
Vad gäller vädret så ser det idag ut som högryckscenariet kommer fortsätta dominera. De första 5 dygnen är säkra medan dygn 6-10 indikerar samma vädertyp.
Vad gäller spotpriset är det ca 41 för måndag, ca 5 eur lägre än förra måndagen och väsentligt under förra veckans högsta på 53.5. Orsaken är att det är lite mindre kallt och verkar bli rejält blåsigt i Danmark.
Den hydrogiska balansen har dock fortsatt att falla. Markedskraft publicerar statistik på den hydrologiska balansen för Norge och Sverige. Den anges i TWh kraft som finns lagrat i vatten som kan passera ett vattenkraftverk. I diagrammet nedan visas hur mycket mer / mindre som finns i förhållande till vad som är normalt. Och med normalt avses genomsnittet för respektive dag på året mellan 1962 och 2006. Sedan förra veckan har underskottet ökat med 4 TWh till -5TWh.
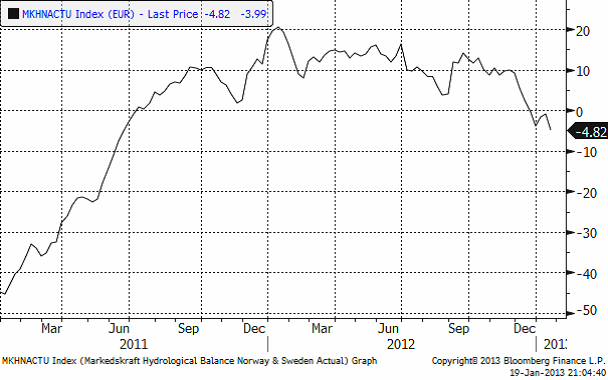
Med nuvarande väderleksprognoser är visar den hydrologiska balansen ett underskott på hela -11 TWh om en dryg månad!
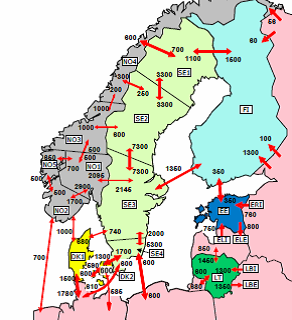
Överföringskapacitet till utanför elbörsområdet ser vi i kartan nedan. Siffrorna anger överföringskapaciteten i MW.
Vi rekommenderar att man håller sig borta från BULL EL – varianter och inväntar bättre priser att senare komma in på den långa sidan.
Naturgas
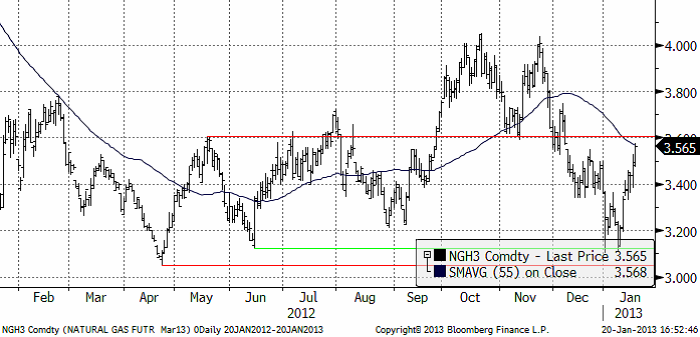
Naturgasterminen på NYMEX (mars 2013) har stigit mycket kraftigt och är uppe vid motståndet på 3.60 dollar per MMBtu. NOAA har släppt en långtidsprognos som visar att varmare väder än normalt i USA kommer att dröja sig kvar ända till sommaren. Det finns nu alltså både tekniska och fundamentala anledningar att tro att prisuppgången kan brytas vid den här nivån.
Den som kortsiktigt vill prova på att handla naturgas, kan kanske försöka sig på ett mycket kortsiktigt inhopp i BEAR NATGAS X4 S. På längre sikt tror vi att man bör vara neutral.
Guld och Silver
Tekniskt är priset på guld i dollar uppe vid utbrottsnivån från triangelformationen vi skrivit om tidigare. Det är vanligt att rekyler, som jag tror det här handlar om, når upp till utbrottsnivån för att sedan vända nedåt igen.
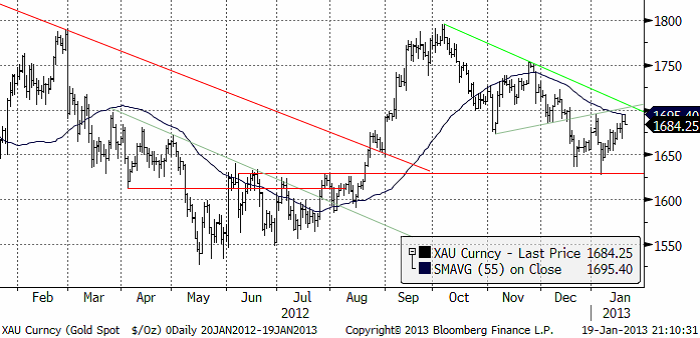
Det finns mycket fundamentalt i ekonomin som talar för guld. En fortsättning på det amerikanska QE3 ligger inte långt borta.
Japan har lämnat sitt velande och slagit in på en politik att försöka devalvera sin valuta genom att trycka ännu mer yen. Detta lär sprida sig till andra länder, som kan komma att tävla om att devalvera sina valutor för att hjälpa sin egen inhemska ekonomi. De enda som står fast då bland ”valutorna” är ädelmetallerna. Men just nu, ser den tekniska bilden alltså inte särskilt positiv ut.
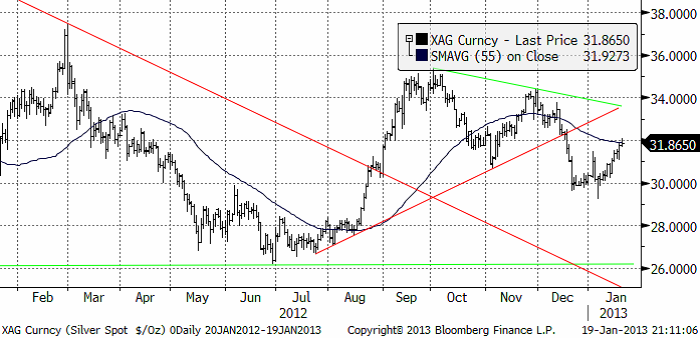
Nedan ser vi kursdiagrammet för silver i dollar per troy ounce. Situationen är snarlik den för guld. Priset är uppe vid motståndsnivån 32 dollar. En rekyl nedåt i veckan tror vi har hög sannolikhet att inträffa.
Platina
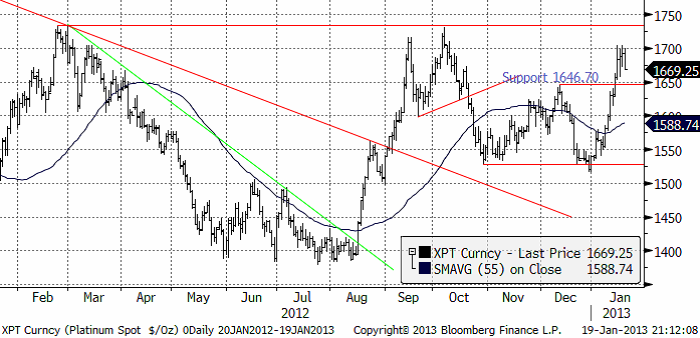
Platina, vår favorit bland de tre ädelmetallerna, har gått upp rejält i veckan som gick, men priset föll oroväckande i fredags. Priset lyckades inte nå över 1700 dollar och inte heller nå toppnoteringarna från februari och oktober förra året. En rekyl nedåt förefaller trolig.
Nedan ser vi priset på platina i termer av guld, eller ”växelkursen” mellan XPT och XAU, valutakoderna för de två ädelmetallerna. Den här kvoten nådde förra årets toppnivåer i veckan som gick. Efter en god resa uppåt hittills i år, kan det kanske vara dags för vinsthemtagningar, tänker vi.
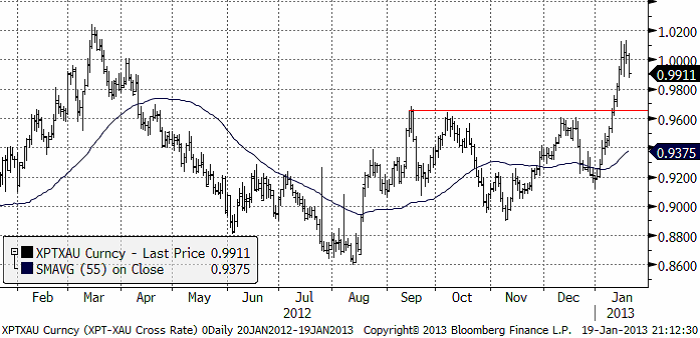
Vi rekommenderar alltså att man kortsiktigt kliver ur långa positioner i ädelmetaller. Kortsiktigt kan man eventuellt ta position i BEAR-varianter på guld, silver eller platina.
Basmetaller
Veckan inleddes med få prispåverkande nyheter med allmänt avvaktande aktörer, vilket ledde till svagt sjunkande priser. Fokus låg på torsdagens amerikanska makrodata och senare nattens BNP och övrig industridata från Kina. Amerikansk byggstartsdata överraskade (+12.1 % i december) och startade ett rally på de finansiella marknaderna vilket drog med sig metallerna uppåt. Kinasiffrorna kom in något bättre än väntat. BNP-tillväxten under Q4 kom in på 7,9 %, den första accelerationen på åtta månader. Industriproduktionen i december steg 10,3 %, någon tiondel bättre än väntat.
Basmetallerna återhämtade fallet tidigare i veckan och stänger kring nollstrecket. Risken är att marknaden på kort sikt förblir något avvaktande, nu med sikte på mer vägledning kring aktiviteten i den kinesiska ekonomin, inför det kinesiska nyårsfirandet mellan 9-15:e februari. Förhandlingarna kring det amerikanska skuldtaket kommer också skapa osäkerhet. Utveckling så här långt i år är i stort sett plus minus noll för basmetallerna. Vi kvarstår med bedömningen att nedsidorna är begränsade och med hjälp av det säsongsmässigt starka Q1 finns goda förutsättningar för prisuppgångar på 3-4 månaders sikt. Som tidigare skrivits, föredrar vi i detta sammanhang, nickel och zink.
Koppar
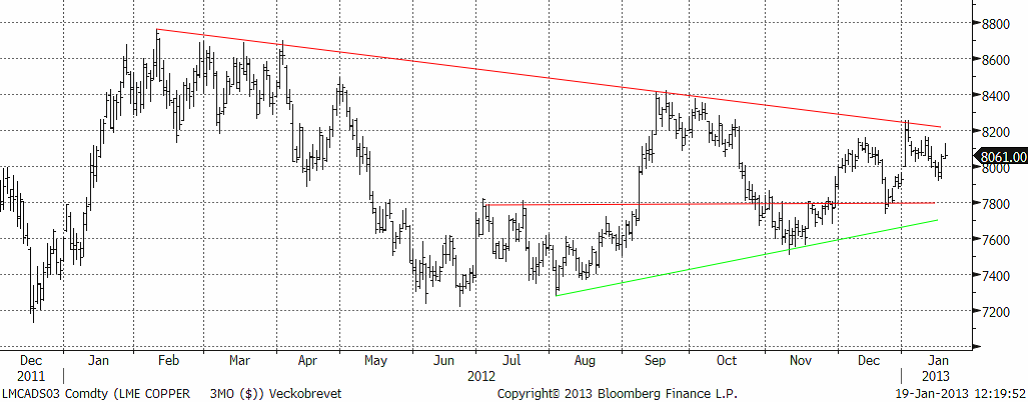
Koppar ledde prisuppgången under veckans avslutning. Den amerikanska byggstartsstatistiken (Housing Starts) är en traditionell ”kopparsiffra”, vilket gav en extra stimulans. Marknaden dämpas av känslan att tillväxten av Kinas kopparimport är avtagande, vilket i sig inte behöver betyda minskad efterfrågan i Kina. Flera bedömare tror nu att de kommer fortsätta beta av inhemska lager och importökning först kommer lite senare under året, såvida inte LME-priset faller kraftigt, då kineserna ofta agerar utifrån prisnivån Den tekniska bilden är relativt neutral för tillfället. Om LME-noteringen (3 månaders) kommer ned mot $7800 är det ett köp.
Alternativet är att avvakta ett brott på uppsidan kring $8200 (över trendlinjen), alternativt $8400 (toppen från september).
Aluminium
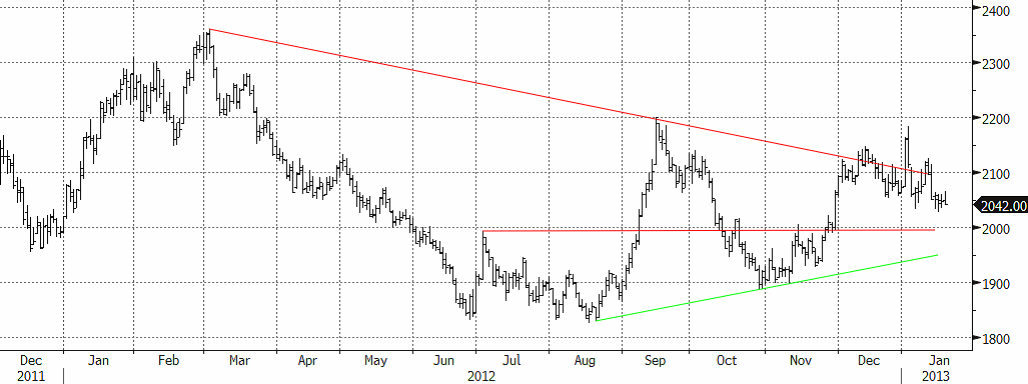
Aluminium följde inte riktigt med den allmända trenden och lyckades inte under veckans avslutning återhämta förlorad mark i samma utsträckning som övriga basmetaller. Aktörerna fokuserar på terminskurvan och den LME-relaterade kortheten från december förra året, som nu flyttats ”längre ut på kurvan”. Normalt rullas positioner 3 månader framåt vilket skulle innebära en stram marknad i mars. Nu är det istället juni som börjar bli tight. Någon eller några stora aktörer sitter på korta positioner som rullas framåt. Marknadskällor gör gällande att positioner flyttas ända ut till 2014 vilket återspeglas i en lägre contango (terminspremie) t.ex. perioden dec13-dec14. Ur ett investeringsperspektiv gör det marknaden ovanligt svåranalyserad. Rent fundamentalt är efterfrågeutsikterna väldigt goda med positiva rapporter vad gäller efterfrågan från framför allt bil- och flygindustrin. Det som gör oss tveksamma för uppsidan är en fortsatt ökande produktion, och det kan dröja 1-2 år innan marknaden är i balans.
Veckans utveckling plockar ned priset tillbaka i den sidledes trenden. Stöd kommer att infinna sig kring $2000 i första läget.
Zink
Som vi nämnt tidigare har zinken fått lida av omviktning av råvaruindex. Stora volymer skulle säljas (enligt rykten ca 13 000 LME-kontrakt, vilket är ganska mycket för zink). Effekten borde nu ha avtagit. Som vi skrivit tidigare är de största användningsområdena för zink bygg- och transportindustrin. Två områden som nu gynnas av en mer positivt syn på tillväxten i Kina och USA. Zink ligger väl placerad i det scenariot.
Den mer positiva utvecklingen under veckans avslutning fick zinken att sluta veckan på plus med ca 1 %. Tekniskt sett nivån $2050 viktig. På vägen ned fungerade det som stöd, nu får motsatt effekt när priset börjat klättra igen. Ett genombrott öppnar för en kortsiktig uppgång till nivåer strax över $2100. I perspektivet 3-4 månader är vi fortsatt positiva.
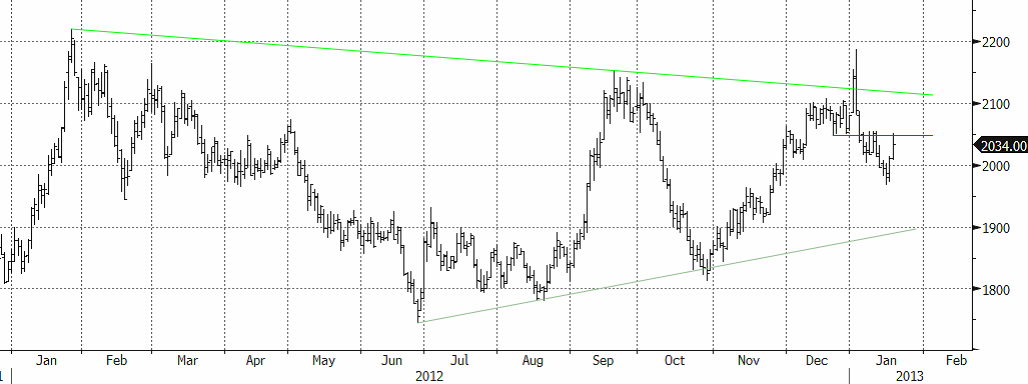
Vi rekommenderar köp av ZINK S eller BULL ZINK X2 / X4 S för den som vill ta mer risk. Man bör gå ur positionen om priset faller genom 1930 dollar per ton, som är stödet i den konsolideringsfas som varit rådande sedan prisfallet slutade i slutet av maj. Kortsiktigt bör man ta hem vinst vid motståndsnivån $2150. På lite längre sikt är potentialen större. Nästa motståndsnivå kommer in vid $2200, men målet är $2400 på 2- 3 månaders sikt.
Nickel
De senaste fundamentala rapporter vi tagit del av tyder på en marknad i balans under Q1 2013, detta tack vare att vi är inne i den säsongsmässigt starka perioden. Studier som genomförts styrker vår anekdotiska erfarenhet att perioden nov-april brukar innebära ökad efterfrågan (och stigande nickelpris). Problemet just nu är att utbudet är lite för överhängande för att ge tillräcklig hävstång på priset. Nickel kan dock erfarenhetsmässigt ofta överraska med sin prisrörlighet. Den tekniska bilden ser generellt positiv ut med en tendens till ”högre bottnar”. Det blir viktigt hur marknaden beter sig i intervallet $17000 och $18000 ($17550 i skrivandes stund). Det viktigt att den nedre nivån håller för att hålla uppe tempot. Bryter det på uppsidan kan det ta fart ordentligt på uppsidan.
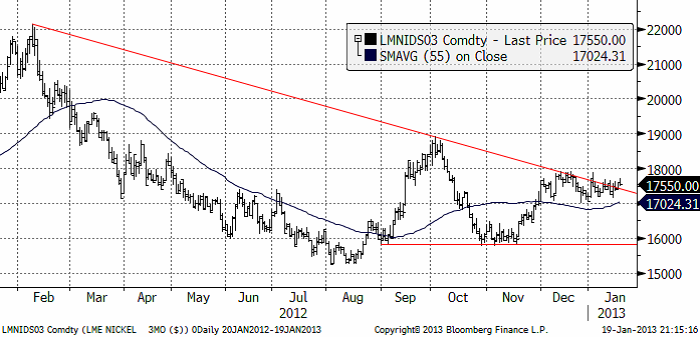
Vi rekommenderar köp av NICKEL S eller BULL NICKEL X2 / X4 S för den som vill ta mer risk. Man bör gå ur positionen om priset faller genom 15,800 dollar per ton, som är stödet i den konsolideringsfas som varit rådande sedan prisfallet slutade i slutet av oktober. Kortsiktigt bör man ta hem vinst vid moståndsnivån $18000. På lite längre sikt är potentialen större. Nästa motståndsnivå kommer in strax under $19000.
Kaffe
De som köpte KAFFE S förra veckan har gjort en bra affär. I fredags stängde priset precis under det viktiga motståndet 157.35 cent per pund. Den observante konsumenten har noterat att kaffe reas ut i dagligvaruhandeln (”3 för 50 kr”). Antagligen säljer de stora mängder. Eventuellt kan man ta hem vinster kortsiktigt på den här nivån och försöka komma in igen på en lite lägre nivå efter en eventuell rekyl. Men motståndet kan också brytas och i så fall bör man köpa ännu mer KAFFE S.
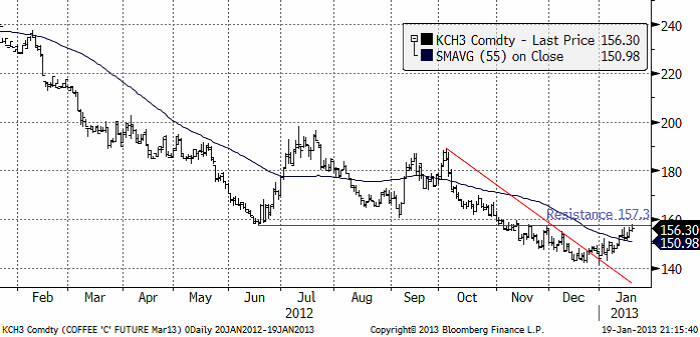
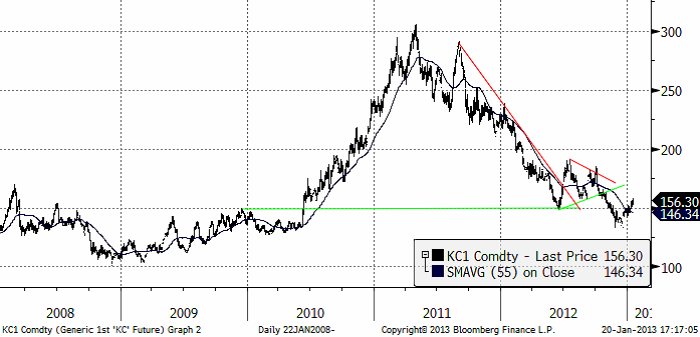
Om vi sätter dagens kurs i perspektiv av de senaste fem årens prisutveckling, ser vi att priser nu är nere på riktiga bottennivåer. Prisfallet från toppen är riktigt stort. Det finns stor potential på uppsidan. Vi tror att tiden är mogen för att placera i kaffe från den långa sidan och då inte bara på kort sikt. Den som har köpt sina tre paket för 50 kr, kan utöka sin position med KAFFE S.
Socker
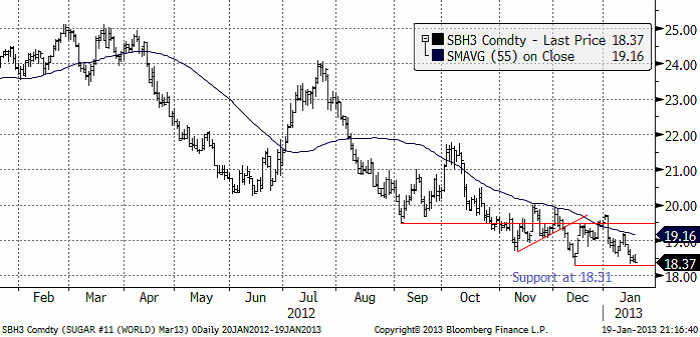
Sockerpriset (mars 2013) är nu nere och testar botten / stödet på 18.31. I fredags stängde handeln i mars-kontraktet på 18.37 cent per pund. Trenden är alltjämt nedåtriktad. Det spännande i veckan att se, är om stödet bryts eller om priset rör sig ”sidledes” strax ovanför.
För övriga jordbruksråvaror se analysbrevet från SEB från tidigare idag.
[box]SEB Veckobrev Veckans råvarukommentar är producerat av SEB Merchant Banking och publiceras i samarbete och med tillstånd på Råvarumarknaden.se[/box]
Disclaimer
The information in this document has been compiled by SEB Merchant Banking, a division within Skandinaviska Enskilda Banken AB (publ) (“SEB”).
Opinions contained in this report represent the bank’s present opinion only and are subject to change without notice. All information contained in this report has been compiled in good faith from sources believed to be reliable. However, no representation or warranty, expressed or implied, is made with respect to the completeness or accuracy of its contents and the information is not to be relied upon as authoritative. Anyone considering taking actions based upon the content of this document is urged to base his or her investment decisions upon such investigations as he or she deems necessary. This document is being provided as information only, and no specific actions are being solicited as a result of it; to the extent permitted by law, no liability whatsoever is accepted for any direct or consequential loss arising from use of this document or its contents.
About SEB
SEB is a public company incorporated in Stockholm, Sweden, with limited liability. It is a participant at major Nordic and other European Regulated Markets and Multilateral Trading Facilities (as well as some non-European equivalent markets) for trading in financial instruments, such as markets operated by NASDAQ OMX, NYSE Euronext, London Stock Exchange, Deutsche Börse, Swiss Exchanges, Turquoise and Chi-X. SEB is authorized and regulated by Finansinspektionen in Sweden; it is authorized and subject to limited regulation by the Financial Services Authority for the conduct of designated investment business in the UK, and is subject to the provisions of relevant regulators in all other jurisdictions where SEB conducts operations. SEB Merchant Banking. All rights reserved.

Market is starting to take US/Iran headlines with a pinch of salt. Brent crude rose $2.8/b yesterday to an official close of $112.1/b. But after that it traded as low as $108.05/b before ending late night at around $109.7/b. Through the day it traded in a range of $106.87 – 112.72/b amid a flurry of news or rumors from Iran and the US. ”US temporary sanctions during negotiations” (falls alarm). ”We will bomb Iran” (not anyhow),… etc. While the market is still fluctuating to this kind of news flow, it is starting to take such headlines with a pinch of salt.

We’ll see. Maybe, maybe not. The Brent M1 contract is trading at $110.2/b this morning which very close to the average ticks through yesterday of $110.4/b.
Trump with bearish, verbal intervention whenever Brent trades above $110/b it seems. What seems to be a pattern is that Trump states something like ”very good negotiations going on with Iran”, ”New leaders in Iran are great,..”, ”Great progress in negotiations,…”, ”Deal in sight,..” etc whenever the Brent M1 contract trades above $110/b. An effort to cool the market. These hot air verbal interventions from Trump used to have a heavy bearish impact on prices, but they now seems to have less and less effect unless they are backed by reality.
As far as we can see there has been no real progress in the negotiations between the US and Iran with both sides still standing by their previous demands.
Iran is getting stronger while the cease fire lasts making a return to war for Trump yet harder. Iran is naturally in constant preparation for a return to war given Trump’s steady threats of bombing Iran again. Iran is naturally doing what ever is possible to prepare for a return to war. And every day the cease fire lasts it is better prepared. This naturally makes it more and more difficult and dangerous for the US to return to warring activity versus Iran as the consequences for energy infrastructure in the Persian Gulf will be more and more severe the longer the cease fire lasts. Israel seems to see it this way as well. That the war is not won and that current frozen state of a cease fire gives Iran opportunity to rebuild military and politically.
Global inventories are drawing down day by day. How much? In the meantime the Strait of Hormuz stays closed. There is varying measures and estimates of how much global inventories are drawing down. Our rough estimate, back of the envelope, is that global inventories are drawing down by at least some 10 mb/d or about 300 mb/d in a balance between loss of supply versus demand destruction. Other estimates we see are a monthly draw of 250-270 mb/d. The IEA only ’measured’ a draw in global observable stocks of 117 mb in April with oil on water rising 53 mb while on shore stocks fell 170 mb. But global stocks are hard to measure with large invisible, unmeasured stocks. As such a back of the envelope approach may be better.
Oil products is what the world is consuming. Oil product prices likely to rise while product stocks fall. Strategic Petroleum Reserves (SPR) are predominantly crude oil. Discharging oil from OECD SPR stocks, a sharp reduction in Chinese crude imports and a reduction in global refinery throughput of 6-7 mb/d has helped to keep crude oil markets satisfactorily supplied. But global inventories are drawing down none the less. And oil products is really what the world is consuming. So if global refinery throughput stays subdued, then demand will eventually have to match the supply of oil products. The likely path forward this summer is a steady draw down in jet fuel, diesel and gasoline. Higher prices for these. Then, if possible, higher refinery throughput and higher usage of crude in response to very profitable refinery margins. And lastly sharper draw in crude stocks and higher prices for these. But some 6 mb/d of oil products used to be exported through the Strait of Hormuz. And it may not be so easy to ramp up refinery activity across the world to compensate. Especially as Ukraine continues to damage Russian refineries as well as Russian crude production and export facilities.
Watch oil product stocks and prices as well as Brent calendar 2027. What to watch for this summer is thus oil product inventories falling and oil product premiums to crude rising. Another measure to watch is the Brent crude 2027 contract as it rises steadily day by day as the Strait of Hormuz stays closed and global oil inventories decline. The latter is close to the highest level since the start of the war and keeps rising.
The Brent M1 contract and the Brent 2027 prices and current price of jet fuel in Europe (ARA). All in USD/b

Our back of the envelope calculation of the global shortage created by the closure of the Strait of Hormuz. Note that 3.5 mb/d of discharge from SPR is also a draw. Note also that ’Forced demand loss’ of 2.5 mb/d is probably temporary and will fall back towards zero as logistics are sorted out leaving ’Price demand loss’ to do the job of balancing the market. Thus a shortfall of at least 9 mb/d created by the closure. More if SPR discharge is included and more if Forced demand loss recedes.

Brent is climbing higher. Front-month is at USD 106.3/bl this morning, close to a weekly high and a USD 9/bl jump from Mondays open. This is the move we flagged as a risk earlier in the week: the market shifting from ”a deal is around the corner” to ”this is going to take longer than we thought”.

Analyst Commodities, SEB
During April, rest-of-year Brent remained remarkably stable around USD 90/bl. A stability which rested on one single assumption: the SoH reopens around 1 May. That assumption is now slowly falling apart.
As we highlighted yesterday: every week of delay beyond 1 May adds (theoretically) ish USD 5/bl to the rest-of-year average, as global inventories draw 100 million barrels per week. i.e., a mid-May reopening implies rest-of-year Brent closer to USD 100/bl, and anything pushing into June or July takes us meaningfully higher.
What’s changed in the last 48 hours:
#1: The US military has formally warned that clearing suspected sea mines from SoH could take up to six months. That is a completely different timescale from what the financial market is pricing. Even a political deal tomorrow does not immediately reopen the strait.
#2: Trump has shifted his tone from urgency to ”strategic patience”. In yesterday’s press conference: ”Don’t rush me… I want a great deal.” The market is reading this as a president no longer feeling pressured by timelines, with the naval blockade running in the background.
#3: So far, the military activity is escalating, not de-escalating. Axios reports Iran is laying more mines in SoH. The US 3rd carrier strike group (USS George H.W. Bush) is arriving with two countermine vessels. Trump yesterday ordered the US Navy to destroy any Iranian boats caught laying mines. While CNN reports that the Pentagon is actively drawing up plans to strike Iranian SoH capabilities and individual Iranian military leaders if the ceasefire collapses. i.e., NOT a attitude consistent with an imminent deal!
Spot crude and product prices eased off the early-April highs on a combination of system rerouting and deal optimism. Both now weakening. Goldman estimates April Gulf output is reduced by 14.5 mbl/d, or 57% of pre-war supply, a number that keeps getting worse the longer this drags on.
Demand-side adaptation is ongoing: S. Korea has cut its Middle East crude dependence from 69% to 56% by pulling more from the Americas and Africa, and Japan is kicking off a second round of SPR releases from 1 May. But SPRs are finite.
Ref. to the negotiations, we should not bet on speed. The current Iranian leadership is dominated by genuine hardliners willing to absorb economic pain and run the clock to extract concessions. That is not a setup for a rapid resolution. US/Israeli media briefings keep framing the delay as ”internal Iranian divisions”, the reality is more complicated and points toward weeks and months, not days.
Our point is that the complexity is large, and higher prices have only just started (given a scenario where the negotiations drag out in time). The market spent April leaning on the USD 90/bl rest-of-year assumption; that case is diminishing by the hour. If ”early May reopening” is replaced by ”June, July or later” over the next week or two, both crude and products have meaningful room to reprice higher from here. There is a high risk being short energy and betting on any immediate political resolution(!).
Down on Friday. Up on Monday. The Brent June crude oil contract traded down 5.1% last week to a close of $90.38/b. It reached a high of $103.87/b last Monday and a low of $86.09/b on Friday as Iran announced that the Strait of Hormuz was fully open for transit. That quickly changed over the weekend as the US upheld its blockade of Iranian oil exports while Iran naturally responded by closing the SoH again. The US blew a hole in the engine room of the Iranian ship TOUSKA and took custody of the ship on Sunday. Brent crude is up 5.6% this morning to $95.4/b.
The cease-fire is expiring tomorrow. The US has said it will send a delegation for a second round of negotiations in Islamabad in Pakistan. But Iran has for now rejected a second round of talks as it views US demands as unrealistic and excessive while the US is also blocking the Strait of Hormuz.
While Brent is up 5% this morning, the financial market is still very optimistic that progress will be made. That talks will continue and that the SoH will fully open by the start of May which is consistent with a rest-of-year average Brent crude oil price of around $90/b with the market now trading that balance at around $88/b.
Financial optimism vs. physical deterioration. We have a divergence where the financial market is trading negotiations, improvements and resolution while at the same time the physical market is deteriorating day by day. Physical oil flows remain constrained by disrupted flows, longer voyage times and elevated freight and insurance costs.
Financial markets are betting that a US/Iranian resolution will save us in time from violent shortages down the road. But every day that the SoH remains closed is bringing us closer to a potentially very painful point of shortages and much higher prices.
The US blockade is also a weapon of leverage against its European and Asian allies. When Iran closed the SoH it held the world economy as a hostage against the US. The US blockade of the SoH is of course blocking Iranian oil exports. But it is also an action of disruption directed towards Europe and Asia. The US has called for the rest of the world to engaged in the war with Iran: ”If you want oil from the Persian Gulf, then go and get it”. A risk is that the US plays brinkmanship with the global oil market directed towards its European and Asian allies and maybe even towards China to force them to engage and take part. Maybe unthinkable. But unthinkable has become the norm with Trump in the White House.


Sommarväder skapar prisrally på elbörsen
Oil product price pain is set to rise as the Strait of Hormuz stays closed into summer

Solkraften pressar elpriserna dagtid

Michel Gubel ger sin syn på oljemarknaden