

Analys
SHB Råvarubrevet 14 juni 2013

 Råvaror allmänt
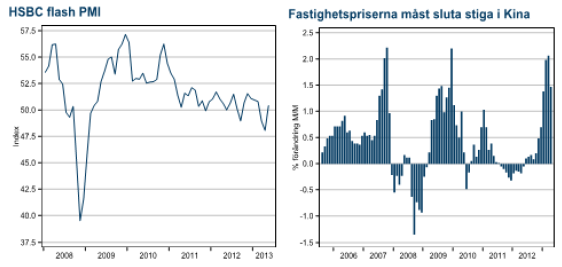
Kina fortsätter tynga ner marknaden
Under helgen levererade Kina sedvanlig månadsvis hårddata på hur ekonomin utvecklas. Data fortsätter vara någon svagare än vad som förväntas av den råvaruslukande ekonomin i öst. Nivåerna är ingen katastrof men vi är förvånade över att data fortfarande kommer ut under förväntansbilden då denna successivt skruvats ned av alla investmentbanker under våren. Nästa vecka kommer mjuka, framåtblickande indikatorer i form av preliminär PMI från HSBC (torsdag 20/6) och prisutveckling för fastighetsmarknaden (tisdag 18/6). Stigande fastighetspriser har varit orsaken till att regeringen infört begränsningar i utlåningen på sistone och vår rädsla är att dessa begränsningar kommer återspeglas i PMI men ännu inte fått effekt på fastighetspriserna. Den kombinationen blir i så fall en dålig cocktail för råvarumarknaden då den indikerar svagare industriell efterfrågan och behov av ytterligare nedkylning av fastighetsmarknaden.
Förutom Kinas makrodata som alltid är viktig för råvarumarknaden så är USA:s stimulanser högaktuella. Sedan Bernanke indikerade att stimulanserna snart kan upphöra eller minska den 22a maj har marknadens fokus ökat markant. Vi förväntar oss att Fed kommer börja skala ner stöden till marknaden under mötena i juni (nästa vecka) eller september. Detta torde påverka främst guldet och då i en negativ rikting eftersom inflationsförväntningarna säkerligen kommer falla ytterligare. I korten borde också en starkare dollar ligga, vilket är negativt för alla dollarnoterade råvaror men sedan den 22a maj har dollarn, oförklarligt förstärkts.
Basmetaller
Kina pressar metallerna – igen
Basmetallerna har efter förra veckans starka uppgång fallit tillbaka efter sämre än väntad kinadata. Störst fall noteras för nickel som tappat nästan 6 %. SRB, China Reserve Bureau, har skapat en ryktesvåg genom att skicka förfrågningar på köp av koppar. Reservbyrån har länge varit inaktiv under perioden med höga priser men efter att metallpriserna har fallit under våren så lockar det köpintresse. Financial Time påkallar att kinas stärkta valuta, RMB, gör att koppar på dagens 7300 inte är så dyrt för kineserna men sedan pristoppen 2011 så har bara RMB stärkts med 5-6% mot USD så vi kallar det nyhetstorka.
Freeport-McMoran har deklarerat force majeure efter olyckan den 14 maj i koppargruvan i Gras-berg. Force majeure är en klausul som används när en katastrof man inte kan påverka inträffar och ger producenten rätt att in behöva leverera från gruvan. Olyckan har reducerat kopparproduktionen med 1 361 ton per dag, vilket motsvarar 2,9 % av all koppar som producerats i genomsnitt detta år.
Den fysiska marknaden för basmetaller är stark och efter vårens nedgång ser vi basmetallerna som köpvärda på dessa nivåer. Vi tror på: LONG BASMET H
Ädelmetaller
Guldet rangehandlat
Sedan senaste råvarubrevet för två veckor sedan har guldpriset handlat i en väldigt tight range, 1 370 – 1 415 dollar per uns, och vi handlar just nu på samma nivå som då, 1 390 dollar. Övriga ädelmetaller, silver, platina och palladium har fallit marginellt sedan förra brevet. Vi är fortsatt negativa till guldet även om vi ser en risk att det kommer att locka till sig köpare så länge den kritiska nivån på 1 300 dollar håller.
Just 1 300 dollar per uns brukar anges som marginalkostnadsnivån för nyproduktion av guld, och skulle vi gå under 1 300 så faller – i teorin iallafall – en del av produktionen bort. Detta resonemang tenderar att fungera ganska bra för basmetaller, och vi behöver se vad som händer om vi skulle etablera oss på priser där nyproduktion av guld skulle vara olönsam. Vi tror att denna tes inte behöver vara applicerbar på guldet då just guld produceras till stor del ”mot lager” i form av tackor och mynt som hamnar i kassaskåp och centralbanksvalv. Vi behöver bevaka prisutvecklingen mycket noggrant just nu, skulle vi gå över 1 450 dollar per uns i en miljö där börsen faller och riskaversionen tilltar, då kommer vi nog att ta bort vår negativa syn. Skulle det däremot gå under 1 300 dollar så tror vi att fallhöjden är avsevärd då marknaden alltjämt är lång guld, sannolikt med förlust i positionerna.
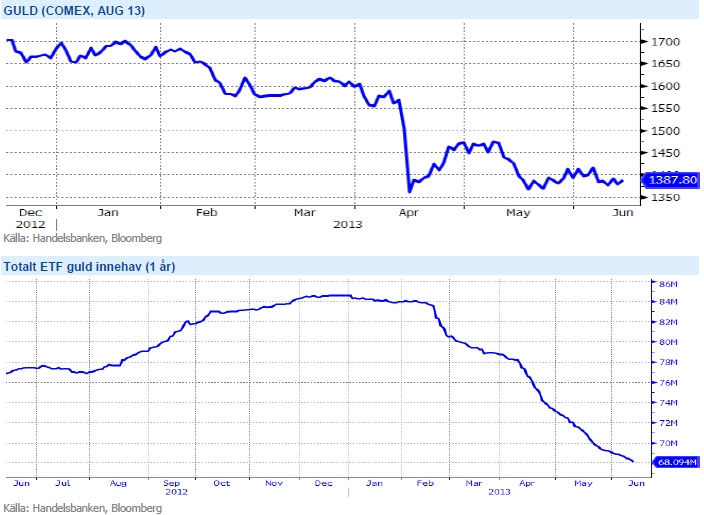
Urprisningen av QE driver ner guldet ytterligare samtidigt som dollarn stärks – vilket i sin tur ger lägre guld. Vi tror på: SHRT GULD H
Energi
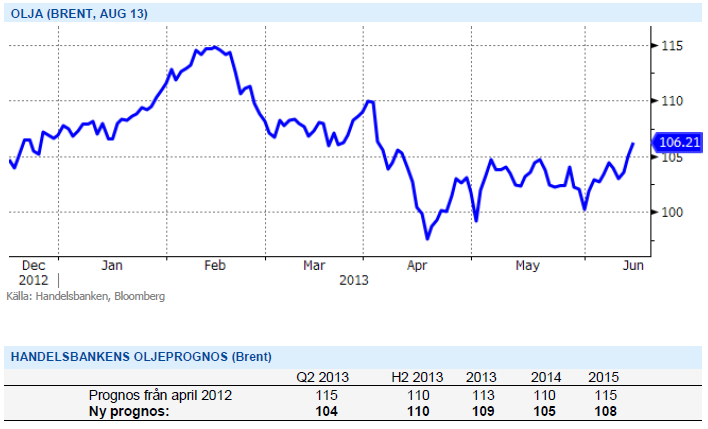
Även oljan rangehandlad
Oljan (brent) fortsätter att handlas i intervallet USD 100-105, där den har legat sedan början av maj. OPECs besked för någon vecka sedan om att låta produktionen ligga kvar oförändrat bidrog inte till att stärka sentimentet kring olja som är negativt med fokus på den stigande produktionen i USA och Kanada med minskad import till USA från Brentprisade regioner (västafrika) som följd. I det korta perspektivet går oljan mycket på makrodata från USA. Oljepriset gick upp över 105 USD/fat under fredag eftermiddag vilket är en nivå vi inte sett på tio veckor.
SHB Power Index tappar ytterligare 3.5 procent under veckan då i stort sett samtliga faktorer förutom utsläppsrätter pekar nedåt. Energibalansen förbättras med 1 TWh till -7.6 TWh mot normalt och spotpriset kommer in under förväntan. Även kol (god tillgång på exportmarknaden) och tyska elpriser (Tyskland producerade mer än vad som behövdes redan förra året, snabb utbyggnad av sol och vind i kombination med gynnsamma väderförhållanden, samtidigt som kol- och gasverken hålls igång för att säkra baskraften) når nya lågpunkter. Det är egentligen bara utsläppsrätterna som går mot ”strömmen” och stärks med 9 procent efter förnyat hopp om att man skall kunna rösta igenom ett omarbetat förslag till den sk backloadingplanen som tidigare röstades ned. Notera även att SHB power (underliggande till våra certifikat) nu går mot Q4-13.
Livsmedel
USDA-rapport i fokus denna vecka
Under veckan har priset på de stora grödorna vete, majs och sojabönor fallit. Inför onsdagens rapport från det amerikanska jordbruksdepartementet, USDA, föll priserna och efter rapporten publicerats har priserna fortsatt den nedåtgående trenden. Den amerikanska majskörden nedjusterades visserligen men klart mindre än väntat. En lägre produktion kompenserades delvis av något högre ingående lager samt minskad konsumtion. Trots en nedjustering av den globala tillgången på majs förväntar vi oss fortsatt fallande priser, utgående lager beräknas bli klart högre än för föregående säsong.
Priset på sojabönor handlades under veckan ned, med påverkan inte minst från fallande priser på majs. Givet inga större väderproblem fram till skörd förväntar vi oss en fortsatt nedgång för sojapriserna. Detta dels som följd av press från lägre priser på korrelerade råvaror men inte minst på grund av en klart större tillgång på sojabönor jämfört med föregående säsong – trots en mindre nedjustering av utgående globala lager i onsdagens rapport.
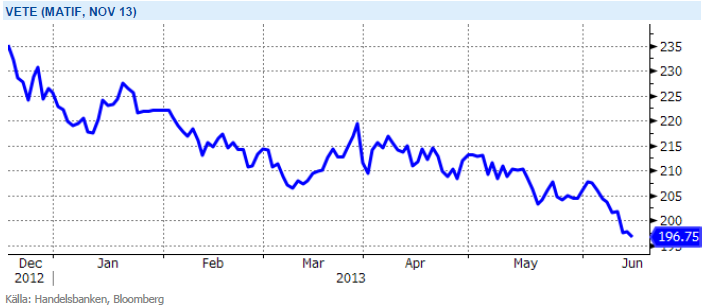
Priset på europeiskt vete har handlats ned dryga 5,5 % på 2 veckor, ned på veckan med 3 %. Även om tillgången på vete skrevs ned blir den dock, enligt onsdagens rapport, större än under förra säsongen och med en fortsatt hög förväntan på kommande majsskördar tror vi vetet kommer ha svårt att undgå en fortsatt prisnedgång.
Efter att alla frön är i jorden och prognoser på rekordskördar duggar tätt så finns alla förutsättningar för att priserna på de tre stora grödorna soja, majs och vete att falla fram till skörden är bärgad. Vi tror på: SHRT LIVSMEDEL H
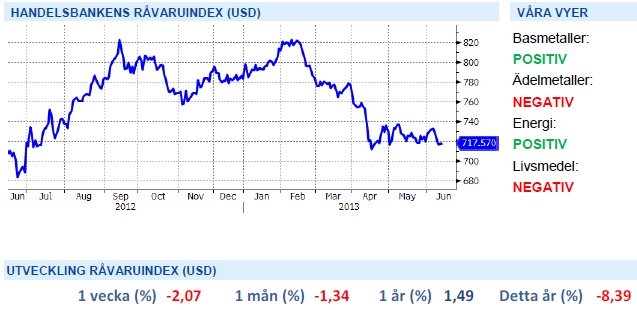
Handelsbankens Råvaruindex
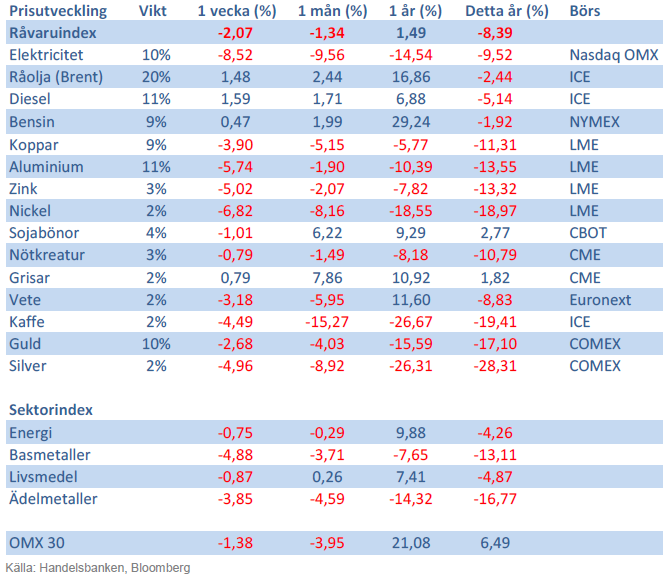
Handelsbankens råvaruindex består av de underliggande indexen för respektive råvara. Vikterna är bestämda till hälften från värdet av nordisk produktion (globala produktionen för sektorindex) och till hälften från likviditeten i terminskontrakten.
[box]SHB Råvarubrevet är producerat av Handelsbanken och publiceras i samarbete och med tillstånd på Råvarumarknaden.se[/box]
Ansvarsbegränsning
Detta material är producerat av Svenska Handelsbanken AB (publ) i fortsättningen kallad Handelsbanken. De som arbetar med innehållet är inte analytiker och materialet är inte oberoende investeringsanalys. Innehållet är uteslutande avsett för kunder i Sverige. Syftet är att ge en allmän information till Handelsbankens kunder och utgör inte ett personligt investeringsråd eller en personlig rekommendation. Informationen ska inte ensamt utgöra underlag för investeringsbeslut. Kunder bör inhämta råd från sina rådgivare och basera sina investeringsbeslut utifrån egen erfarenhet.
Informationen i materialet kan ändras och också avvika från de åsikter som uttrycks i oberoende investeringsanalyser från Handelsbanken. Informationen grundar sig på allmänt tillgänglig information och är hämtad från källor som bedöms som tillförlitliga, men riktigheten kan inte garanteras och informationen kan vara ofullständig eller nedkortad. Ingen del av förslaget får reproduceras eller distribueras till någon annan person utan att Handelsbanken dessförinnan lämnat sitt skriftliga medgivande. Handelsbanken ansvarar inte för att materialet används på ett sätt som strider mot förbudet mot vidarebefordran eller offentliggörs i strid med bankens regler.


Down 4.4% last week with more from OPEC+, a possible truce in Ukraine and weak US data. Brent crude fell 4.4% last week with a close of the week of USD 66.59/b and a range of USD 65.53-69.98/b. Three bearish drivers were at work. One was the decision by OPEC+ V8 to lift its quotas by 547 kb/d in September and thus a full unwind of the 2.2 mb/d of voluntary cuts. The second was the announcement that Trump and Putin will meet on Friday 15 August to discuss the potential for cease fire in Ukraine (without Ukraine). I.e. no immediate new sanctions towards Russia and no secondary sanctions on buyers of Russian oil to any degree that matters for the oil price. The third was the latest disappointing US macro data which indicates that Trump’s tariffs are starting to bite. Brent is down another 1% this morning trading close to USD 66/b. Hopes for a truce on the horizon in Ukraine as Putin meets with Trump in Alaska in Friday 15, is inching oil lower this morning.

Trump – Putin meets in Alaska. The potential start of a process. No disruption of Russian oil in sight. Trump has invited Putin to Alaska on 15 August to discuss Ukraine. The first such invitation since 2007. Ukraine not being present is bad news for Ukraine. Trump has already suggested ”swapping of territory”. This is not a deal which will be closed on Friday. But rather a start of a process. But Trump is very, very unlikely to slap sanctions on Russian oil while this process is ongoing. I.e. no disruption of Russian oil in sight.
What OPEC+ is doing, what it is saying and what we are hearing. OPEC+ V8 is done unwinding its 2.2 mb/d in September. It doesn’t mean production will increase equally much. Since it started the unwind and up to July (to when we have production data), the increase in quotas has gone up by 1.4 mb/d, while actual production has gone up by less than 0.7 mb/d. Some in the V8 group are unable to increase while others, like Russia and Iraq are paying down previous excess production debt. Russia and Iraq shouldn’t increase production before Jan and Mar next year respectively.
We know that OPEC+ has spare capacity which it will deploy back into the market at some point in time. And with the accelerated time-line for the redeployment of the 2.2 mb/d voluntary cuts it looks like it is happening fast. Faster than we had expected and faster than OPEC+ V8 previously announced.
As bystanders and watchers of the oil market we naturally combine our knowledge of their surplus spare capacity with their accelerated quota unwind and the combination of that is naturally bearish. Amid this we are not really able to hear or believe OPEC+ when they say that they are ready to cut again if needed. Instead we are kind of drowning our selves out in a combo of ”surplus spare capacity” and ”rapid unwind” to conclude that we are now on a highway to a bear market where OPEC+ closes its eyes to price and blindly takes back market share whatever it costs. But that is not what the group is saying. Maybe we should listen a little.
That doesn’t mean we are bullish for oil in 2026. But we may not be on a ”highway to bear market” either where OPEC+ is blind to the price.
Saudi OSPs to Asia in September at third highest since Feb 2024. Saudi Arabia lifted its official selling prices to Asia for September to the third highest since February 2024. That is not a sign that Saudi Arabia is pushing oil out the door at any cost.
Saudi Arabia OSPs to Asia in September at third highest since Feb 2024

Lower as OPEC+ keeps fast-tracking redeployment of previous cuts. Brent closed down 1.3% yesterday to USD 68.76/b on the back of the news over the weekend that OPEC+ (V8) lifted its quota by 547 kb/d for September. Intraday it traded to a low of USD 68.0/b but then pushed higher as Trump threatened to slap sanctions on India if it continues to buy loads of Russian oil. An effort by Donald Trump to force Putin to a truce in Ukraine. This morning it is trading down 0.6% at USD 68.3/b which is just USD 1.3/b below its July average.
Only US shale can hand back the market share which OPEC+ is after. The overall picture in the oil market today and the coming 18 months is that OPEC+ is in the process of taking back market share which it lost over the past years in exchange for higher prices. There is only one source of oil supply which has sufficient reactivity and that is US shale. Average liquids production in the US is set to average 23.1 mb/d in 2025 which is up a whooping 3.4 mb/d since 2021 while it is only up 280 kb/d versus 2024.
Taking back market share is usually a messy business involving a deep trough in prices and significant economic pain for the involved parties. The original plan of OPEC+ (V8) was to tip-toe the 2.2 mb/d cuts gradually back into the market over the course to December 2026. Hoping that robust demand growth and slower non-OPEC+ supply growth would make room for the re-deployment without pushing oil prices down too much.
From tip-toing to fast-tracking. Though still not full aggression. US trade war, weaker global growth outlook and Trump insisting on a lower oil price, and persistent robust non-OPEC+ supply growth changed their minds. Now it is much more fast-track with the re-deployment of the 2.2 mb/d done already by September this year. Though with some adjustments. Lifting quotas is not immediately the same as lifting production as Russia and Iraq first have to pay down their production debt. The OPEC+ organization is also holding the door open for production cuts if need be. And the group is not blasting the market with oil. So far it has all been very orderly with limited impact on prices. Despite the fast-tracking.
The overall process is nonetheless still to take back market share. And that won’t be without pain. The good news for OPEC+ is of course that US shale now is cooling down when WTI is south of USD 65/b rather than heating up when WTI is north of USD 45/b as was the case before.
OPEC+ will have to break some eggs in the US shale oil patches to take back lost market share. The process is already in play. Global oil inventories have been building and they will build more and the oil price will be pushed lower.
A Brent average of USD 60/b in 2026 implies a low of the year of USD 45-47.5/b. Assume that an average Brent crude oil price of USD 60/b and an average WTI price of USD 57.5/b in 2026 is sufficient to drive US oil rig count down by another 100 rigs and US crude production down by 1.5 mb/d from Dec-25 to Dec-26. A Brent crude average of USD 60/b sounds like a nice price. Do remember though that over the course of a year Brent crude fluctuates +/- USD 10-15/b around the average. So if USD 60/b is the average price, then the low of the year is in the mid to the high USD 40ies/b.
US shale oil producers are likely bracing themselves for what’s in store. US shale oil producers are aware of what is in store. They can see that inventories are rising and they have been cutting rigs and drilling activity since mid-April. But significantly more is needed over the coming 18 months or so. The faster they cut the better off they will be. Cutting 5 drilling rigs per week to the end of the year, an additional total of 100 rigs, will likely drive US crude oil production down by 1.5 mb/d from Dec-25 to Dec-26 and come a long way of handing back the market share OPEC+ is after.
The OPEC+ subgroup V8 this weekend decided to fully unwind their voluntary cut of 2.2 mb/d. The September quota hike was set at 547 kb/d thereby unwinding the full 2.2 mb/d. This still leaves another layer of voluntary cuts of 1.6 mb/d which is likely to be unwind at some point.
Higher quotas however do not immediately translate to equally higher production. This because Russia and Iraq have ”production debts” of cumulative over-production which they need to pay back by holding production below the agreed quotas. I.e. they cannot (should not) lift production before Jan (Russia) and March (Iraq) next year.
Argus estimates that global oil stocks have increased by 180 mb so far this year but with large skews. Strong build in Asia while Europe and the US still have low inventories. US Gulf stocks are at the lowest level in 35 years. This strong skew is likely due to political sanctions towards Russian and Iranian oil exports and the shadow fleet used to export their oil. These sanctions naturally drive their oil exports to Asia and non-OECD countries. That is where the surplus over the past half year has been going and where inventories have been building. An area which has a much more opaque oil market. Relatively low visibility with respect to oil inventories and thus weaker price signals from inventory dynamics there.
This has helped shield Brent and WTI crude oil price benchmarks to some degree from the running, global surplus over the past half year. Brent crude averaged USD 73/b in December 2024 and at current USD 69.7/b it is not all that much lower today despite an estimated global stock build of 180 mb since the end of last year and a highly anticipated equally large stock build for the rest of the year.
What helps to blur the message from OPEC+ in its current process of unwinding cuts and taking back market share, is that, while lifting quotas, it is at the same time also quite explicit that this is not a one way street. That it may turn around make new cuts if need be.
This is very different from its previous efforts to take back market share from US shale oil producers. In its previous efforts it typically tried to shock US shale oil producers out of the market. But they came back very, very quickly.
When OPEC+ now is taking back market share from US shale oil it is more like it is exerting a continuous, gradually increasing pressure towards US shale oil rather than trying to shock it out of the market which it tried before. OPEC+ is now forcing US shale oil producers to gradually back off. US oil drilling rig count is down from 480 in Q1-25 to now 410 last week and it is typically falling by some 4-5 rigs per week currently. This has happened at an average WTI price of about USD 65/b. This is very different from earlier when US shale oil activity exploded when WTI went north of USD 45/b. This helps to give OPEC+ a lot of confidence.
Global oil inventories are set to rise further in H2-25 and crude oil prices will likely be forced lower though the global skew in terms of where inventories are building is muddying the picture. US shale oil activity will likely decline further in H2-25 as well with rig count down maybe another 100 rigs. Thus making room for more oil from OPEC+.


What OPEC+ is doing, what it is saying and what we are hearing

Guld stiger till över 3500 USD på osäkerhet i världen

Lyten, tillverkare av litium-svavelbatterier, tar över Northvolts tillgångar i Sverige och Tyskland

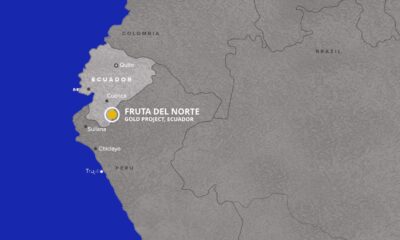
Lundin Gold hittar ny koppar-guld-fyndighet vid Fruta del Norte-gruvan

Alkane Resources och Mandalay Resources har gått samman, aktör inom guld och antimon

USA inför 93,5 % tull på kinesisk grafit

Fusionsföretag visar hur guld kan produceras av kvicksilver i stor skala – alkemidrömmen ska bli verklighet

Westinghouse planerar tio nya stora kärnreaktorer i USA – byggstart senast 2030

Ryska militären har skjutit ihjäl minst 11 guldletare vid sin gruva i Centralafrikanska republiken

Kopparpriset i fritt fall i USA efter att tullregler presenterats
-
 Nyheter3 veckor sedan
USA inför 93,5 % tull på kinesisk grafit
-
 Nyheter3 veckor sedan
Fusionsföretag visar hur guld kan produceras av kvicksilver i stor skala – alkemidrömmen ska bli verklighet
-
 Nyheter4 veckor sedan
Westinghouse planerar tio nya stora kärnreaktorer i USA – byggstart senast 2030
-
 Nyheter3 veckor sedan
Ryska militären har skjutit ihjäl minst 11 guldletare vid sin gruva i Centralafrikanska republiken
-
 Nyheter2 veckor sedan
Kopparpriset i fritt fall i USA efter att tullregler presenterats
-

 Nyheter4 veckor sedan
Eurobattery Minerals förvärvar majoritet i spansk volframgruva
-
 Nyheter2 veckor sedan
Lundin Gold rapporterar enastående borrresultat vid Fruta del Norte
-

 Nyheter3 veckor sedan
Kina skärper kontrollen av sällsynta jordartsmetaller, vill stoppa olaglig export