

Analys
SEB – Råvarukommentarer, 17 juni 2013

Rekommendationer
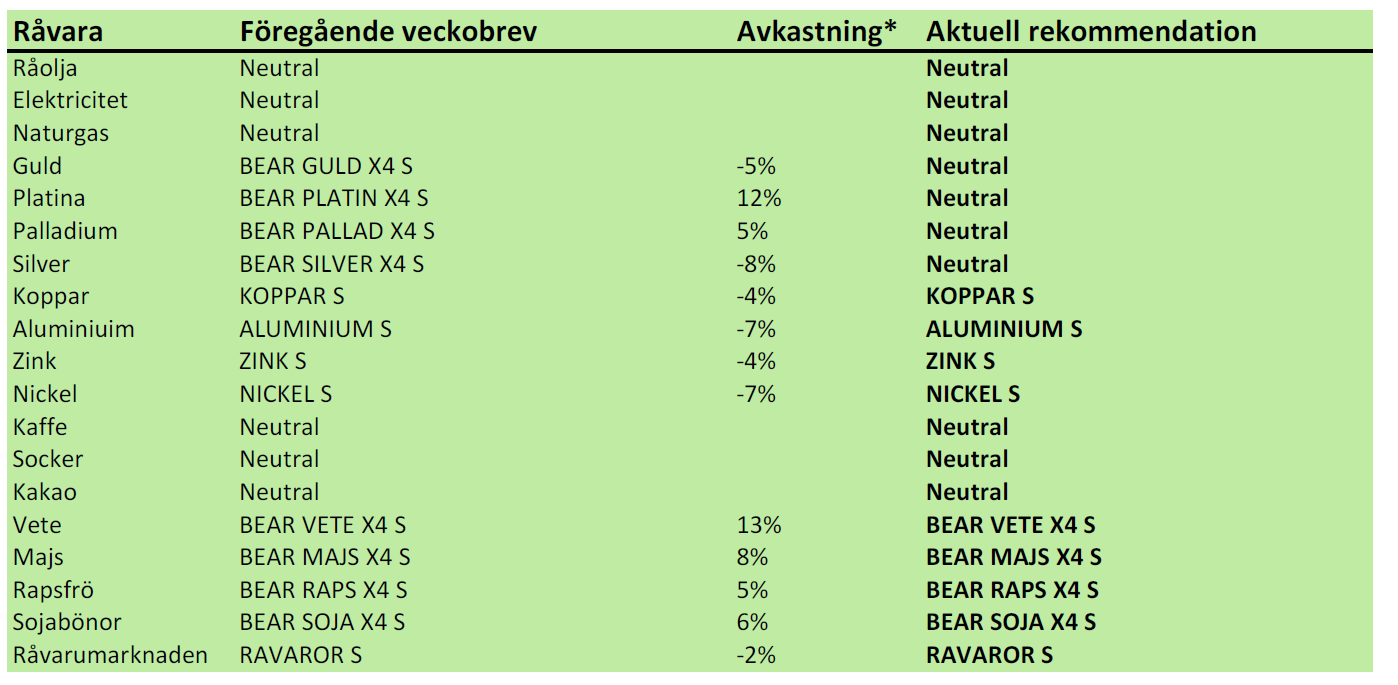
*) Avkastningen avser 1:1 råvarucertifikat där de ingår i rekommendationen. I den aktuella tabellen ovan har jag tagit prisförändringen den senaste veckan sedan det förra veckobrevet publicerades.
Inledning
Vi går från sälj till neutral rekommendation alla ädelmetaller i det här veckobrevet. USDA har rapporterat om produktion och efterfrågan på spannmål. En stor del av det här veckobrevet handlar om det. Priserna på basmetaller är nedtryckta i det “fundamentala golvet” och kan vara köpvärda på längre sikt. Socker tvärvände uppåt i fredags, utan att vi kunnat hitta någon annan anledning än att när alla var sålda, fanns risken att priset skulle gå upp.
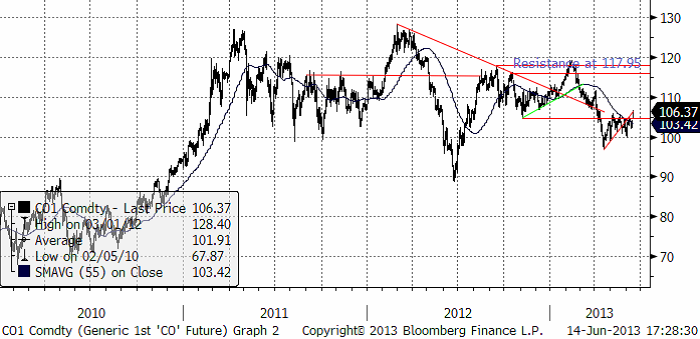
Råolja – Brent
Vi börjar nu närma oss det tredje kvartalet, som säsongsmässigt brukar vara en stark månad för oljepriset. I fredags bröt priset upp genom motståndet på 105 dollar och steg då ögonblickligen med 30 cent och fortsatte sedan upp till över 106 dollar.
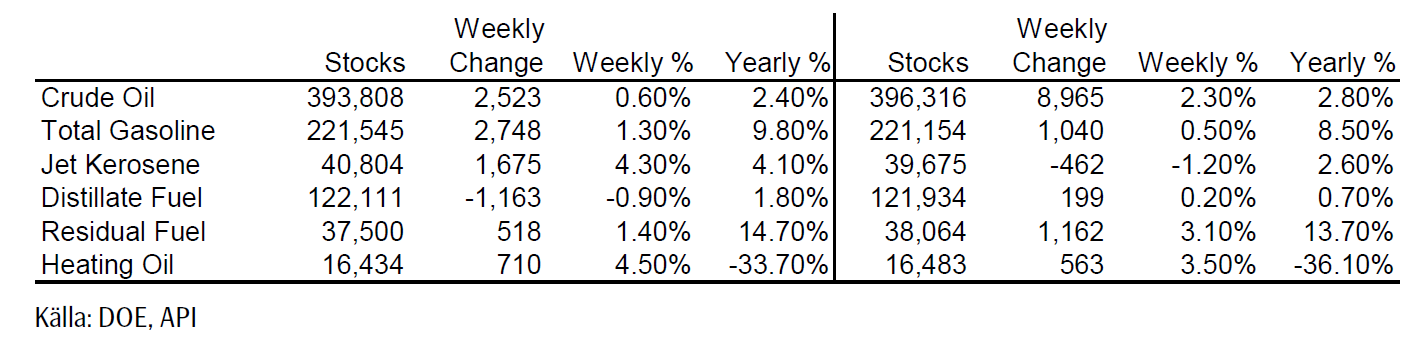
Lagren och lagerförändringarna i USA den senaste rapportveckan ser vi nedan, enligt Department of Energy och American Petroleum Institute.
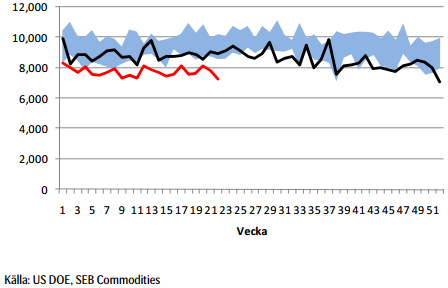
Nedan ser vi amerikanska råoljelager enligt DOE i tusen fat. Den svarta kurvan är 2012 års lagernivåer vecka för vecka och den lilla röda linjen är 2013 års nivå.
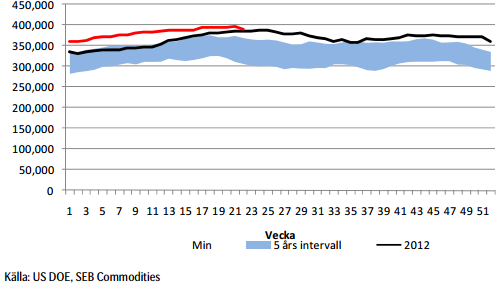
Importen fortsätter att hålla sig under förra årets nivå.
Det är intressant att notera att antalet borriggar utanför OPEC har legat stabilt mellan 800 och 900 sedan 2010. Antalet borriggar i oljerika OPEC har däremot ökat från 250 till 427 under samma tid. Prognosen är att OPEC:s reservkapacitet ska öka betydligt de kommande åren, även om produktionen just nu är mindre än tidigare, t ex i Libyen, som producerar mindre än 1 miljon fat om dagen. Innan Kadaffi-regimen föll producerade landet 1.7 miljoner fat om dagen.
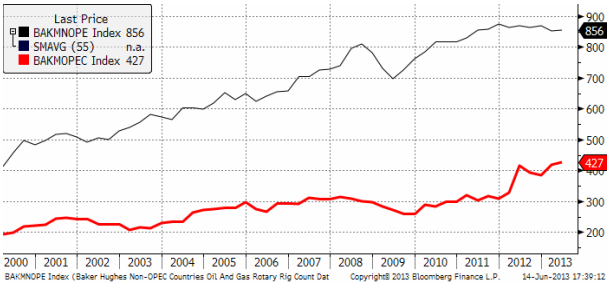
I borrigg-datat ser vi kanske en trendvändning, eftersom man i Mellanöstern kan utvinna olja till en kostnad betydligt under dagens marknadspris.
Vår vy är neutral till positiv. Det kan i det korta perspektivet komma en uppgång.
Elektricitet
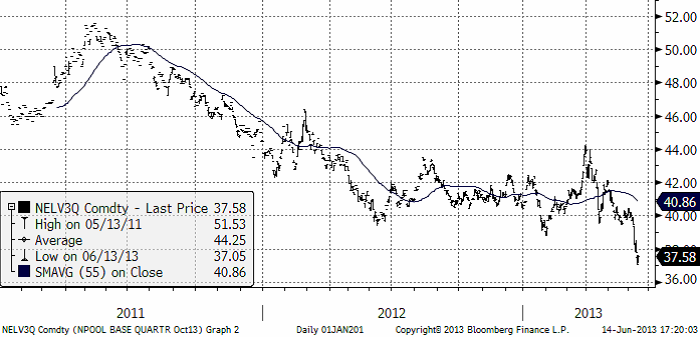
Förra veckan slutade i baisse och den har fortsatt hela veckan. Tredje kvartalets terminskontrakt, som vi ser i kursgrafen nedan, föll ner från 40 euro per MWh till 37.58 vid stängning i fredags. Bakom ligger en fortsatt återhämtning av den hydrologiska balansen, där underskottet om 10 veckor av Markedskraft väntas visa på ett underskott mot det normala så här års på endast 1 TWh.
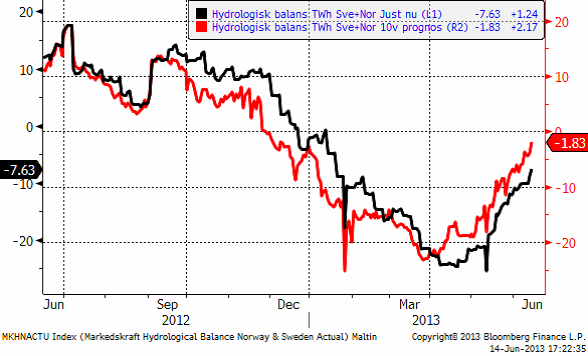
Hydrologisk balans har fortsatt att stiga, som vi ser i nedanstående diagram.
Utsläppsrätter har fortsatt att återhämta förlorad mark och har nu stigit till 4.70 euro per ton koldioxid. I april handlades rätterna som lägst till 2.46 euro för ”leverans” i december.
Priset har kommit ner så pass att det börjar bli intressant att köpa el, men rekommendationen blir än så länge ”neutral”.
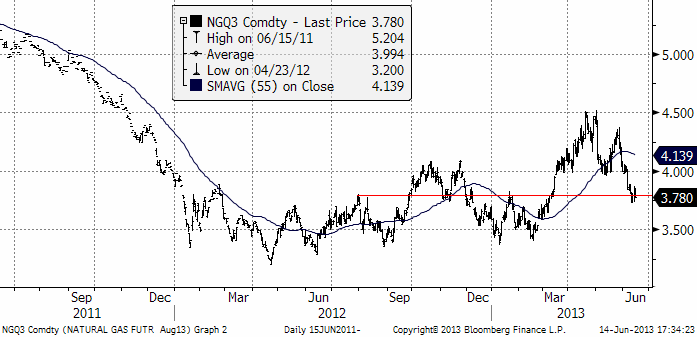
Naturgas
Naturgaspriset har den senaste veckan konsoliderat sig kring 3.80 dollar per MMBtu.
Antalet borriggar i USA för gas har enligt Baker Hughes minskat till den lägsta nivån sedan 1995. Antalet var oförändrat på 354 riggar i veckan, samma som veckan innan.
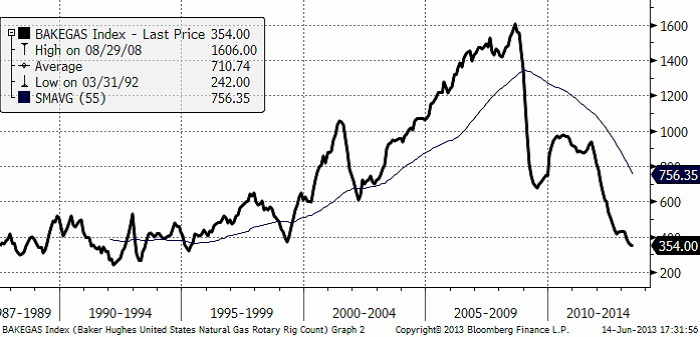
IEA rapporterar att de två kärnreaktorer som står still vid San Onofre i Kalifornien kommer att ersättas med naturgas. Det är ännu ett tecken på att gasen tar marknadsandelar i USA. Baker Hughes Rig Count data visar att antalet borr-riggar för gas ligger kvar nära 18-årslägsta som noterades den 10 maj. Orsaken till detta ointresse är det låga priset och för att produktionen ökar ändå. EIA räknar med att år 2013 blir det sjätte året på raken med rekordproduktion av naturgas i USA.
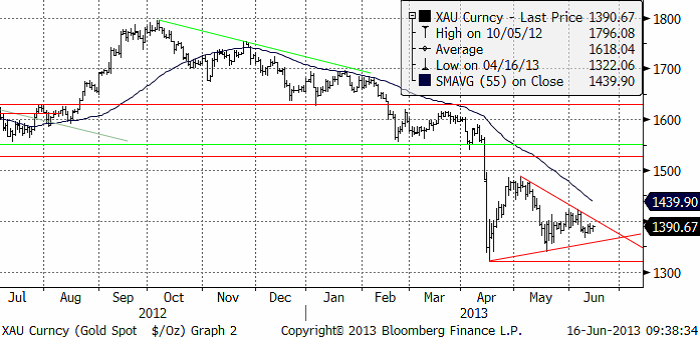
Guld och Silver
Guldpriset har stabiliserat sig den senaste veckan. Jag väntade mig ett nytt prisfall, men det uteblev. Vi ser istället att en triangelformation har bildats. Formen på den, med en brantare motståndslinje (den övre) än den undre, talar för att utbrottet från triangeln blir uppåt, baserat på erfarenhet. När så många kommentatorer och ”analytiker” är negativa till guldets framtida prisutveckling, skulle det inte heller förvåna om priset rör sig i motsatt riktning, dvs uppåt. Vi väljer därför att kliva av våra korta positioner och vara neutrala.
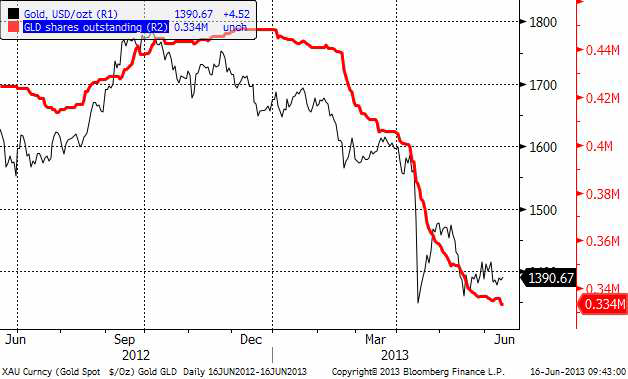
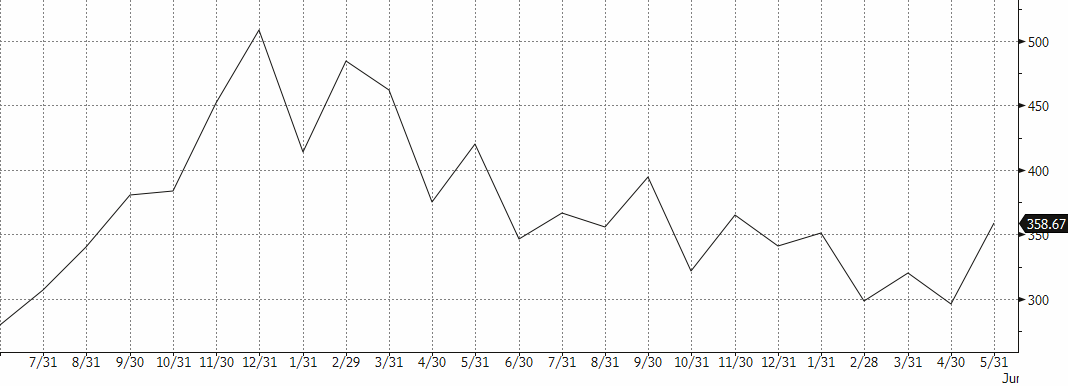
Investerare fortsätter att likvidera sina innehav av Gold Spiders, som vi ser nedan.
Nedan ser vi kursdiagrammet för silver i dollar per troy ounce. Stödet på 22 dollar bröts i för en vecka sedan och det indikerade ett prisfall ner mot 20 dollar. Detta har ännu inte inträffat. Marknaden är förvånansvärt stark, trots allt. Vi ser att motståndslinjen ligger precis ovanför dagens kursnivå. Om investerarnas förtroende återvänder, kan motståndet brytas och vi få ett slut på den fallande pristrenden.
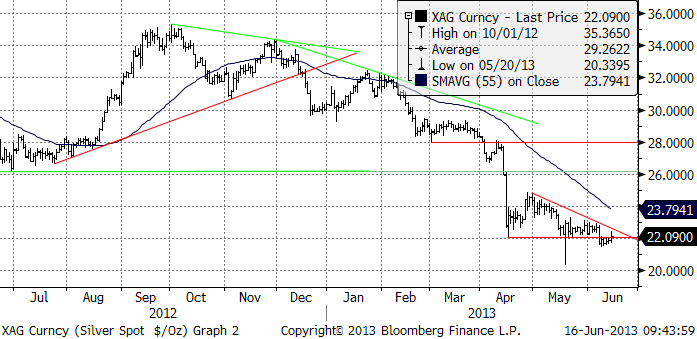
I det här läget, där vi huvudsakligen tror att trenden är nedåt, men vi inte är riktigt säkra, så väljer vi att gå över till neutral position.
Platina & Palladium
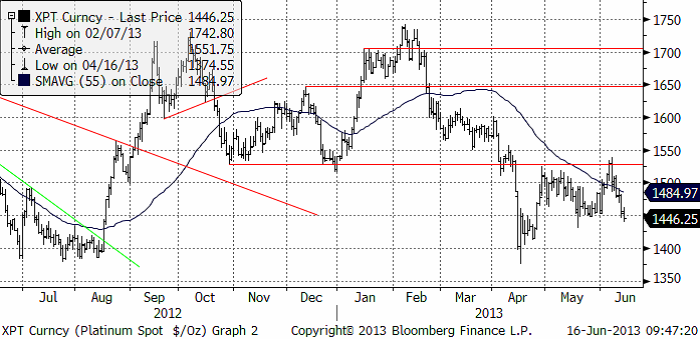
Platina föll tillbaka ordentligt i veckan som gick, vilket ökade värdet på BEAR PLATIN X4 S, som vi rekommenderat köp av. Priset har nu kommit ner en bit, men platina har fallit väsentligt mycket mindre än guld och silver. Kanske på goda grunder, men vi väljer i alla fall att gå över till neutral rekommendation.
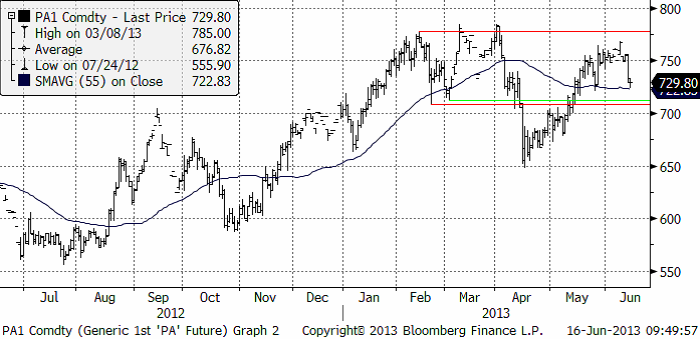
Palladium föll kraftigt i torsdags. Prisfallet hejdades på samma nivå som prisfallet i slutet av maj bottnade på. Uppenbarligen finns det köpare som tycker att den nivån är svår att motstå. Uppgången från botten i april slutade lägre än toppnoteringarna i mars och april, vilket är ett svaghetstecken. Palladium ligger på en mycket högre nivå än de andra ädelmetallerna, om man tittar på historiska relationer. Trots att prisfallet kortsiktigt har hejdats, är den lite längre trenden försvagad. Jag tror att vi får se ”sidledes” rörelse den närmaste tiden, och då blir rekommendationen att inta neutral position. Vi går alltså ur BEAR PALLAD X4 S.
Basmetaller
Råvarorna gick åt olika håll. Det svårt att utläsa något entydigt mönster just nu. Eurodollarn är stark, vilket innebär svag dollar vilket brukar vara positivt för dollarnoterade råvaror. Oljan svarar på den faktorn, och i viss mån de som verkligen ska göra det, d.v.s. ädelmetallerna. Men också där är det blandat med uppgångar för guld och silver medan Platinametallerna faller tillbaka.
Det senare kan vara en effekt av deras karaktär av att delvis betraktas som industrimetaller. Nickel och aluminium drabbades av kraftiga prisfall, minus ca 4 %. Zink och koppar höll sig bättre med nedgångar kring 1,5 % – den senare understödd av produktionsstoppet vid Grassberggruvan i Indonesien. Förra helgens batteri av industridata från Kina med lägre import och export, investeringar, utlåning och investeringar – satte stämningsläget direkt på måndag morgon.
Koppar
Om vi ser på koppar isolerat, är egentligen nyhetsflödet ganska ”positivt” i den bemärkelsen att utbudet riskerar att påverkas negativt de kommande månaderna. Det finns risk att det blir ”tight”, åtminstone tillfälligt. Grassberggruvan deklarerade force majeure för alla kopparleveranser under veckan. Gruvan är, på order av den Indonesiska regeringen, stängd för översyn efter en rad dödsolyckor på senare tid. Ett jordskred tidigare under året vid den stora Binghamgruvan i Utah US, är stängd sedan flera månader. Bristen är inte lika stor på koppar som för några år sedan, men utbudsstörningarna riskerar att få effekt, om de blir långvariga. Kinas importsiffror från förra månaden (som kunde läsas på skärmarna måndag morgon) visar ett ökat intag av koppar. Delvis är det en eftersläpande säsongseffekt efter det kinesiska nyåret, men icke desto mindre en positiv information till marknaden. Det ryktas samtidigt att regeringen är ute och sonderar för att öka de strategiska inköpen (historiskt har Kina varit stor köpare när priset dippar under $7000). Som vi skrivit tidigare har vi haft kopparn under bevakning för att gå från neutral till köp. Tekniskt sett har vi bedömt förutsättningarna som goda för kortsiktig uppgång. Trots de senaste veckornas tveksamhet, tar vi fasta på indikationer att det negativa stämningsläget kring koppar håller på att svänga om. Som vi skrivit tidigare tyder mycket på att lagren i Kina har betats av, och att avmattningen av importen är relativt snart övergående (vilket veckans siffra tyder på – se graf).
Kinas kopparimport (1000-tals ton)
De två senaste veckornas svaga utveckling sätter kopparn i ett mer neutralt läge i en sidledes trend. Avvaktan kan nu vara på sin plats. Om priset faller under $7000, är det köpläge igen, framför allt om vi når nivåer kring $6800 igen.
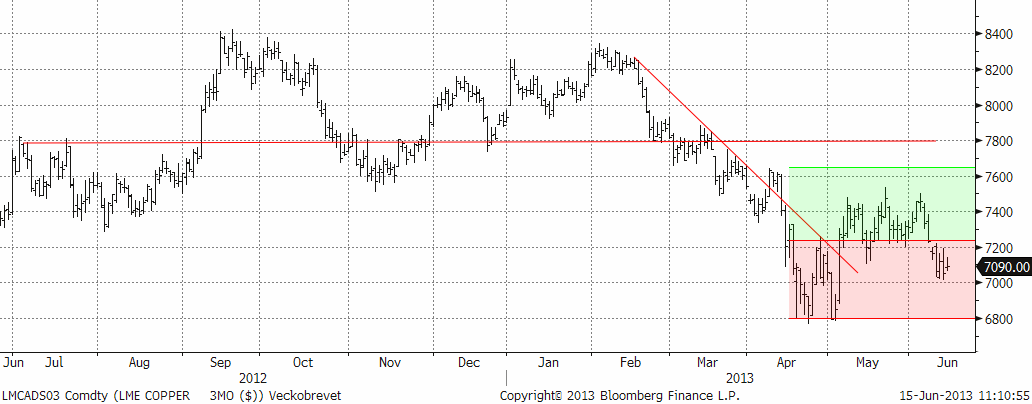
Vi förväntar oss fortsatt hög volatilitet. Vår kortsiktiga bedömning talar för uppsidan och vi rekommenderar därför köp av BULL KOPPAR X2 S eller X4 S.
Aluminium
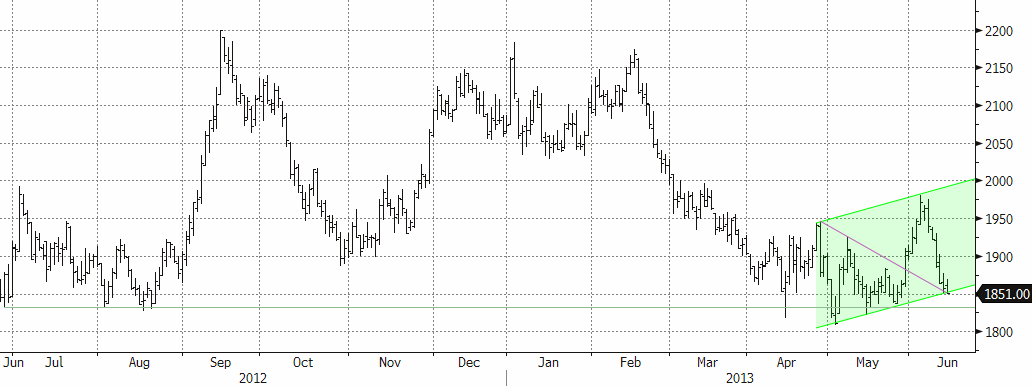
Priset har nu ”testat” stödnivåerna vid $1810-20 vid ett flertal tillfällen, och lyckats studsa upp. Det är ett styrketecken. Vi ser fysiska aktörer som går in och täcker in framtida konsumtion via terminsköp vid varje dipp. Tekniskt orienterade fonder har tidigare sålt vid varje uppställ. För två veckor sedan bröts mönstret. Istället började finansiella aktörer att köpa tillbaka kortpositioner i stora kvantiteter. Förra fredagens stängning över $1900, med ett bekräftat brott ur triangelformationen i kombination med starka Kinasiffror, gav förutsättningar för fortsatt uppgång på kort sikt, i första hand upp till $1950-nivån (vilket också materialiserades med råge). Veckans utveckling är ett tecken på att det är för tidigt att se den stora vändningen för aluminium. Lagren är för stora än så länge och det tar tid att ”beta av”. Vi ser ändå långsiktiga tecken på att marknaden dock succesivt håller på att bottna ur. Högkostnadsproducenterna, framför allt i Kina, förväntas minska utbudet (ännu mer) om priset långvarigt stannar på nuvarande nivåer. Den största aluminiumproducenten Chalco, annonserade i förra veckan att de stänger ytterligare produktionskapacitet motsvarande 380 tton.
Långsiktigt är nivån väldigt intressant för kontraktet Aluminium S (utan hävstång). Kortsiktigt är ett kontrakt med hävstång intressant, med potential inom trendkanalen.
Zink
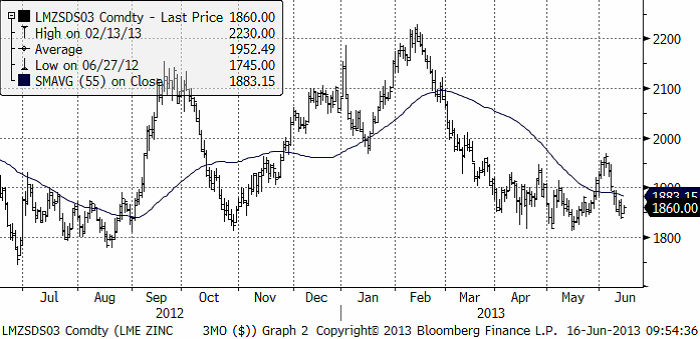
Situationen för zink påminner om den för aluminium, både fundamentalt och tekniskt. Vi bedömer zinken som ”billig” ur ett kostnadsperspektiv och nuvarande nivåer är mycket intressanta på lite längre sikt (6-12 månader). I det perspektivet är Zink S (utan hävstång) att föredra.
Nickel
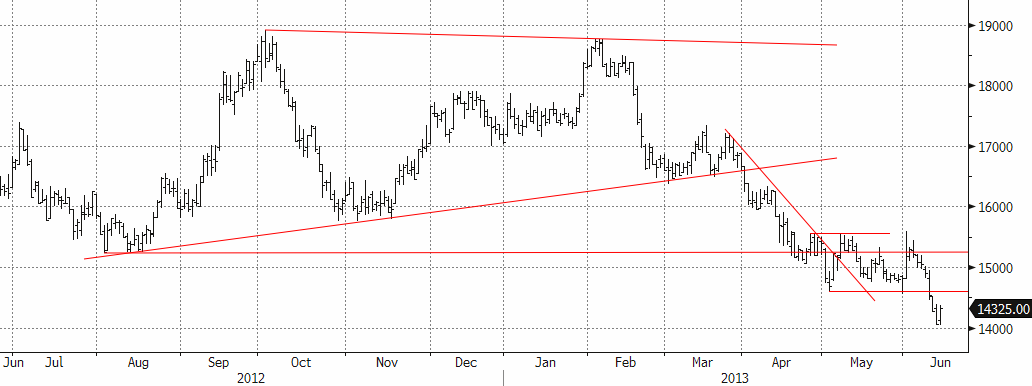
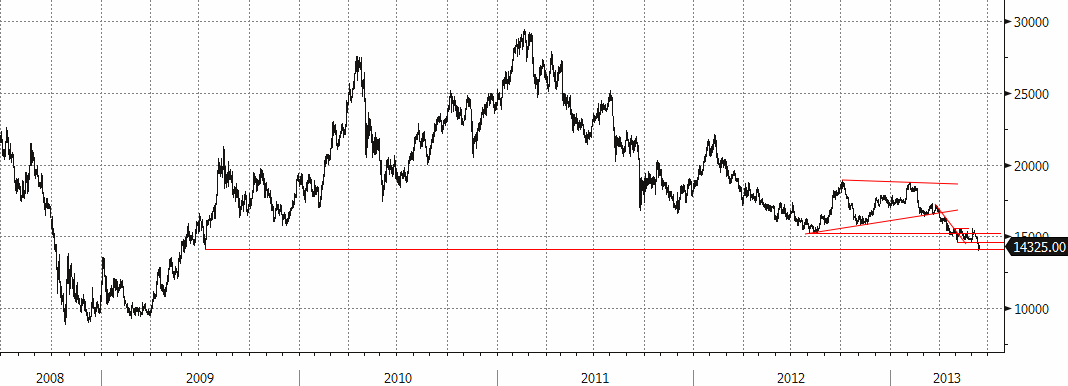
Nickel uppvisar förnyad svaghet. Priset bröt igenom stödet vid $14600, vilket lockade fram nya volymer och förnyat säljtryck. Priset nådde som lägst $14055, den lägsta nivån sedan juli 2009. Den relativa svagheten för nickel känns obefogad, och risken för de som har sålt på termin ökar. Det behövs inte mycket för att ”trigga” ännu ett s.k. short covering rally.
Trots väldigt goda efterfrågeutsikter på sikt, där den rostfria- och specialstålproduktionen förväntas öka med fortsatt utbyggnad av olje- och gasproduktion och specialstål till flygindustrin, ”lider” nickelmarknaden av ett överskott. Produktionstekniken av s.k. Nickel Pig Iron i Kina har utvecklats med s.k. Rotary Kiln Electric Furnaces (RKEF) teknik, vilken i genomsnitt sänker hela kostnadskurvan. Samtidigt får högkostnadsproducenterna i gruvledet problem på nuvarande nivåer. Vi har tidigare rapporterat om produktionsneddragningar i Australien, och det förväntas komma mer.
Effekten av RKEF-tekniken riskerar att flytta ner nivån där utbudsminskningarna verkligen får effekt. Priset har brutit viktiga stödnivåer, och vi får gå tillbaka till juli 2009 för att hitta lägre priser. I det perspektivet kommer nästa stora stödnivå in kring $14000. I veckan nådde vi nästa dit (14055 som lägst). Nivåerna är mycket attraktiva på 6-12 månaders sikt. I det perspektivet är Nickel S (utan hävstång) att föredra.
Nickel från juni 2012
Nickel från juni 2008
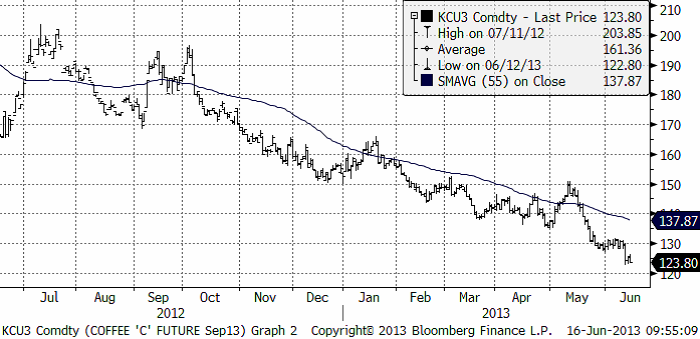
Kaffe
Kaffepriset tog ett steg ner för en vecka sedan och har sedan hållit sig stabilt. Priset börjar närma sig bottennivåer, men vi avvaktar till dess vi ser tecken på att trenden har vänt. Brasilianska kaffebönder rapporteras ha det allt värre, där många gör förluster på dagens priser.
Socker
Priset på socker tvärvände uppåt i fredags utan att vi kunde hitta någon bra fundamental anledning till detta. Det som nämns är att ”alla” var sålda terminer och att någon och sedan allt fler började stänga dessa. Rörelsen ser dock signifikant ut ur ett tekniskt perspektiv. Kanske är det så att marknaden börjar närma sig en botten.
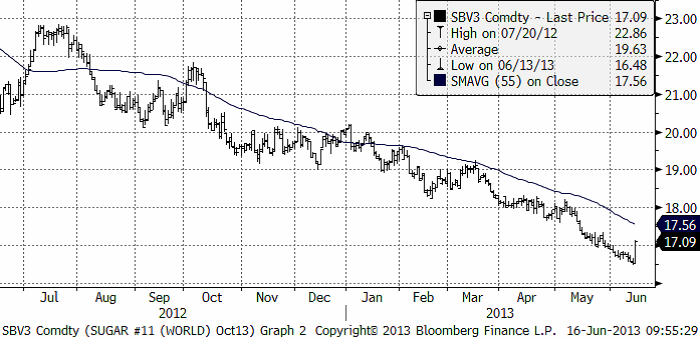
Vi fortsätter med neutral rekommendation till dess bilden klarnar något.
[box]SEB Veckobrev Veckans råvarukommentar är producerat av SEB Merchant Banking och publiceras i samarbete och med tillstånd på Råvarumarknaden.se[/box]
Disclaimer
The information in this document has been compiled by SEB Merchant Banking, a division within Skandinaviska Enskilda Banken AB (publ) (“SEB”).
Opinions contained in this report represent the bank’s present opinion only and are subject to change without notice. All information contained in this report has been compiled in good faith from sources believed to be reliable. However, no representation or warranty, expressed or implied, is made with respect to the completeness or accuracy of its contents and the information is not to be relied upon as authoritative. Anyone considering taking actions based upon the content of this document is urged to base his or her investment decisions upon such investigations as he or she deems necessary. This document is being provided as information only, and no specific actions are being solicited as a result of it; to the extent permitted by law, no liability whatsoever is accepted for any direct or consequential loss arising from use of this document or its contents.
About SEB
SEB is a public company incorporated in Stockholm, Sweden, with limited liability. It is a participant at major Nordic and other European Regulated Markets and Multilateral Trading Facilities (as well as some non-European equivalent markets) for trading in financial instruments, such as markets operated by NASDAQ OMX, NYSE Euronext, London Stock Exchange, Deutsche Börse, Swiss Exchanges, Turquoise and Chi-X. SEB is authorized and regulated by Finansinspektionen in Sweden; it is authorized and subject to limited regulation by the Financial Services Authority for the conduct of designated investment business in the UK, and is subject to the provisions of relevant regulators in all other jurisdictions where SEB conducts operations. SEB Merchant Banking. All rights reserved.

Market is starting to take US/Iran headlines with a pinch of salt. Brent crude rose $2.8/b yesterday to an official close of $112.1/b. But after that it traded as low as $108.05/b before ending late night at around $109.7/b. Through the day it traded in a range of $106.87 – 112.72/b amid a flurry of news or rumors from Iran and the US. ”US temporary sanctions during negotiations” (falls alarm). ”We will bomb Iran” (not anyhow),… etc. While the market is still fluctuating to this kind of news flow, it is starting to take such headlines with a pinch of salt.

We’ll see. Maybe, maybe not. The Brent M1 contract is trading at $110.2/b this morning which very close to the average ticks through yesterday of $110.4/b.
Trump with bearish, verbal intervention whenever Brent trades above $110/b it seems. What seems to be a pattern is that Trump states something like ”very good negotiations going on with Iran”, ”New leaders in Iran are great,..”, ”Great progress in negotiations,…”, ”Deal in sight,..” etc whenever the Brent M1 contract trades above $110/b. An effort to cool the market. These hot air verbal interventions from Trump used to have a heavy bearish impact on prices, but they now seems to have less and less effect unless they are backed by reality.
As far as we can see there has been no real progress in the negotiations between the US and Iran with both sides still standing by their previous demands.
Iran is getting stronger while the cease fire lasts making a return to war for Trump yet harder. Iran is naturally in constant preparation for a return to war given Trump’s steady threats of bombing Iran again. Iran is naturally doing what ever is possible to prepare for a return to war. And every day the cease fire lasts it is better prepared. This naturally makes it more and more difficult and dangerous for the US to return to warring activity versus Iran as the consequences for energy infrastructure in the Persian Gulf will be more and more severe the longer the cease fire lasts. Israel seems to see it this way as well. That the war is not won and that current frozen state of a cease fire gives Iran opportunity to rebuild military and politically.
Global inventories are drawing down day by day. How much? In the meantime the Strait of Hormuz stays closed. There is varying measures and estimates of how much global inventories are drawing down. Our rough estimate, back of the envelope, is that global inventories are drawing down by at least some 10 mb/d or about 300 mb/d in a balance between loss of supply versus demand destruction. Other estimates we see are a monthly draw of 250-270 mb/d. The IEA only ’measured’ a draw in global observable stocks of 117 mb in April with oil on water rising 53 mb while on shore stocks fell 170 mb. But global stocks are hard to measure with large invisible, unmeasured stocks. As such a back of the envelope approach may be better.
Oil products is what the world is consuming. Oil product prices likely to rise while product stocks fall. Strategic Petroleum Reserves (SPR) are predominantly crude oil. Discharging oil from OECD SPR stocks, a sharp reduction in Chinese crude imports and a reduction in global refinery throughput of 6-7 mb/d has helped to keep crude oil markets satisfactorily supplied. But global inventories are drawing down none the less. And oil products is really what the world is consuming. So if global refinery throughput stays subdued, then demand will eventually have to match the supply of oil products. The likely path forward this summer is a steady draw down in jet fuel, diesel and gasoline. Higher prices for these. Then, if possible, higher refinery throughput and higher usage of crude in response to very profitable refinery margins. And lastly sharper draw in crude stocks and higher prices for these. But some 6 mb/d of oil products used to be exported through the Strait of Hormuz. And it may not be so easy to ramp up refinery activity across the world to compensate. Especially as Ukraine continues to damage Russian refineries as well as Russian crude production and export facilities.
Watch oil product stocks and prices as well as Brent calendar 2027. What to watch for this summer is thus oil product inventories falling and oil product premiums to crude rising. Another measure to watch is the Brent crude 2027 contract as it rises steadily day by day as the Strait of Hormuz stays closed and global oil inventories decline. The latter is close to the highest level since the start of the war and keeps rising.
The Brent M1 contract and the Brent 2027 prices and current price of jet fuel in Europe (ARA). All in USD/b

Our back of the envelope calculation of the global shortage created by the closure of the Strait of Hormuz. Note that 3.5 mb/d of discharge from SPR is also a draw. Note also that ’Forced demand loss’ of 2.5 mb/d is probably temporary and will fall back towards zero as logistics are sorted out leaving ’Price demand loss’ to do the job of balancing the market. Thus a shortfall of at least 9 mb/d created by the closure. More if SPR discharge is included and more if Forced demand loss recedes.

Brent is climbing higher. Front-month is at USD 106.3/bl this morning, close to a weekly high and a USD 9/bl jump from Mondays open. This is the move we flagged as a risk earlier in the week: the market shifting from ”a deal is around the corner” to ”this is going to take longer than we thought”.

Analyst Commodities, SEB
During April, rest-of-year Brent remained remarkably stable around USD 90/bl. A stability which rested on one single assumption: the SoH reopens around 1 May. That assumption is now slowly falling apart.
As we highlighted yesterday: every week of delay beyond 1 May adds (theoretically) ish USD 5/bl to the rest-of-year average, as global inventories draw 100 million barrels per week. i.e., a mid-May reopening implies rest-of-year Brent closer to USD 100/bl, and anything pushing into June or July takes us meaningfully higher.
What’s changed in the last 48 hours:
#1: The US military has formally warned that clearing suspected sea mines from SoH could take up to six months. That is a completely different timescale from what the financial market is pricing. Even a political deal tomorrow does not immediately reopen the strait.
#2: Trump has shifted his tone from urgency to ”strategic patience”. In yesterday’s press conference: ”Don’t rush me… I want a great deal.” The market is reading this as a president no longer feeling pressured by timelines, with the naval blockade running in the background.
#3: So far, the military activity is escalating, not de-escalating. Axios reports Iran is laying more mines in SoH. The US 3rd carrier strike group (USS George H.W. Bush) is arriving with two countermine vessels. Trump yesterday ordered the US Navy to destroy any Iranian boats caught laying mines. While CNN reports that the Pentagon is actively drawing up plans to strike Iranian SoH capabilities and individual Iranian military leaders if the ceasefire collapses. i.e., NOT a attitude consistent with an imminent deal!
Spot crude and product prices eased off the early-April highs on a combination of system rerouting and deal optimism. Both now weakening. Goldman estimates April Gulf output is reduced by 14.5 mbl/d, or 57% of pre-war supply, a number that keeps getting worse the longer this drags on.
Demand-side adaptation is ongoing: S. Korea has cut its Middle East crude dependence from 69% to 56% by pulling more from the Americas and Africa, and Japan is kicking off a second round of SPR releases from 1 May. But SPRs are finite.
Ref. to the negotiations, we should not bet on speed. The current Iranian leadership is dominated by genuine hardliners willing to absorb economic pain and run the clock to extract concessions. That is not a setup for a rapid resolution. US/Israeli media briefings keep framing the delay as ”internal Iranian divisions”, the reality is more complicated and points toward weeks and months, not days.
Our point is that the complexity is large, and higher prices have only just started (given a scenario where the negotiations drag out in time). The market spent April leaning on the USD 90/bl rest-of-year assumption; that case is diminishing by the hour. If ”early May reopening” is replaced by ”June, July or later” over the next week or two, both crude and products have meaningful room to reprice higher from here. There is a high risk being short energy and betting on any immediate political resolution(!).
Down on Friday. Up on Monday. The Brent June crude oil contract traded down 5.1% last week to a close of $90.38/b. It reached a high of $103.87/b last Monday and a low of $86.09/b on Friday as Iran announced that the Strait of Hormuz was fully open for transit. That quickly changed over the weekend as the US upheld its blockade of Iranian oil exports while Iran naturally responded by closing the SoH again. The US blew a hole in the engine room of the Iranian ship TOUSKA and took custody of the ship on Sunday. Brent crude is up 5.6% this morning to $95.4/b.
The cease-fire is expiring tomorrow. The US has said it will send a delegation for a second round of negotiations in Islamabad in Pakistan. But Iran has for now rejected a second round of talks as it views US demands as unrealistic and excessive while the US is also blocking the Strait of Hormuz.
While Brent is up 5% this morning, the financial market is still very optimistic that progress will be made. That talks will continue and that the SoH will fully open by the start of May which is consistent with a rest-of-year average Brent crude oil price of around $90/b with the market now trading that balance at around $88/b.
Financial optimism vs. physical deterioration. We have a divergence where the financial market is trading negotiations, improvements and resolution while at the same time the physical market is deteriorating day by day. Physical oil flows remain constrained by disrupted flows, longer voyage times and elevated freight and insurance costs.
Financial markets are betting that a US/Iranian resolution will save us in time from violent shortages down the road. But every day that the SoH remains closed is bringing us closer to a potentially very painful point of shortages and much higher prices.
The US blockade is also a weapon of leverage against its European and Asian allies. When Iran closed the SoH it held the world economy as a hostage against the US. The US blockade of the SoH is of course blocking Iranian oil exports. But it is also an action of disruption directed towards Europe and Asia. The US has called for the rest of the world to engaged in the war with Iran: ”If you want oil from the Persian Gulf, then go and get it”. A risk is that the US plays brinkmanship with the global oil market directed towards its European and Asian allies and maybe even towards China to force them to engage and take part. Maybe unthinkable. But unthinkable has become the norm with Trump in the White House.


Sommarväder skapar prisrally på elbörsen
Oil product price pain is set to rise as the Strait of Hormuz stays closed into summer

Solkraften pressar elpriserna dagtid

Michel Gubel ger sin syn på oljemarknaden