

Analys
SHB Råvarubrevet 10 oktober 2014

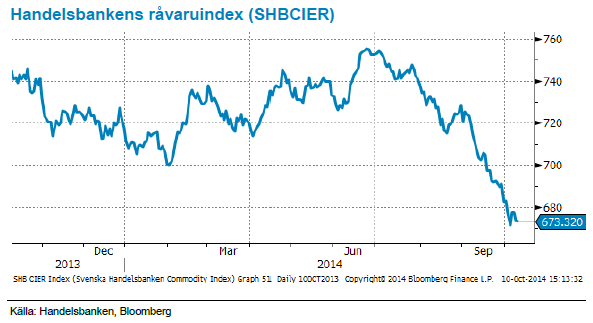
Råvaror allmänt: Händelserik vecka trots lite makrodata
Makro-agendan var tunn men blev trots det en besvikelse där Tyska tillverkningsorder och export varit överraskande svag i september. Europas viktigaste land följdes upp av ECB:s ledare Draghi som körde en upprepning av tidigare utsago och påtalade Europas strukturella problem snarare än konjunkturella. En ny besvikelse för marknaden och Europa är nu åter ett stort orosmoln. Draghi betonar att regeringar måste genomföra reformer. Regeringar med utrymme bör föra en mer expansiv finanspolitik
Från USA kom Fed protokollet (FOMC minutes) från mötet den 15-16 sep som visade ökad oro bland ledamöter för en starkare amerikansk dollar och global inbromsning med svaghet i europeisk ekonomi och inflation. Fed ledamöterna förordar räntor nära noll under en ”betydande tid” efter avslutade obligationsköp. Vissa förordar tålamod, snarare än motsatsen, i väntan på bevis om uthållig förbättring mot målet. Det var en Fed-röst som påtalade risker i globala tillväxten på ett sätt som marknaden inte förväntat sig.
Konjunkturhandlade råvaror, främst olja har varit svaga tillsammans med börsen på veckans utspel från centralbankerna.
Energi: Fokus på oljan
Oljan handlas nu under 90-strecket för första gången sedan juni 2012. Det året kunde man köpa olja för under 90 USD/fat dagen före midsommar i spåren av Libyens återkomst efter att Gaddafi hade störtats. Libyens oljeproduktion föll snart samman i efterföljande kamp om makten och priset steg tillbaka. Sedan 2011 har oljan rangehandlats till ett genomsnittspris på 110 USD/fat, medan WTI har handlats till rabatt p.g.a ökad inhemsk produktion och inlandshandelspunkt.
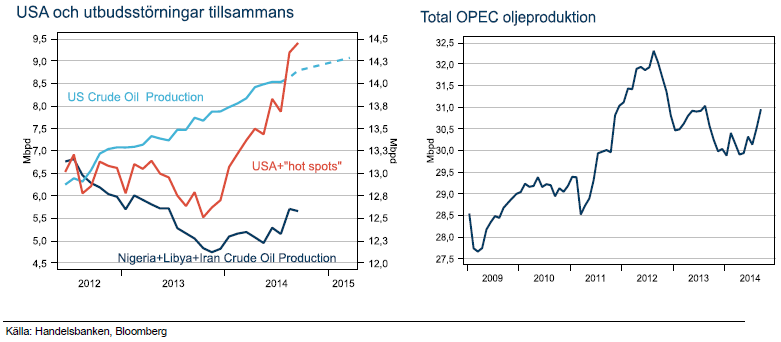
I år har oljan tappat 23 % från toppen i juni efter att USA:s oljeproduktion väntas nå 30 års högsta, att OPEC inte har skalat ned produktionen, att Rysslands oljeproduktion nära post-sovjet-all time high, att Saudi sänkte priset (istället för produktionen) på leveranser under november till Asien och att IMF sänkte prognosen för den globala tillväxten för 2015.
Varför har då inte oljan fallit tidigare om USA ökat produktionen sedan 2011? Det förklaras av att det under samma tid uppstått utbudsstörningar i en rad viktiga oljeländer som har inverkat negativt och kompenserat ut USA:s växande produktion. Effekten märktes inte i början av 2014 eftersom det fanns en rysslandsriskpremie i oljepriset men den har slagit igenom med full kraft efter den här sommaren. Se röd linje i graf nedan.
Marknadens oro har även ökat eftersom OPEC som brukligt inte aktivt bromsat fallet genom att strypa produktionen (se graf). Saudi minskade produktionen i augusti men data i september visade att OPEC ökat totala produktionen. Det betyder att övriga OPEC-länder inte följt Saudi. Flera medlemmar har varit överrens om förändring i produktion men endast Saudi har genomfört dem. Saudi vet att man i längden inte kan parera för USA:s årliga ökning utan man måste få med övriga kartellmedlemmar i båten.
Saudi svarade denna gång med att sänka priserna på november leveranser till Asien som är marginalköparen på den olja som USA inte längre importerar. Det ses som ett tecken på att OPEC håller på att destabiliseras och inte kan hantera USA:s växande produktion och minskade import. Nästa OPEC-möte är 27 november i Wien.
Ser vi till tillväxttakten i USA så har den toppat 2013, de enklaste brunnarna är borrade och halveringstakten är mycket hög vilket gör att det krävs allt mer investeringar för att fortsätta öka produktionen. Med senaste prognosen för 2015 som för första gången så kommer vi ner ordentligt i produktionstakt. Det vore ju därför märkligt om OPEC inte kan hantera situationen om nu USA effekten kommer minska inom 1 år.
Vi tror att den strukturella pressen kommer fortsätta, men på dessa nivåer kan den riskvillige köpa.
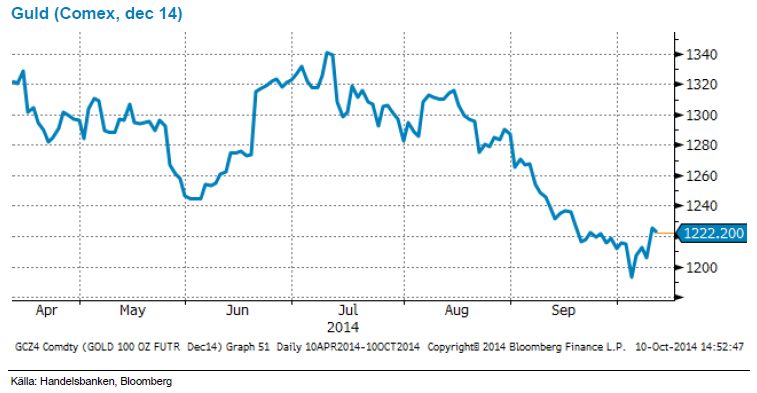
Ädelmetaller: Guldet studsar upp
Veckans FOMC minutes (Fed) gav guldpriset en ordentlig studs efter fallet på drygt 8 % under perioden juli till september. Protokollet tolkades som att Fed inte är alls så hökigt som tidigare befarat och fick dollarn på fall vilket gav ytterligare stöd till guldpriset.
Visst intresse för att köpa guld som säker hamn kan också skönjas efter senaste vågen av negativt sentiment kring Europa, tillspetsat av att IMF sänkte tillväxtprognosen för världen för 2015. Svagare börs hjälper också guld som alternativ investering. S&P är ner 4 % från toppen, fortsätter raset tror vi att det är läge att vara positiv till guldet.
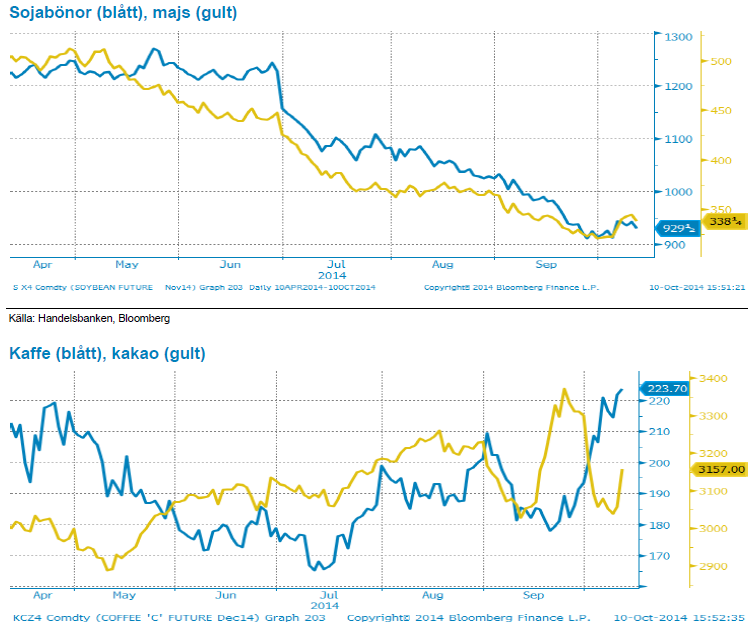
Livsmedel: Kakao på 4 års-högsta
Under sista veckan i september nådde kakaopriset 4–årshögsta efter senaste tidens rapporter om den förvärrade situationen i Västafrika i samband med Ebolaspridningen och en eventuell spridning till Elfenbenskusten. Kakao handlas nu återigen på samma nivåer som innan uppgången, skördearbetet är i full gång med en förväntad rekordskörd från Elfenbenskusten.
Kaffe har skjutit i höjden på nytt och har i veckan handlats på årshögsta. En tidig utblomning orsakat av det ojämna klimatet i sydöstra Brasilien under året och regionen är i kraftigt behov av nederbörd. Läget är akut och markfuktigheten är långt under normalen i de viktiga odlingsområdena. Fortsätter det torra vädret finns det stor risk att torkan slår ut blommorna och skapar ännu större osäkerhet kring kommande års prognoser.
Priset på sojabönor har stigit under veckan, delvis som följd av skördefördröjande regn i USA och torrt väder i Brasilien. Än har inte regnet i USA gjort någon skada och torrare väder väntas inom de närmsta dagarna. Precis som för majsen fortsätter rapporter att visa på rekordavkastning efterhand som skörden fortskrider norrut och vi förväntar oss ytterligare uppjustering av den amerikanska sojans avkastning i kvällens USDA-rapport. Dryga 10 procent av den brasilianska sådden är avklarad utan större problem om än torrt i vissa regioner. Såvida inte torkan i Brasilien förvärras i större omfattning eller utsträckning tror vi att sojapriserna har ytterligare mer att falla. Påminner om det tradingcase på spreadcertifikat majs/sojabönor vi skickat ut tidigare. Läs mer här.
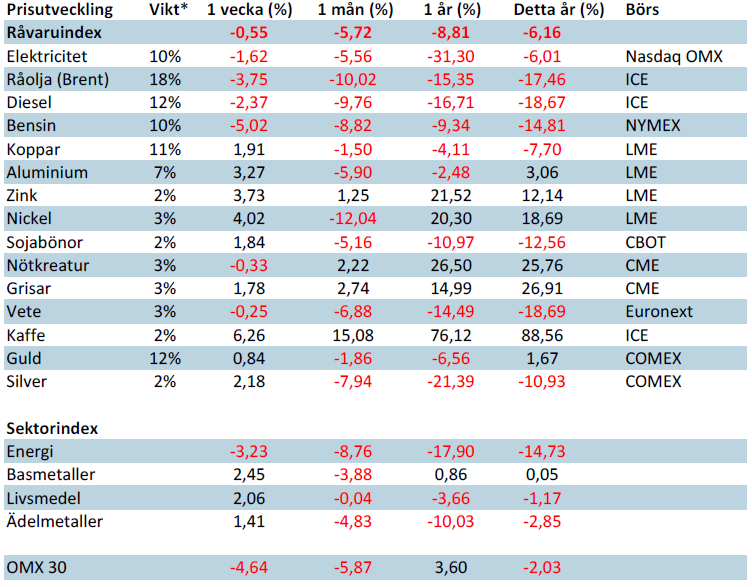
Handelsbankens råvaruindex (USD)
[box]SHB Råvarubrevet är producerat av Handelsbanken och publiceras i samarbete och med tillstånd på Råvarumarknaden.se[/box]
Ansvarsbegränsning
Detta material är producerat av Svenska Handelsbanken AB (publ) i fortsättningen kallad Handelsbanken. De som arbetar med innehållet är inte analytiker och materialet är inte oberoende investeringsanalys. Innehållet är uteslutande avsett för kunder i Sverige. Syftet är att ge en allmän information till Handelsbankens kunder och utgör inte ett personligt investeringsråd eller en personlig rekommendation. Informationen ska inte ensamt utgöra underlag för investeringsbeslut. Kunder bör inhämta råd från sina rådgivare och basera sina investeringsbeslut utifrån egen erfarenhet.
Informationen i materialet kan ändras och också avvika från de åsikter som uttrycks i oberoende investeringsanalyser från Handelsbanken. Informationen grundar sig på allmänt tillgänglig information och är hämtad från källor som bedöms som tillförlitliga, men riktigheten kan inte garanteras och informationen kan vara ofullständig eller nedkortad. Ingen del av förslaget får reproduceras eller distribueras till någon annan person utan att Handelsbanken dessförinnan lämnat sitt skriftliga medgivande. Handelsbanken ansvarar inte för att materialet används på ett sätt som strider mot förbudet mot vidarebefordran eller offentliggörs i strid med bankens regler.


Some rebound but not much. Brent crude rebounded 1.5% yesterday to $65.47/b. This morning it is inching 0.2% up to $65.6/b. The lowest close last week was on Thursday at $64.11/b.

The curve structure is almost as week as it was before the weekend. The rebound we now have gotten post the message from OPEC+ over the weekend is to a large degree a rebound along the curve rather than much strengthening at the front-end of the curve. That part of the curve structure is almost as weak as it was last Thursday.
We are still on a weakening path. The message from OPEC+ over the weekend was we are still on a weakening path with rising supply from the group. It is just not as rapidly weakening as was feared ahead of the weekend when a quota hike of 500 kb/d/mth for November was discussed.
The Brent curve is on its way to full contango with Brent dipping into the $50ies/b. Thus the ongoing weakening we have had in the crude curve since the start of the year, and especially since early June, will continue until the Brent crude oil forward curve is in full contango along with visibly rising US and OECD oil inventories. The front-month Brent contract will then flip down towards the $60/b-line and below into the $50ies/b.
At what point will OPEC+ turn to cuts? The big question then becomes: When will OPEC+ turn around to make some cuts? At what (price) point will they choose to stabilize the market? Because for sure they will. Higher oil inventories, some more shedding of drilling rigs in US shale and Brent into the 50ies somewhere is probably where the group will step in.
There is nothing we have seen from the group so far which indicates that they will close their eyes, let the world drown in oil and the oil price crash to $40/b or below.
The message from OPEC+ is also about balance and stability. The world won’t drown in oil in 2026. The message from the group as far as we manage to interpret it is twofold: 1) Taking back market share which requires a lower price for non-OPEC+ to back off a bit, and 2) Oil market stability and balance. It is not just about 1. Thus fretting about how we are all going to drown in oil in 2026 is totally off the mark by just focusing on point 1.
When to buy cal 2026? Before Christmas when Brent hits $55/b and before OPEC+ holds its last meeting of the year which is likely to be in early December.
Brent crude oil prices have rebounded a bit along the forward curve. Not much strengthening in the structure of the curve. The front-end backwardation is not much stronger today than on its weakest level so far this year which was on Thursday last week.

The front-end backwardation fell to its weakest level so far this year on Thursday last week. A slight pickup yesterday and today, but still very close to the weakest year to date. More oil from OPEC+ in the coming months and softer demand and rising inventories. We are heading for yet softer levels.

Down to the lowest since early May. Brent crude has fallen sharply the latest four days. It closed at USD 64.11/b yesterday which is the lowest since early May. It is staging a 1.3% rebound this morning along with gains in both equities and industrial metals with an added touch of support from a softer USD on top.
What stands out the most to us this week is the collapse in the Dubai one to three months time-spread.
Dubai is medium sour crude. OPEC+ is in general medium sour crude production. Asian refineries are predominantly designed to process medium sour crude. So Dubai is the real measure of the balance between OPEC+ holding back or not versus Asian oil demand for consumption and stock building.
A sharp weakening of the front-end of the Dubai curve. The front-end of the Dubai crude curve has been holding out very solidly throughout this summer while the front-end of the Brent and WTI curves have been steadily softening. But the strength in the Dubai curve in our view was carrying the crude oil market in general. A source of strength in the crude oil market. The core of the strength.
The now finally sharp decline of the front-end of the Dubai crude curve is thus a strong shift. Weakness in the Dubai crude marker is weakness in the core of the oil market. The core which has helped to hold the oil market elevated.
Facts supports the weakening. Add in facts of Iraq lifting production from Kurdistan through Turkey. Saudi Arabia lifting production to 10 mb/d in September (normal production level) and lifting exports as well as domestic demand for oil for power for air con is fading along with summer heat. Add also in counter seasonal rise in US crude and product stocks last week. US oil stocks usually decline by 1.3 mb/week this time of year. Last week they instead rose 6.4 mb/week (+7.2 mb if including SPR). Total US commercial oil stocks are now only 2.1 mb below the 2015-19 seasonal average. US oil stocks normally decline from now to Christmas. If they instead continue to rise, then it will be strongly counter seasonal rise and will create a very strong bearish pressure on oil prices.
Will OPEC+ lift its voluntary quotas by zero, 137 kb/d, 500 kb/d or 1.5 mb/d? On Sunday of course OPEC+ will decide on how much to unwind of the remaining 1.5 mb/d of voluntary quotas for November. Will it be 137 kb/d yet again as for October? Will it be 500 kb/d as was talked about earlier this week? Or will it be a full unwind in one go of 1.5 mb/d? We think most likely now it will be at least 500 kb/d and possibly a full unwind. We discussed this in a not earlier this week: ”500 kb/d of voluntary quotas in October. But a full unwind of 1.5 mb/d”
The strength in the front-end of the Dubai curve held out through summer while Brent and WTI curve structures weakened steadily. That core strength helped to keep flat crude oil prices elevated close to the 70-line. Now also the Dubai curve has given in.

Brent crude oil forward curves

Total US commercial stocks now close to normal. Counter seasonal rise last week. Rest of year?

Total US crude and product stocks on a steady trend higher.

Analys
OPEC+ will likely unwind 500 kb/d of voluntary quotas in October. But a full unwind of 1.5 mb/d in one go could be in the cards
Down to mid-60ies as Iraq lifts production while Saudi may be tired of voluntary cut frugality. The Brent December contract dropped 1.6% yesterday to USD 66.03/b. This morning it is down another 0.3% to USD 65.8/b. The drop in the price came on the back of the combined news that Iraq has resumed 190 kb/d of production in Kurdistan with exports through Turkey while OPEC+ delegates send signals that the group will unwind the remaining 1.65 mb/d (less the 137 kb/d in October) of voluntary cuts at a pace of 500 kb/d per month pace.
Signals of accelerated unwind and Iraqi increase may be connected. Russia, Kazakhstan and Iraq were main offenders versus the voluntary quotas they had agreed to follow. Russia had a production ’debt’ (cumulative overproduction versus quota) of close to 90 mb in March this year while Kazakhstan had a ’debt’ of about 60 mb and the same for Iraq. This apparently made Saudi Arabia angry this spring. Why should Saudi Arabia hold back if the other voluntary cutters were just freeriding? Thus the sudden rapid unwinding of voluntary cuts. That is at least one angle of explanations for the accelerated unwinding.
If the offenders with production debts then refrained from lifting production as the voluntary cuts were rapidly unwinded, then they could ’pay back’ their ’debts’ as they would under-produce versus the new and steadily higher quotas.
Forget about Kazakhstan. Its production was just too far above the quotas with no hope that the country would hold back production due to cross-ownership of oil assets by international oil companies. But Russia and Iraq should be able to do it.
Iraqi cumulative overproduction versus quotas could reach 85-90 mb in October. Iraq has however steadily continued to overproduce by 3-5 mb per month. In July its new and gradually higher quota came close to equal with a cumulative overproduction of only 0.6 mb that month. In August again however its production had an overshoot of 100 kb/d or 3.1 mb for the month. Its cumulative production debt had then risen to close to 80 mb. We don’t know for September yet. But looking at October we now know that its production will likely average close to 4.5 mb/d due to the revival of 190 kb/d of production in Kurdistan. Its quota however will only be 4.24 mb/d. Its overproduction in October will thus likely be around 250 kb/d above its quota with its production debt rising another 7-8 mb to a total of close to 90 mb.
Again, why should Saudi Arabia be frugal while Iraq is freeriding. Better to get rid of the voluntary quotas as quickly as possible and then start all over with clean sheets.
Unwinding the remaining 1.513 mb/d in one go in October? If OPEC+ unwinds the remaining 1.513 mb/d of voluntary cuts in one big go in October, then Iraq’s quota will be around 4.4 mb/d for October versus its likely production of close to 4.5 mb/d for the coming month..
OPEC+ should thus unwind the remaining 1.513 mb/d (1.65 – 0.137 mb/d) in one go for October in order for the quota of Iraq to be able to keep track with Iraq’s actual production increase.
October 5 will show how it plays out. But a quota unwind of at least 500 kb/d for Oct seems likely. An overall increase of at least 500 kb/d in the voluntary quota for October looks likely. But it could be the whole 1.513 mb/d in one go. If the increase in the quota is ’only’ 500 kb/d then Iraqi cumulative production will still rise by 5.7 mb to a total of 85 mb in October.
Iraqi production debt versus quotas will likely rise by 5.7 mb in October if OPEC+ only lifts the overall quota by 500 kb/d in October. Here assuming historical production debt did not rise in September. That Iraq lifts its production by 190 kb/d in October to 4.47 mb/d (August level + 190 kb/d) and that OPEC+ unwinds 500 kb/d of the remining quotas in October when they decide on this on 5 October.


Oljepriset faller efter ny handelskonflikt mellan USA och Kina

Christian Kopfer kommenterar guld, koppar, olja och stål, samt några råvarubolag

Silver spränger den magiska gränsen, kostar nu över 50 USD per uns

Blykalla, Evroc och Studsvik vill bygga kärnkraftsdrivna datacenter i Sverige

Toppmöte om framtidens kärnkraft runt Östersjön hölls idag

Mahvie Minerals i en guldtrend
Volatile but going nowhere. Brent crude circles USD 66 as market weighs surplus vs risk

Aktier i guldbolag laggar priset på guld

Kinas elproduktion slog nytt rekord i augusti, vilket även kolkraft gjorde

Tyskland har så höga elpriser att företag inte har råd att använda elektricitet
-
 Nyheter4 veckor sedan
Mahvie Minerals i en guldtrend
-
Analys4 veckor sedan
Volatile but going nowhere. Brent crude circles USD 66 as market weighs surplus vs risk
-
 Nyheter4 veckor sedan
Aktier i guldbolag laggar priset på guld
-
 Nyheter4 veckor sedan
Kinas elproduktion slog nytt rekord i augusti, vilket även kolkraft gjorde
-
Nyheter4 veckor sedan
Tyskland har så höga elpriser att företag inte har råd att använda elektricitet
-

 Nyheter4 veckor sedan
Guld når sin högsta nivå någonsin, nu även justerat för inflation
-

 Nyheter4 veckor sedan
Det stigande guldpriset en utmaning för smyckesköpare
-

 Nyheter3 veckor sedan
Ett samtal om guld, olja, fjärrvärme och förnybar energi