

Analys
SEB Jordbruksprodukter, 13 oktober 2014


 Det skedde en allmän återhämtning i priserna för spannmål och oljeväxter förra veckan. Sojamjöl, majs och vete steg med mellan tre och fyra procent. Både FAO / AMIS och USDA publicerade sina månadsvisa uppdateringar av sina estimat för produktion, konsumtion och utgående lager. Det var lite blandad kompott. Man kan tolka WASDE-rapporten som positiv för Chicagovete, men negativ för Matif. För majs var det negativt, men priset är så lågt att man måste börja ta hänsyn till hur populärt det kommer att vara att så majs nästa år och vilka konsekvenser det kan få på utbudet. För sojabönor var det en negativ rapport också, även om utgående lager i USA sjunker. Globala lager är på den högsta nivån sedan åtminstone 1961.
Även CONAB levererade estimat för Brasiliens kommande odlingssäsong och det var ytterligare en GASC.
Tysk ekonomisk statistik fortsätter att utvecklas svagt. Förra veckan var det IFO:s affärsklimatindex och den här veckan svag export. IMF sänkte utsikterna för global tillväxt i veckan. Eurozonen går mot recession.
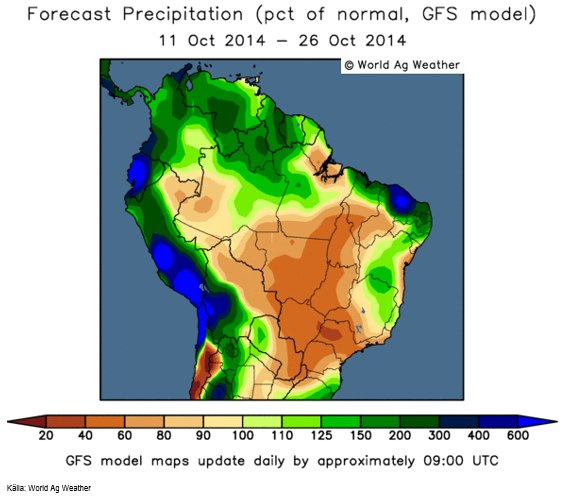
Odlingsväder
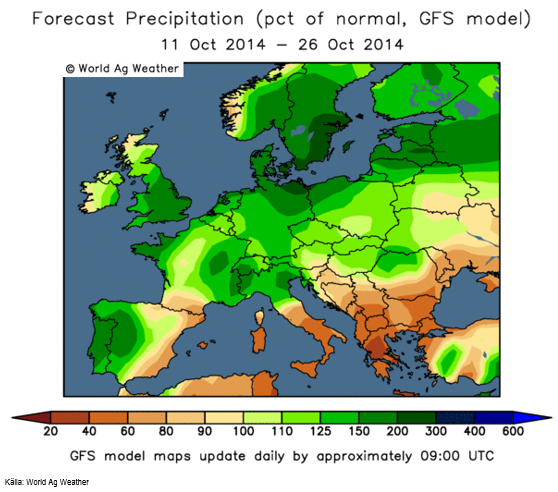
Det extra nederbördsrika vädret över Europa väntas fortsätta i två veckor till. Som vi ser får nu även östra Europa mer nederbörd än normalt.
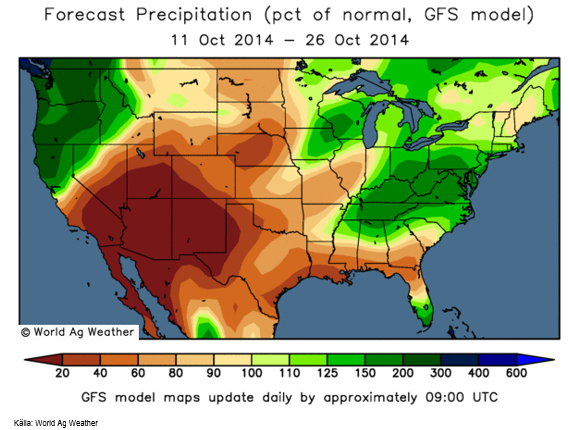
Prognoskartan för nederbörden i USA visar torrt väder i ’corn belt’ och blötare typiska veteodlingsområden som Kansas och Oklaholma.
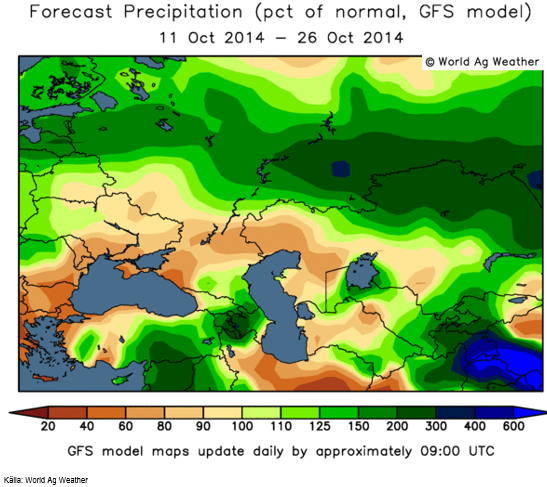
Förra veckans extremt torra prognos för Ryssland, Vitryssland, Ukraina och västra Svarta Havskusten ser nu ut att få mer nederbörd.
I Brasilien har den extremt torra prognosen fått ge vika för mer normal nederbörd. Minas Gerais norra delar väntas få något över normal nederbörd. Mato Grosso, den stora sojaprocenten, väntas få 60-80% av normal nederbörd, vilket är väsentligt bättre än 0 – 40%, som förra veckans prognoskarta sade.
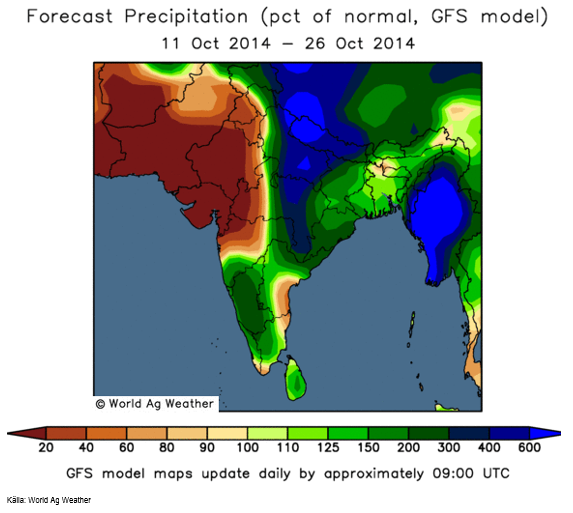
Indiens monsun fortsätter att vara mindre intensiv än normalt. Särskilt besvärande måste det vara i nordvästra Indien, som sett likadant ut i över en månad.
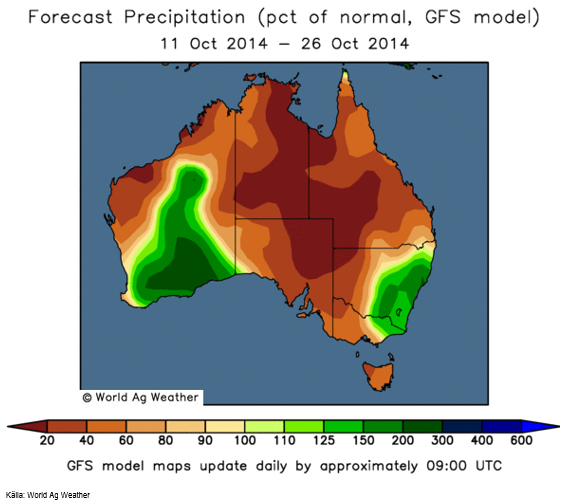
Australien som förra veckan väntades få nederbörd endast i South West, får nu regn inte bara där, utan även i sydvästra delen av landet.
Vete
Vetepriset (novmeberterminen på Matif) steg i fredags på WASDE-rapporten. Den tolkades initialt som positiv, men detta vände sedan under kvällen till negativt, efter att Matif stängt.
Socomac-silon fylldes också upp i veckan, och nu är alltså både Senalia och Socomac fyllda och tar inte emot leveranser. Dessa är leveranspunkter för terminerna på Matif-vete. Hur det kommer att gå att stänga novemberkontraktet på Matif när det finns ett stort incitament att leverera ut vete i och med stängningen, vet ingen. Vi tror det är säkrast att man tar sig ur Matif:s novemberkontrakt i god tid innan leverans.
Det ryska jordbruksdepartementet rapporterade i veckan att mer än 100 mt spannmål har skördats, med 10% av åkerarealen kvar att skörda. De rapporterade också att 78% av höstsådden är klar på 12.9 mHa jämfört med 8.7 mHa förra året. Sådden sker dock i ganska torr jord.
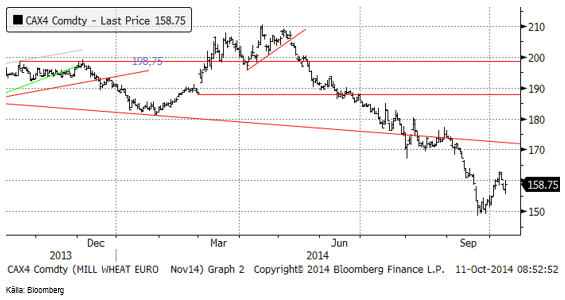
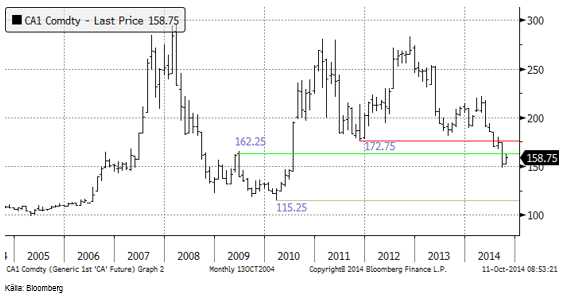
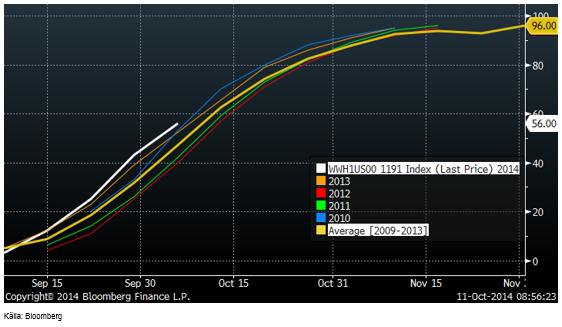
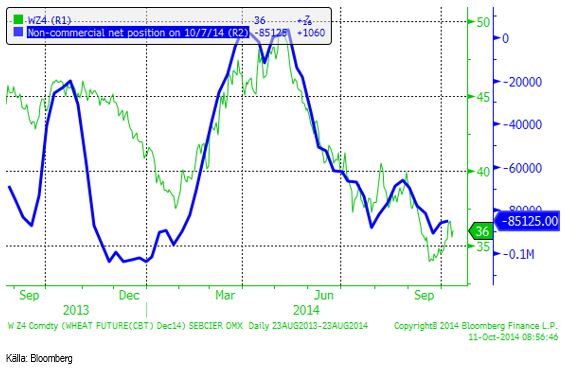
I nedanstående diagram ser vi hur Matifs ”spotkontrakt” utvecklat sig de senaste tio åren. Priset är på en nivå som tidigare varit bottennivåer. Därmed ska man inte utgå från att priset vänder upp från den här nivån genast. Tidigare har priset stannat på en låg nivå i flera månader, innan det vänt upp igen.
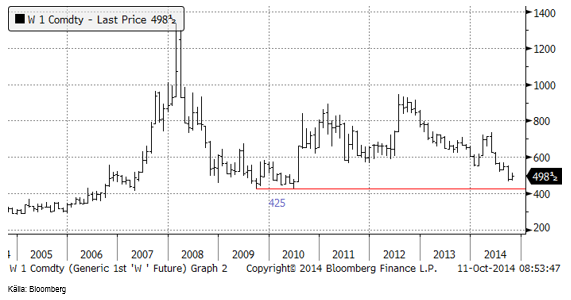
Chicagovetet (december) har en liten bit kvar på nedsidan innan marknaden rör vid ett starkt stöd.
Nedan ser vi terminskurvorna i fredags och en vecka tidigare för Matif respektive Chicago. Det är contango på båda marknader.
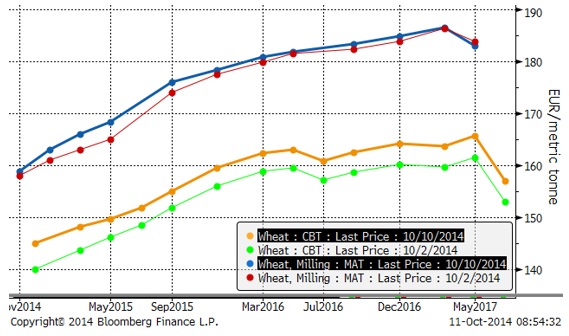
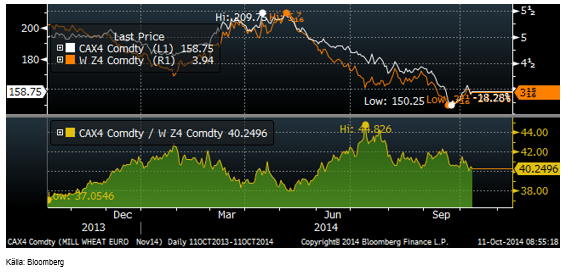
Matifs novemberkontrakt håller sig i samma relation som tidigare till Chicagos decemberkontrakt.
Sådden av höstvete har avancerat från 43% färdigt förra veckan till 56% den här veckan.
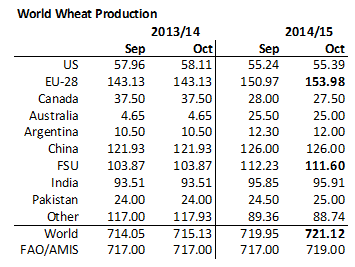
FAO, som rapporterade i torsdags, dagen innan USDA:s WASDE-rapport, höjde det globala produktionsestimatet för 2014/15 till rekordhöga 719 mt. Detta beror på att FAO höjer produktionsestimaten för Kina, Indien, Ryssland och Ukraina.
Även USDA höjde produktionsestimatet på global basis till en rekordnivå, 721.12 mt (från 719.95). Medan skörden i USA lämnades nästan oförändrad på 55.39 mt, höjdes skördeestimatet för EU-28 med 3 mt till 153.98 mt. För fd Sovjetunionen sänktes dock skördeestimatet med 0.6 mt till 111.60 mt, med hänvisning till torkan.
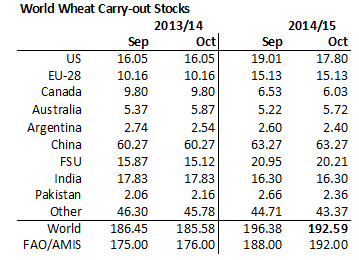
FAO tänker sig en konsumtionstillväxt på 1.8% på årsbasis, huvudsakligen baserad på högre foderefterfrågan efter två år av lägre foderefterfrågan. FAO höjer trots detta utgående lager. De baserar detta dels på höjningen av produktionen, men också på att man tror att utgående lager 2013/14 var högre än man trott tidigare. FAO höjer alltså utgående lager med 4 mt.
USDA gick i fredagens rapport åt andra hållet och sänkte sitt estimat för utgående lager på global basis med nästan 4 mt från 196.38 mt till 192.59 mt. Den största sänkningen gjordes för USA. Eftersom Chicagobörsen ligger i USA är detta ”bullish” för Chicagovetet.
För Matif kan noteras att USDA lämnar utgående lager oförändrat på 15.13 mt. Den högre skörden i EU väntas öka exporten från 24 mt till 26 mt. Det låter sig knappast göras om inte priset är konkurrenskraftigt. USDA-rapporten kan därför tolkas som något ”bearish” för Matifvetet.
Det var en GASC-tender den 10 oktober. Den togs hem av 2 x 60 kt franskt vete till 243 dollar per ton (C&F) och en last ryskt på 55 kt till 249 dollar per ton (C&F). Dessa priser var ett par dollar högre än den förra tendern den 1 oktober när frankrike vann 2 x 60 kt till 241 dollar genom att kraftigt sänka priset. Det lägsta budet exklusive frakt i fredags låg på 226 dollar / ton, vilket blir 179 euro per ton. GASC var erbjudna ryskt, rumänskt och franskt vete.
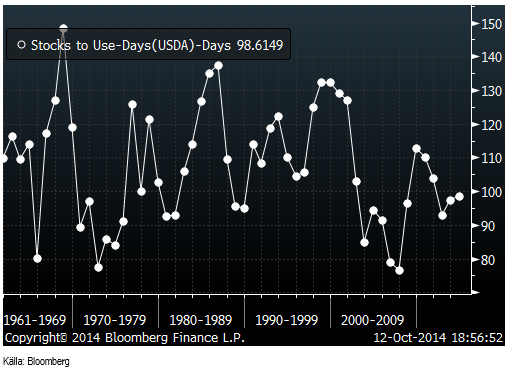
Globala lager som räcker i 98 dagar efter 2014/15 års slut är väsentligt högre än de under 80 dagar som rådde under slutet av 00-talet och som drev priset uppåt.
Non-commercials i CFTC:s rapport verkar ha passerat den mest korta positionen. I den senaste rapporten hade de köpt tillbaka en del av den korta positionen.
Det börjar utveckla sig till köpläge i vete. Det finns antagligen utrymme för en liten nedgång på kort sikt, men på längre sikt finns en klar uppsidespotential.
Majs
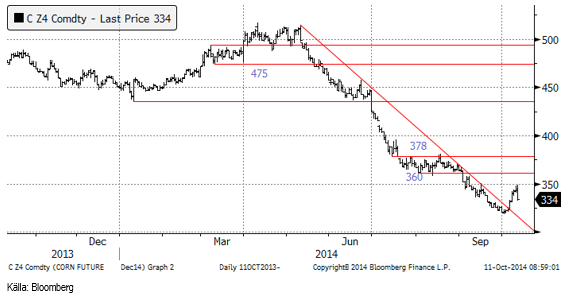
Decemberkontraktet CZ4 tog sig upp till 350 cent, men föll kraftigt ner från 350 cent till 334 efter WASDE-rapporten.
Crop condition låg oförändrat på höga 74% good/excellent i måndags.
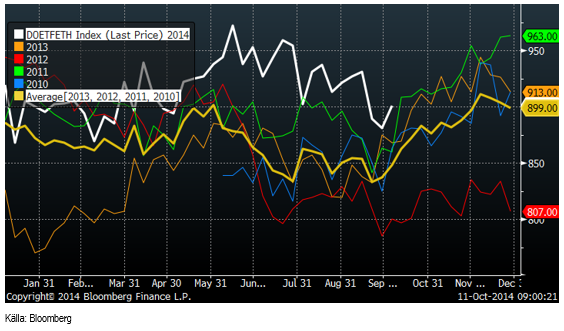
DOE rapporterade i veckan som gick att etanolproduktionen i USA steg, vilket vi skrev redan förra veckan att den säsongsmässigt borde göra i den här veckans rapport, eller i nästa veckas rapport.
FAO höjde produktionsestimatet på global basis med 10 mt (!) till den nya rekordnivån 1018 mt. FAO höjer framförallt förväntningarna på produktionen i USA. USDA höjde även de produktionsestimatet för USA, men med 2 mt och på global basis med 3 mt till rekordnivån 990.69 mt. För USA höjdes yielden till 174.2 bushels per acre, vilket är i linje med vad vi påpekat tidigare. 174.2 är förmodligen för lågt ändå och kan komma att höjas. Skördad areal sänktes samtidigt av USDA från 83.8 miljoner acre till 83.1 miljoner.
USDA höjde även produktionsestimatet för EU-28 med nästan 3 mt, men sänkte fd Sovjetstaternas produktion med 2 mt till 40.66 mt. Det är huvudsakligen Ukraina som producerar majs av dessa länder.
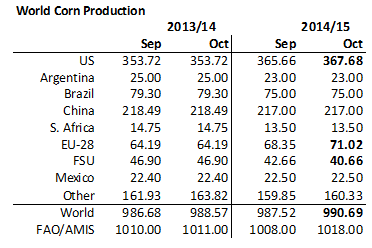
CONAB levererade sitt första estimat för Brasiliens kommande produktion av majs och angav den till 76.6-78.9 mt. USDA som ligger på 75 mt, ligger alltså lågt i förhållande till CONAB.
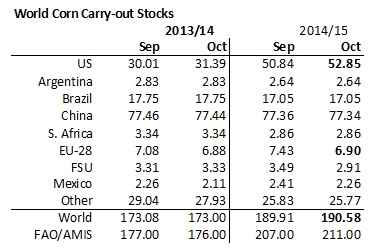
FAO räknar med att konsumtionen av majs ökar med 2.7% på årsbasis, med den största delen av konsumtionsökningen i Kina, Brasilien, EU och USA. FAO, som justerat upp produktionen med 10 mt, tänker sig att utgående lager ökar med 4 mt till 211 mt.
USDA höjde utgående lager med inte fullt 1 mt, men den största ökningen väntas ske i USA med +2 mt till 52.85 mt. Eftersom Chicagobörsen ligger i USA var detta ”bearish” för terminspriset där. Lagren väntas minska i EU-28 från 7.43 mt som man trodde för en månad sedan till 6.90 mt nu.
December 2014 – kontraktet på majs i Chicago handlas på 334 cent. Nästa års skörd, CZ5, handlas på 381.75 cent. Vi vet att hälften av lantbrukarna i USA har en kostnad på 400 cent per bushel och då är nästa års terminspris i lägsta laget för att man inte ska förvänta sig väsentligt lägre areal nästa år. Man ska komma ihåg att 334 cent för årets skörd avser majs som befinner sig i en silo, redo att lastas på fartyg. ”Farmgate-” priset är lägre. Det har talats om priser ner mot 200 cent på en del ställen.
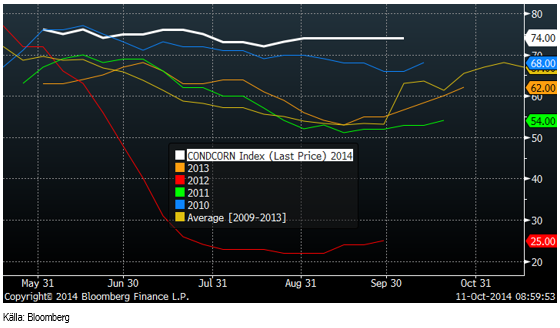
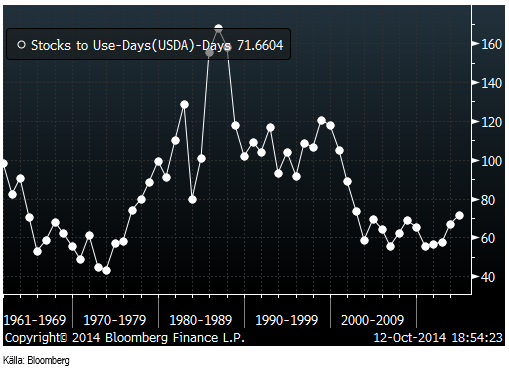
Globala lager i förhållande till konsumtion är helt tydligt på väg uppåt, som vi ser av diagrammet nedan.
Non-commercials köpte ytterligare några kontrakt i veckan.
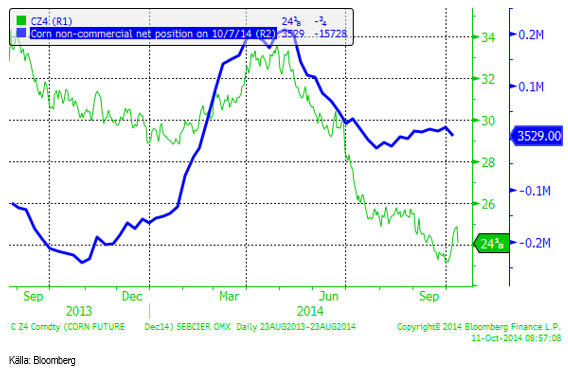
Vi vänder alltså till köprekommendation.
Sojabönor
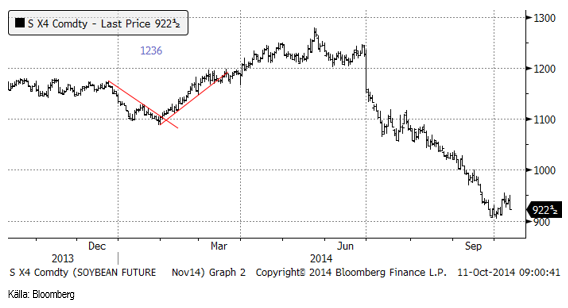
Sojabönorna (SX4) som vid månadsskiftet fick stöd vid 900 cent, rekylerade först upp tidigt förra veckan, men föll sedan rätt kraftigt efter USDA:s WASDE-rapport för oktober. Verkligheten gjorde sig påmind.
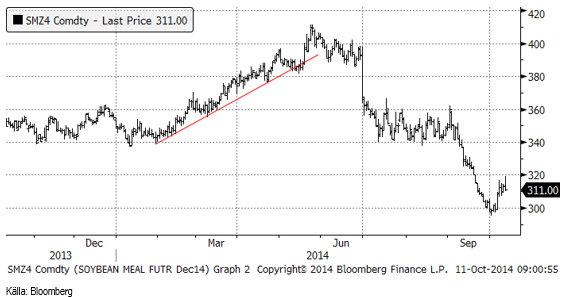
Sojamjölet steg upp till 320, men föll tillbaka efter WASDE-rapporten och stängde på 311 dollar för decemberleverans.
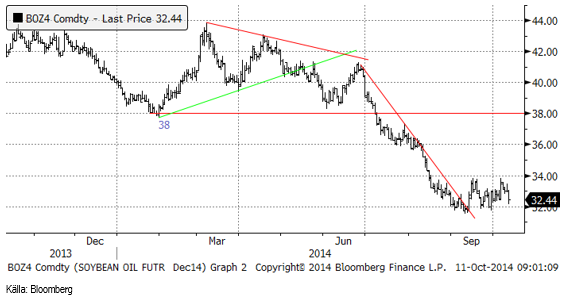
Sojaoljan föll mycket kraftigt efter WASDE-rapporten och ligger nu bara 44 cent över det tekniska stödet vid 32 dollar.
Crop condition för sojabönor steg återigen upp till 72% good / excellent.
FAO höjer det globala produktionsestimatet +3mt till 309 mt, beroende på ljusare utsikter för USA och Brasilien.
USDA lämnar globalt produktionsestimat nästan oförändrat på 211.20 mt. Den enda justering de gör är en marginell uppjustering av skörden i USA från 106.50 till 106.87 mt, vilket beror på en höjning av yielden från 46.6 bu/acre till 47.1 och en samtidig sänkning av skördad areal med 500,000 acre från 84.1 mAr till 83.4. Förmodligen kommer arealen inte att justeras ner igen, men det är troligt att yielden höjs. Crop condition höjdes i veckan och ligger på smått fantastiska 73% good/excellent.
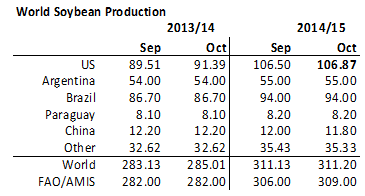
CONAB:s första estimat för den kommande skörden är 88.83-92.41 mt. USDA:s estimat för Brasilien på 94 mt är alltså lite för högt. CONAB estimerar att exporten 2014/15 blir 48.50 mt jämfört med 46.57 mt under 2013/14.
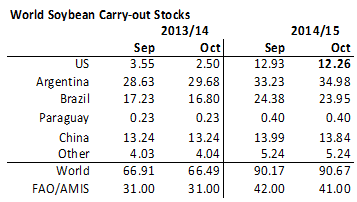
FAO räknar med att global konsumtion ökar med 7-8% på årsbasis, väsentligt högre än de 5% årlig tillväxt de hade för 2013/14. De ser en stark efterfrågan på både sojaolja och sojamjöl. FAO sänker därför utgående lager med 1 mt från september till oktober till 41 mt. Detta är ändå 10 mt högre utgående lager än FAO såg för 2013/14.
USDA sänker utgående lager för USA från 12.93 mt till 12.26 mt, vilket alltså är bullish för terminerna som handlas i USA. De gör en liten höjning, marginell, av utgående lager på global basis till 90.67 mt (upp från 90.17 i september). Den stora höjningen av utgående lager väntas ske i Argentina med +1.75 mt till 34.98 mt, och så som landet ser ut, är detta material ganska avskärmat från resten av världens utbuds/efterfrågebalans. Häri finns också en händelserisk. Om Argentina skulle öppnas på vid gavel för export skulle utbudet på global basis öka kraftigt och därmed pressa priset. I status quo väntas som vi ser exporten minska, vilket innebär att den globala balansen blir mindre, dvs vi tänker oss att lagerökningen för Argentina räknas bort från globala lager. Då har vi en lagerminskning på nedersta raden, alltså en ”bullish” rapport från USDA, inte bara för USA, där börsen befinner sig, utan även på global basis.
Det finns allts vissa positiva drag hos den här WASDE-rapporten, men det handlar trots allt om en ökning av utgående lager från september. Marknaden tolkade detta som negativt och det handlar om en lagerökning på 24 mt från förra året, som befästs, vilket också är helt påtaglig. Ett lågt majspris lär dessutom stimulera ett byte av gröda från majs och i stor utsträckning blir det säkert sojabönor istället. Det finns nog en del nedsidesrisk i priset på oljeväxter än.
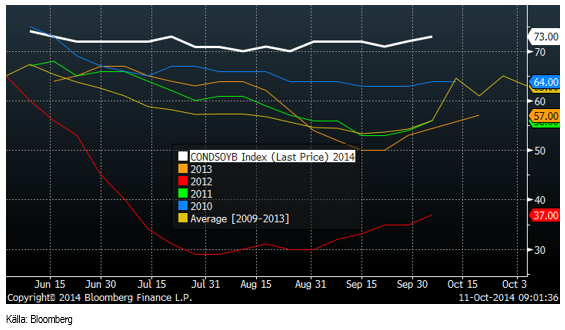
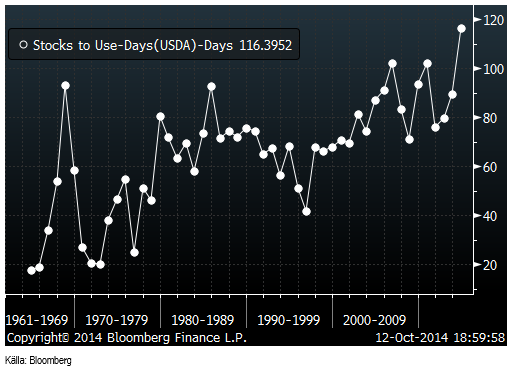
Globala lager räcker till näsan 120 dagars konsumtion. Det är väsentligt högre än de ca 80 dagar som det var för ett par år sedan. Lager i termer av konsumtion är på global basis på den högsta nivån sedan 1961. Det perspektivet är knappast ”bullish” på lite längre sikt.
Non-commmercials köpte 7800 kontrakt i veckan och är nu nettosålda 71,000 kontrakt.
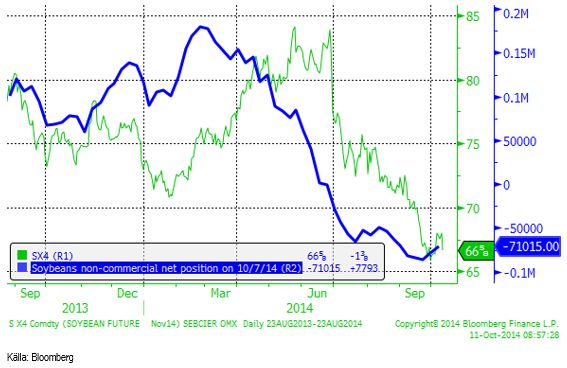
Vi vänder efter WASDE-rapporten till säljrekommendation igen.
Raps
Novemberkontraktet för rapsfrö fortsatte sin rekyl i början av veckan och priset steg från 325 euro till nästan335. Sedan föll priset snabbt och stängde på 324 euro, alltså en nedgång med 1 euro på en vecka.
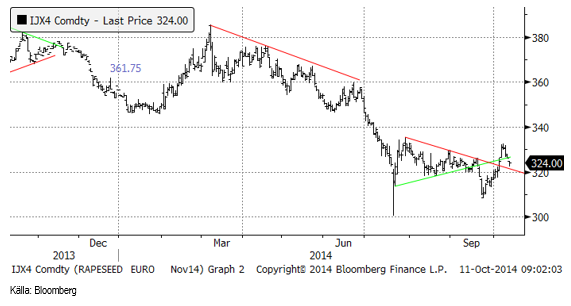
Vi fortsätter med säljrekommendation på rapsterminer.
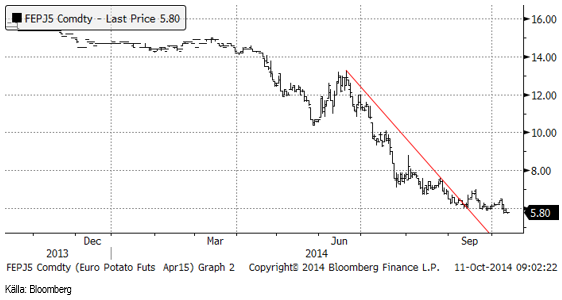
Potatis
Potatispriset föll under 6 euro per 100 Kg i veckan, men inte med någon större kraft. Marknaden stängde på 5.80 i fredags på april-kontraktet.
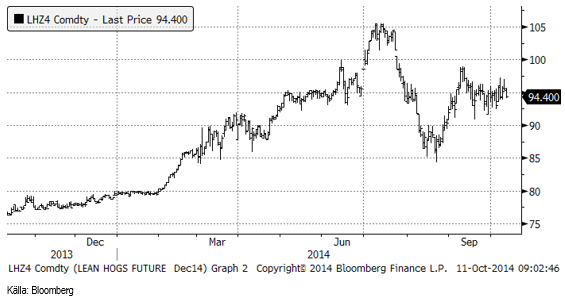
Gris
Lean hogs decemberkontrakt ligger kvar kring 95 cent per pund där priset legat den senaste månaden.
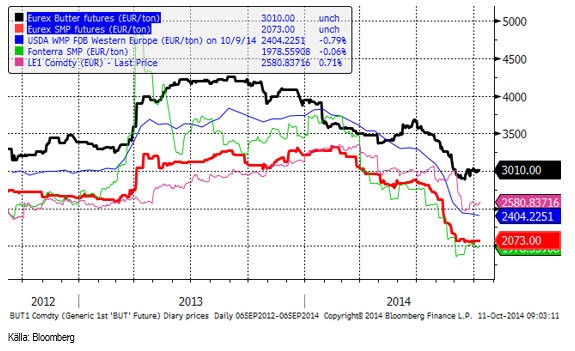
Mjölk
Terminerna på smör och SMP ligger kvar på samma nivå som de senaste två veckorna. Prisfallet verkar ha ebbat ut.
Socker
Prognosen om blötare väder i Brasilien fick rekylen uppåt efter sensommarens stora prisfall, att vända nedåt mot slutet av veckan. Fredagens stängningspris är dock nästan precis på ett det tekniska stödet vid 16.60 cent.
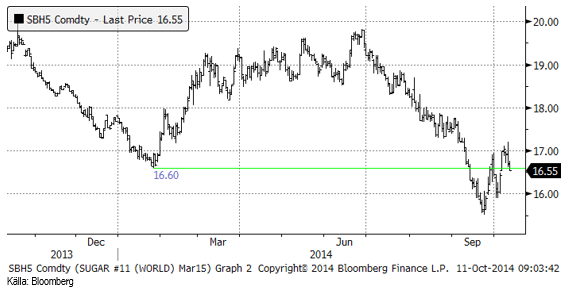
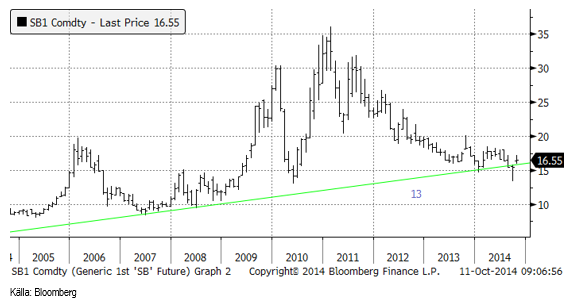
Nedan ser i prisutvecklingen för spotkontraktet de senaste tio åren. Sedan förra veckan har priset stigit måttligt från 16.40 till 16.55.
[box]SEB Veckobrev Jordbruksprodukter är producerat av SEB Commodities Sales desk och publiceras i samarbete och med tillstånd på Råvarumarknaden.se[/box]
Detta marknadsföringsmaterial, framtaget av SEB’s Commodities Sales desk, har upprättats enbart i informationssyfte.
Även om innehållet är baserat på källor som SEB bedömt som tillförlitliga ansvarar SEB inte för fel eller brister i informationen. Den utgör inte oberoende, objektiv investeringsanalys och skyddas därför inte av de bestämmelser som SEB har infört för att förebygga potentiella intressekonflikter. Yttranden från SEB’s Commodities Sales desk kan vara oförenliga med tidigare publicerat material från SEB, då den senare hänvisas uppmanas du att läsa den fullständiga rapporten innan någon åtgärd vidtas.
Dokumentationen utgör inte någon investeringsrådgivning och tillhandahålls till dig utan hänsyn till dina investeringsmål. Du uppmanas att självständigt bedöma och komplettera uppgifterna i denna dokumentation och att basera dina investeringsbeslut på material som bedöms erforderligt. Alla framåtblickande uttalanden, åsikter och förväntningar är föremål för risker, osäkerheter och andra faktorer och kan orsaka att det faktiska resultatet avviker väsentligt från det förväntade. Historisk avkastning är ingen garanti för framtida resultat. Detta dokument utgör inte ett erbjudande att teckna några värdepapper eller andra finansiella instrument. SEB svarar inte för förlust eller skada – direkt eller indirekt, eller av vad slag det vara må – som kan uppkomma till följd av användandet av detta material eller dess innehåll.
Observera att det kan förekomma att SEB, dess ledamöter, dess anställda eller dess moder- och/eller dotterbolag vid olika tillfällen innehar, har innehaft eller kommer att inneha aktier, positioner, rådgivningsuppdrag i samband med corporate finance-transaktioner, investment- eller merchantbankinguppdrag och/eller lån i de bolag/finansiella instrument som nämns i materialet.
Materialet är avsett för mottagaren, all spridning, distribuering mångfaldigande eller annan användning av detta meddelande får inte ske utan SEB:s medgivande. Oaktat detta får SEB tillåta omfördelning av materialet till utvald tredje part i enlighet med gällande avtal. Materialet får inte spridas till fysiska eller juridiska personer som är medborgare eller har hemvist i ett land där sådan spridning är otillåten enligt tillämplig lag eller annan bestämmelse.
Skandinaviska Enskilda Banken AB (publ) är ett [publikt] aktiebolag och står under tillsyn av Finansinspektionen samt de lokala finansiella tillsynsmyndigheter i varje jurisdiktionen där SEB har filial eller dotterbolag.

Brent M1 moving below the 200 dma of $78.7/b. Brent crude continued its move lower yesterday with a decline of 3.3% to $77.9/b. This morning it is adding another drop of 1.4% to $76.8/b. Israel bombing Lebanon during the weekend was a violence of the MoU and Iran was quick to declare the SoH closed again. But the willingness to move forward by both the US and Iran obviously trumped the bombing in Lebanon making the event more of a hiccup on the road of further negotiations.

The US has now waived sanctions against Iranian oil exports for two months allowing Iran to sell its oil all over the world, though sanctions instated in Europe will take more time to unwind. Oil from Iran, Russia as well as Venezuela can for the time being be sold across the world without any sharp discount due to sanctions. Chinese Tea-pot refineries will suffer as they previously could buy rebated crude while selling products at market prices.
Crude oil is no flowing out of the SoH with latest number close to 7 mb/d on a three day moving average. That is still well below the 14 mb/d of crude and 6 mb/d of products normally flowing out of the SoH. Latest estimate is that there is around 80 mb of crude on water inside the Persian Gulf and maybe another 80 mb of oil products on water as well. If crude is exiting the SoH at a rate of around 7 mb/d, then the 80 mb of crude would be depleted within 10-15 days and there after the flow would rely on new crude tankers entering, loading and then exiting the SoH to continue further flows. Given the uncertainties surrounding the status of the SoH with Iran stating that it was closed again as recent as this weekend, there is likely an asymmetry here where ships and oil stranded in the SoH for months are much more eager to exit than new ships are eager to enter.
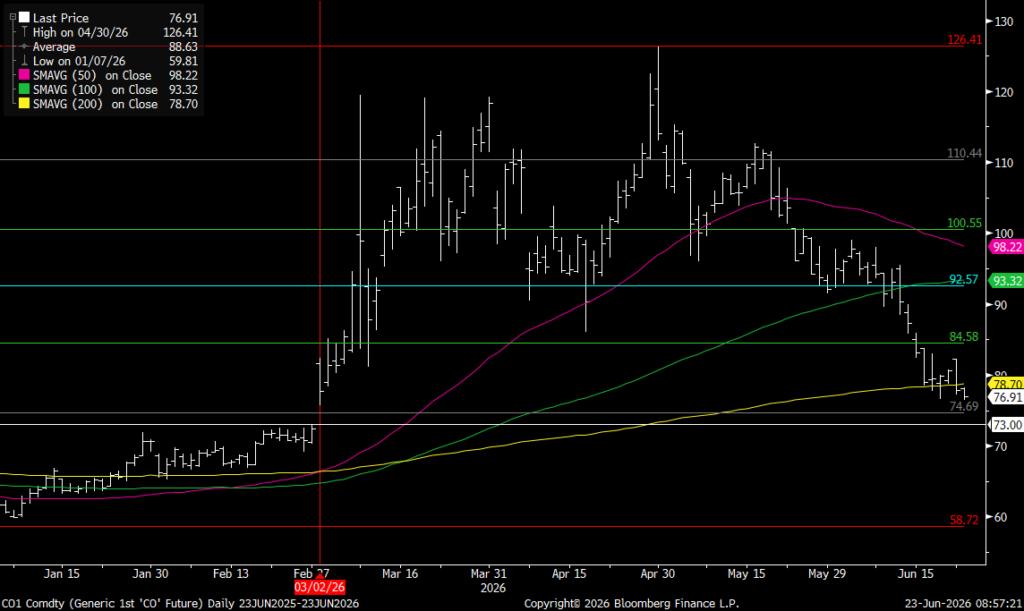
For now Brent crude keeps falling like a rock with the front-end Brent contract now only trading at a premium of $7.6/b above the five year contract. Quickly heading towards parity. The Brent M1 contract has now broken below its 200 dma of $78.7/b and is closing in on the Fibo-level at $74.7/b. Below that there is not much more supporting levels to be found before $73/b which would close the gap from February 3.
Brent crude M1 technical levels
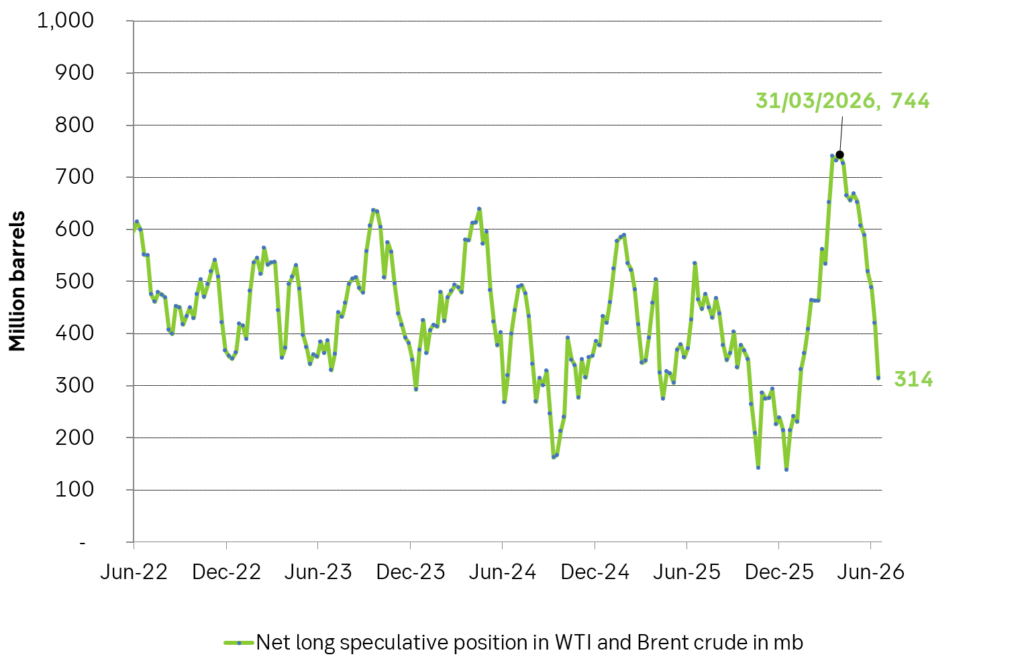
Net long speculative positions are also falling like a rock and as of Tuesday last week the net long positioning in Brent and WTI together summed to 314 million barrels and falling fast.
Will there be a rebound? A possible combination could be an exhaustion of the oil blob caught within the SoH within 1-2 weeks if exits continue at current rate while new ships entering are much more cautious, more Israeli bombardments in Lebanon as Netanyahu fights for re-election, a temporary closure of the SoH again while speculative short positions take cover buying back and covering their positions.
US and Israeli stands versus Iran could harden beyond elections so 2027 surplus is far from given. But Iran and the US are all in all moving towards a set of solutions with both clearly eager to reopen the SoH and keep it open. And that is what the market is pricing along with sharply falling prices. The ongoing discussions will likely take months and last beyond both the upcoming Israeli election (before 27 oct) and the US midterm elections on 3 Nov. Beyond those dates the stance by both Israel and the US may harden again versus Iran. But Iran knows that and is most likely preparing for such a hardening turn. Thus a surplus of oil and global oil stock rebuilding in 2027 (as now is mostly projected) is far from given.
Selling down on a ”deal”. Brent crude fell 6.2% last week with accelerated weakness towards the end of the week. Close of the week at $87.33/b and low of the week (and on Friday) of $85.8/b. Brent is falling another 4% this morning to $83.7/b on confirmation by Iran that a MoU text has been reached and that it will be signed on Friday this week.
So what is this ”deal” worth? Talk on the desk here this morning is that it is much like ”putting lipstick on a pig” where Trump has to sell this at home as a victory where ”the SoH has reopened”, the nuclear issue will be ironed out over the coming 60 days (or maybe 600 days?) and US consumers are getting a lower gasoline price and maybe US republicans survives the midterm elections.
The importance for Iran is that it emerges as the defacto winner of this war in the eyes of the non-US public world. That Iran now onwards is the ”ruler of the SoH” (combo of geography and new weapons systems like drones) or more softer: ”the guarantor of safe passage through the SoH”.
Iran doesn’t need nuclear weapons any more. Nuclear deterrence doesn’t work any more. Ukraine has made many attacks deep into Russia without being nuked in return. Plenty of Iranian ballistic rockets blasts over Israel but Iran wasn’t nuked in return.
There is no trust between the US and Iran. We don’t know all the details yet of the MoU. But what we do know is that there is no trust between the US and Iran what so ever. This is probably more like a descriptive text on how they can cooperate in a way where both sides keeps tactical leverage. Neither side makes irreversible concessions. Violations can be punished quickly. Cooperation produces immediate benefits.
This is a fragile structure. It can easily break down. There may be details which cannot be overcome. To be seen on Friday. The US has to show that it is willing put enough force behind managing and restraining Israel versus Hezbollah in Lebanon. We have seen that Netanyahu hasn’t listened all that much to Trump’s directives and wishes. This could be a major obstacle.
A gradual reopening is tactically preferable for Iran. A tactical leverage for Iran right now is that global oil stocks have been drawn down towards painful and increasingly dangerous levels with increasing risks for oil price spikes in mid-July to August. This together with US midterm elections on 3 November gives tactical leverage to Iran. Iran probably doesn’t want to fully give up on that leverage. A rapid, full reopening where global stocks are able to refill over the coming 60 days will significantly erode that leverage. If Iran reinstates a closure of the SoH after 60 days (if talks break down again), then the effect won’t be that impactful in terms of prices and the US midterm elections.
So a gradual and partial reopening where global markets gets the oil they need while they are unable to rebuild stocks could be a practical middle way for both parties. Trump can sell it as ”the SoH has reopened” and get affordable gasoline for US consumers. Iran can sell it as ”the SoH has fully reopened, but there is some friction” so flow is only 60-80% of normal.
Not much real demand destruction below $100/b. What we do know is that there is not much real price pain demand destruction for oil globally at an oil price below $100/b. A lot of demand-shock destruction. Fear. But demand should now come roaring back towards normal with fear for exceptionally high prices now is rapidly receding.
Sudden China demand destruction due to EVs? Bullocks. EV share of total Chinese carpool now around 13%. Share of new sales of EVs has reached 50%. This is a very gradual process. It doesn’t make oil demand fall like a rock over night. When EV new sales share reaches 100%, then the gasoline car pool will contract by some 5-10% per year. But that is only gasoline. Sudden reduction in Chinese oil demand is more about shock and risk.
Chinese crude oil imports will come roaring back. At what price? Today’s ”neutral” oil price is $70/b. That is the five year price which has steadily traded around the $70/b mark over the past 3-4 years. With still a risky picture one would think that China and the rest of the world will be big buyers of oil in the range of $70-85/b.
Global demand will likely snap back towards normal, forecasted demand and growth at such prices.
Physical reopening is a gradual process. The physical and practical reopening of the SoH will likely be gradual rather than sudden. And that probably suites Iran tactically as well.
Brent M1 price versus the Brent 5-yr (today’s ”normal” price)

Market is starting to take US/Iran headlines with a pinch of salt. Brent crude rose $2.8/b yesterday to an official close of $112.1/b. But after that it traded as low as $108.05/b before ending late night at around $109.7/b. Through the day it traded in a range of $106.87 – 112.72/b amid a flurry of news or rumors from Iran and the US. ”US temporary sanctions during negotiations” (falls alarm). ”We will bomb Iran” (not anyhow),… etc. While the market is still fluctuating to this kind of news flow, it is starting to take such headlines with a pinch of salt.
We’ll see. Maybe, maybe not. The Brent M1 contract is trading at $110.2/b this morning which very close to the average ticks through yesterday of $110.4/b.
Trump with bearish, verbal intervention whenever Brent trades above $110/b it seems. What seems to be a pattern is that Trump states something like ”very good negotiations going on with Iran”, ”New leaders in Iran are great,..”, ”Great progress in negotiations,…”, ”Deal in sight,..” etc whenever the Brent M1 contract trades above $110/b. An effort to cool the market. These hot air verbal interventions from Trump used to have a heavy bearish impact on prices, but they now seems to have less and less effect unless they are backed by reality.
As far as we can see there has been no real progress in the negotiations between the US and Iran with both sides still standing by their previous demands.
Iran is getting stronger while the cease fire lasts making a return to war for Trump yet harder. Iran is naturally in constant preparation for a return to war given Trump’s steady threats of bombing Iran again. Iran is naturally doing what ever is possible to prepare for a return to war. And every day the cease fire lasts it is better prepared. This naturally makes it more and more difficult and dangerous for the US to return to warring activity versus Iran as the consequences for energy infrastructure in the Persian Gulf will be more and more severe the longer the cease fire lasts. Israel seems to see it this way as well. That the war is not won and that current frozen state of a cease fire gives Iran opportunity to rebuild military and politically.
Global inventories are drawing down day by day. How much? In the meantime the Strait of Hormuz stays closed. There is varying measures and estimates of how much global inventories are drawing down. Our rough estimate, back of the envelope, is that global inventories are drawing down by at least some 10 mb/d or about 300 mb/d in a balance between loss of supply versus demand destruction. Other estimates we see are a monthly draw of 250-270 mb/d. The IEA only ’measured’ a draw in global observable stocks of 117 mb in April with oil on water rising 53 mb while on shore stocks fell 170 mb. But global stocks are hard to measure with large invisible, unmeasured stocks. As such a back of the envelope approach may be better.
Oil products is what the world is consuming. Oil product prices likely to rise while product stocks fall. Strategic Petroleum Reserves (SPR) are predominantly crude oil. Discharging oil from OECD SPR stocks, a sharp reduction in Chinese crude imports and a reduction in global refinery throughput of 6-7 mb/d has helped to keep crude oil markets satisfactorily supplied. But global inventories are drawing down none the less. And oil products is really what the world is consuming. So if global refinery throughput stays subdued, then demand will eventually have to match the supply of oil products. The likely path forward this summer is a steady draw down in jet fuel, diesel and gasoline. Higher prices for these. Then, if possible, higher refinery throughput and higher usage of crude in response to very profitable refinery margins. And lastly sharper draw in crude stocks and higher prices for these. But some 6 mb/d of oil products used to be exported through the Strait of Hormuz. And it may not be so easy to ramp up refinery activity across the world to compensate. Especially as Ukraine continues to damage Russian refineries as well as Russian crude production and export facilities.
Watch oil product stocks and prices as well as Brent calendar 2027. What to watch for this summer is thus oil product inventories falling and oil product premiums to crude rising. Another measure to watch is the Brent crude 2027 contract as it rises steadily day by day as the Strait of Hormuz stays closed and global oil inventories decline. The latter is close to the highest level since the start of the war and keeps rising.
The Brent M1 contract and the Brent 2027 prices and current price of jet fuel in Europe (ARA). All in USD/b

Our back of the envelope calculation of the global shortage created by the closure of the Strait of Hormuz. Note that 3.5 mb/d of discharge from SPR is also a draw. Note also that ’Forced demand loss’ of 2.5 mb/d is probably temporary and will fall back towards zero as logistics are sorted out leaving ’Price demand loss’ to do the job of balancing the market. Thus a shortfall of at least 9 mb/d created by the closure. More if SPR discharge is included and more if Forced demand loss recedes.


Brent falling like a rock with oil likely to flow from SoH until at least 3 November

Vattenfalls och Industrikrafts kärnkraftsbolag Videberg Kraft har valt Rolls-Royce SMR
Selling down on a ”deal”

Sommarväder skapar prisrally på elbörsen
Oil product price pain is set to rise as the Strait of Hormuz stays closed into summer
Sommarväder skapar prisrally på elbörsen
Vattenfalls och Industrikrafts kärnkraftsbolag Videberg Kraft har valt Rolls-Royce SMR
Selling down on a ”deal”
Brent falling like a rock with oil likely to flow from SoH until at least 3 November
-
Nyheter3 veckor sedan
Sommarväder skapar prisrally på elbörsen
-
 Nyheter1 vecka sedan
Vattenfalls och Industrikrafts kärnkraftsbolag Videberg Kraft har valt Rolls-Royce SMR
-
Analys1 vecka sedan
Selling down on a ”deal”
-
Analys12 timmar sedan
Brent falling like a rock with oil likely to flow from SoH until at least 3 November