

Analys
A remarkable rebound after an early summer lull

![]() The commodity market has witnessed a remarkable rebound since June. The Handelsbanken commodity index, including futures from all sectors, gained 10 %, which is due to a combination of various risk premiums, a lower USD and further cutbacks in Chinese supply reform. All told, there is a fragile trend of rising prices.
The commodity market has witnessed a remarkable rebound since June. The Handelsbanken commodity index, including futures from all sectors, gained 10 %, which is due to a combination of various risk premiums, a lower USD and further cutbacks in Chinese supply reform. All told, there is a fragile trend of rising prices.
Oil stuck in loop
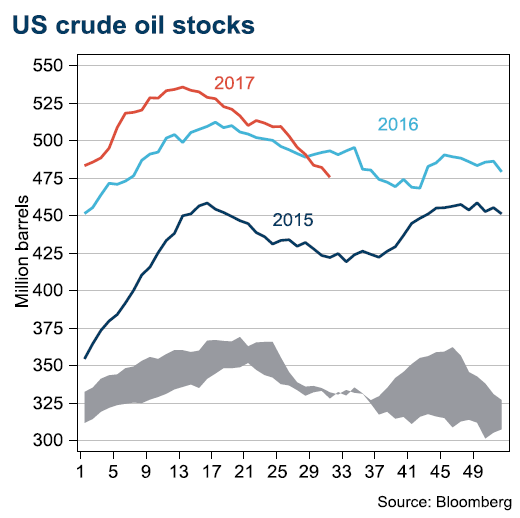
The price of crude oil has not been this uneventful in a long time. Over the past 12 months, the oil price has traded within a tight range, spanning just USD 13/bbl. However, in terms of short-term swings, the summer recovery has been relatively strong, up 15% since the low point in June.
The summer driving season in the US has been surprisingly strong given weaker consumption data during the spring. Consumables used to be a good leading indicator for fuel demand during summer. Yet, this year’s driving season has drawn on stocks, which are now lower than in 2016. However, that does not lead us to change our view of the oil price (USD 40/bbl at the end of 2017), as US oil production continues to increase and driving season demand is of course seasonal.
Venezuela has been the most relevant risk premium for commodity markets during summer. None of the remaining OPEC members are able to compensate for a full-scale breakdown of the Venezuelan oil tap.
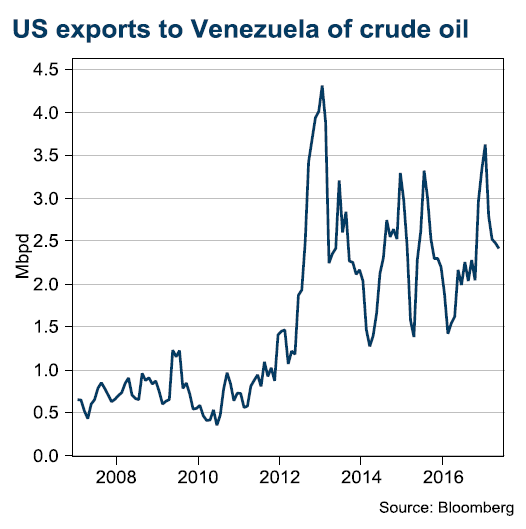
The heavy crude nature of Venezuela’s oil presents a suitable weak point for the Trump administration to exploit. Venezuela needs to import light crude oil to blend with its domestic production to create a saleable product. Hence, there are two main risks for oil prices in Venezuela, with the first being full-scale export sanctions from the US (in our view, imports elsewhere will come at a higher cost, but this problem could be solved). There is plenty of available light crude oil in Western Africa after the US lowered imports in the wake of the shale revolution. The second risk is a default in Venezuela. In such a scenario, we struggle to see oil workers continuing to work if salaries are frozen.
On the other hand, OPEC faces new challenges. Ecuador was the first member to leave the production accord officially and start to increase production and exports to meet its fiscal needs. Iraq followed shortly after, but now regrets this decision after an OPEC summit focusing on fading compliance within the group.
North Korea boosts bullion demand
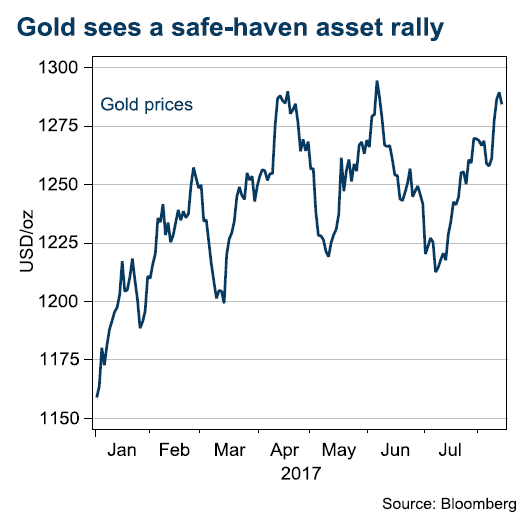 The escalating conflict around the Korean Peninsula affects commodities due to the lower USD and investors shunning risks. However, we believe this is a short-term story. Nevertheless, risk-averse strategies benefit gold. Prices approached USD 1,300 per ounce for the third time this year, fuelled by tougher rhetoric from Trump and North Korea’s improved ability to manufacture nuclear weapons.
China forces cutbacks
Beijing has escalated the cutback campaign of unprofitable commodity production. Coal mining is now halfway to the 2020 target. Other bulk commodities are affected as well, particularly iron ore, which had the greatest price gain of all commodities during the summer, up 40% since June compared to coal’s 20%.
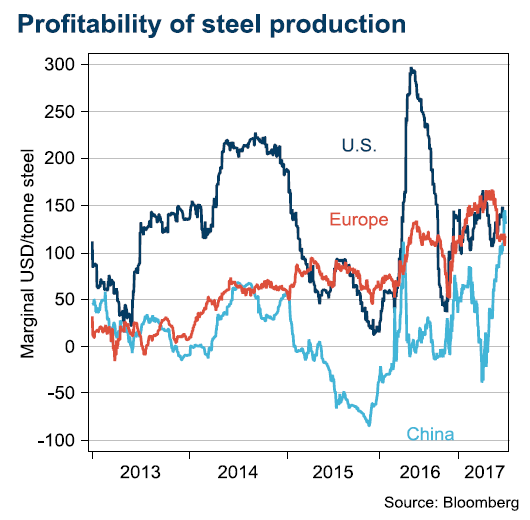 A cutback in domestic iron ore production spills over to freight rates. Capesize ships more than doubled during the past month. Buyers in China are looking to stockpile steelmaking raw materials before a crackdown on production creates a higher need for imports amid seasonally-slower domestic production during the winter months. Freight rates used to be volatile, but sometimes they offer clues about spot demand. They add a piece to our model-based calculation, showing Chinese steel mills have not been better off in terms of profits during the past five years.
Base metals on solid ground
Of the summer gains, we believe base metals stand on the safest ground. However, aluminium has gained from announced cutbacks in China. Yet, in our view, that trend is vaguer than those for steel, iron ore and coal.
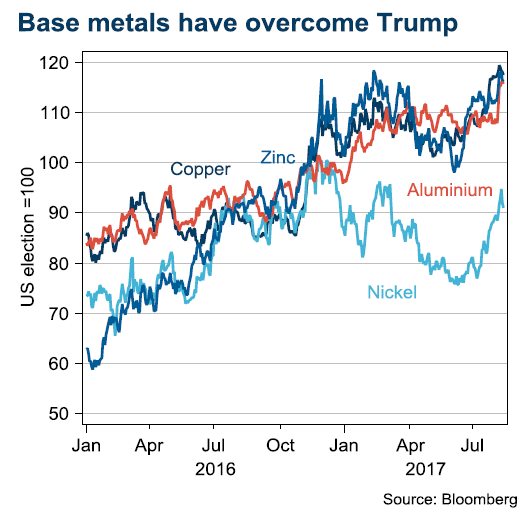 Others are trading high for good reasons, with zinc and copper at an impressive USD 2,900/t and USD 6,400/t respectively. However, this mirrors the current market balance, with mining in a sweet spot among the commodity producers. Nickel is still the laggard among base metals after the Philippines removed the mining closure campaign and miners triumphed against President Duarte’s environmental minister, Lopez. We believe this market will be flooded for a long time.
Research disclaimer
Risk warning
All investments involve risks and investors are encouraged to make their own decision as to the appropriateness of an investment in any securities referred to in this report, based on their specific investment objectives, financial status and risk tolerance. The historical return of a financial instrument is not a guarantee of future return. The value of financial instruments can rise or fall, and it is not certain that you will get back all the capital you have invested.
Research disclaimers
Handelsbanken Capital Markets, a division of Svenska Handelsbanken AB (publ) (collectively referred to herein as ‘SHB’), is responsible for the preparation of research reports. SHB is regulated in Sweden by the Swedish Financial Supervisory Authority, in Norway by the Financial Supervisory Authority of Norway, in Finland by the Financial Supervisory Authority and in Denmark by the Danish Financial Supervisory Authority. All research reports are prepared from trade and statistical services and other information that SHB considers to be reliable. SHB has not independently verified such information and does not represent that such information is true, accurate or complete. Accordingly, to the extent permitted by law, neither SHB, nor any of its directors, officers or employees, nor any other person, accept any liability whatsoever for any loss, however it arises, from any use of such research reports or its contents or otherwise arising in connection therewith.
In no event will SHB or any of its affiliates, their officers, directors or employees be liable to any person for any direct, indirect, special or consequential damages arising out of any use of the information contained in the research reports, including without limitation any lost profits even if SHB is expressly advised of the possibility or likelihood of such damages.
The views contained in SHB research reports are the opinions of employees of SHB and its affiliates and accurately reflect the personal views of the respective analysts at this date and are subject to change. There can be no assurance that future events will be consistent with any such opinions. Each analyst identified in this research report also certifies that the opinions expressed herein and attributed to such analyst accurately reflect his or her individual views about the companies or securities discussed in the research report.
Research reports are prepared by SHB for information purposes only. The information in the research reports does not constitute a personal recommendation or personalised investment advice and such reports or opinions should not be the basis for making investment or strategic decisions. This document does not constitute or form part of any offer for sale or subscription of or solicitation of any offer to buy or subscribe for any securities nor shall it or any part of it form the basis of or be relied on in connection with any contract or commitment whatsoever. Past performance may not be repeated and should not be seen as an indication of future performance. The value of investments and the income from them may go down as well as up and investors may forfeit all principal originally invested. Investors are not guaranteed to make profits on investments and may lose money. Exchange rates may cause the value of overseas investments and the income arising from them to rise or fall. This research product will be updated on a regular basis.
No part of SHB research reports may be reproduced or distributed to any other person without the prior written consent of SHB. The distribution of this document in certain jurisdictions may be restricted by law and persons into whose possession this document comes should inform themselves about, and observe, any such restrictions.
The report does not cover any legal or tax-related aspects pertaining to any of the issuer’s planned or existing debt issuances.


Brent is climbing higher. Front-month is at USD 106.3/bl this morning, close to a weekly high and a USD 9/bl jump from Mondays open. This is the move we flagged as a risk earlier in the week: the market shifting from ”a deal is around the corner” to ”this is going to take longer than we thought”.

Analyst Commodities, SEB
During April, rest-of-year Brent remained remarkably stable around USD 90/bl. A stability which rested on one single assumption: the SoH reopens around 1 May. That assumption is now slowly falling apart.
As we highlighted yesterday: every week of delay beyond 1 May adds (theoretically) ish USD 5/bl to the rest-of-year average, as global inventories draw 100 million barrels per week. i.e., a mid-May reopening implies rest-of-year Brent closer to USD 100/bl, and anything pushing into June or July takes us meaningfully higher.
What’s changed in the last 48 hours:
#1: The US military has formally warned that clearing suspected sea mines from SoH could take up to six months. That is a completely different timescale from what the financial market is pricing. Even a political deal tomorrow does not immediately reopen the strait.
#2: Trump has shifted his tone from urgency to ”strategic patience”. In yesterday’s press conference: ”Don’t rush me… I want a great deal.” The market is reading this as a president no longer feeling pressured by timelines, with the naval blockade running in the background.
#3: So far, the military activity is escalating, not de-escalating. Axios reports Iran is laying more mines in SoH. The US 3rd carrier strike group (USS George H.W. Bush) is arriving with two countermine vessels. Trump yesterday ordered the US Navy to destroy any Iranian boats caught laying mines. While CNN reports that the Pentagon is actively drawing up plans to strike Iranian SoH capabilities and individual Iranian military leaders if the ceasefire collapses. i.e., NOT a attitude consistent with an imminent deal!
Spot crude and product prices eased off the early-April highs on a combination of system rerouting and deal optimism. Both now weakening. Goldman estimates April Gulf output is reduced by 14.5 mbl/d, or 57% of pre-war supply, a number that keeps getting worse the longer this drags on.
Demand-side adaptation is ongoing: S. Korea has cut its Middle East crude dependence from 69% to 56% by pulling more from the Americas and Africa, and Japan is kicking off a second round of SPR releases from 1 May. But SPRs are finite.
Ref. to the negotiations, we should not bet on speed. The current Iranian leadership is dominated by genuine hardliners willing to absorb economic pain and run the clock to extract concessions. That is not a setup for a rapid resolution. US/Israeli media briefings keep framing the delay as ”internal Iranian divisions”, the reality is more complicated and points toward weeks and months, not days.
Our point is that the complexity is large, and higher prices have only just started (given a scenario where the negotiations drag out in time). The market spent April leaning on the USD 90/bl rest-of-year assumption; that case is diminishing by the hour. If ”early May reopening” is replaced by ”June, July or later” over the next week or two, both crude and products have meaningful room to reprice higher from here. There is a high risk being short energy and betting on any immediate political resolution(!).
Down on Friday. Up on Monday. The Brent June crude oil contract traded down 5.1% last week to a close of $90.38/b. It reached a high of $103.87/b last Monday and a low of $86.09/b on Friday as Iran announced that the Strait of Hormuz was fully open for transit. That quickly changed over the weekend as the US upheld its blockade of Iranian oil exports while Iran naturally responded by closing the SoH again. The US blew a hole in the engine room of the Iranian ship TOUSKA and took custody of the ship on Sunday. Brent crude is up 5.6% this morning to $95.4/b.

The cease-fire is expiring tomorrow. The US has said it will send a delegation for a second round of negotiations in Islamabad in Pakistan. But Iran has for now rejected a second round of talks as it views US demands as unrealistic and excessive while the US is also blocking the Strait of Hormuz.
While Brent is up 5% this morning, the financial market is still very optimistic that progress will be made. That talks will continue and that the SoH will fully open by the start of May which is consistent with a rest-of-year average Brent crude oil price of around $90/b with the market now trading that balance at around $88/b.
Financial optimism vs. physical deterioration. We have a divergence where the financial market is trading negotiations, improvements and resolution while at the same time the physical market is deteriorating day by day. Physical oil flows remain constrained by disrupted flows, longer voyage times and elevated freight and insurance costs.
Financial markets are betting that a US/Iranian resolution will save us in time from violent shortages down the road. But every day that the SoH remains closed is bringing us closer to a potentially very painful point of shortages and much higher prices.
The US blockade is also a weapon of leverage against its European and Asian allies. When Iran closed the SoH it held the world economy as a hostage against the US. The US blockade of the SoH is of course blocking Iranian oil exports. But it is also an action of disruption directed towards Europe and Asia. The US has called for the rest of the world to engaged in the war with Iran: ”If you want oil from the Persian Gulf, then go and get it”. A risk is that the US plays brinkmanship with the global oil market directed towards its European and Asian allies and maybe even towards China to force them to engage and take part. Maybe unthinkable. But unthinkable has become the norm with Trump in the White House.
Wild moves yesterday. Brent crude traded to a high of $114.43/b and a low of $96.0/b and closed at $99.94/b yesterday.
US – Iran negotiations ongoing or not? What a day. Donald Trump announced that good talks were ongoing between Iran and the US and that the 48 hour deadline before bombing Iranian power plants and energy infrastructure was postponed by five days subject to success of ongoing meetings. Iranian media meanwhile stated that no meetings were ongoing at all.
Today we are scratching our heads trying to figure out what yesterday was all about.
Friends and family playing the market? Was it just Trump and his friends and family who were playing with oil and equity markets with $580m and $1.46bn in bets being placed by someone in oil and equity markets just 15 minutes before Trump’s announcement?
Was Trump pulling a TACO as he reached his political and economic pain point: Brent at $112/b, US Gas at $4/gal, SPX below 200dma and US 10yr above 4.4%?
Different Iranian factions with Trump talking with one of them? Are there real negotiations going on but with the US talking to one faction in Iran while another, the hardliners, are not involved and are denying any such negotiations going on?
Extending the ultimatum to attack and invade Kharg island next weekend? Or, is the five day delay of the deadline a tactical decision to allow US amphibious assault ships and marines to arrive in the Gulf in the upcoming weekend while US and Israeli continues to degrade Iranian military targets till then. And then next weekend a move by the US/Israel to attack and conquer for example the Kharg island?
We do not really know which it is or maybe a combination of these.
We did get some kind of TACO ydy. But markets have been waiting for some kind of TACO to happen and yesterday we got some kind of TACO. And Brent crude is now trading at $101.5/b as a result rather than at $112-114/b as it did no the high yesterday.
But what really matters in our view is the political situation on the ground in Iran. Will hardliners continue to hold power or will a more pragmatic faction gain power?
If the hardliners remain in power then oil pain should extend all the way to US midterm elections. The hardliners were apparently still in charge as of last week. Iran immediately retaliated and damaged LNG infrastructure in Qatar after Israel hit Iranian South Pars. The SoH was still closed and all messages coming out of Iran indicated defiance. Hardliners continues in power has a huge consequence for oil prices going forward. The regime has played its ’oil-weapon’ (closing or chocking the Strait of Hormuz). It is using it to achieve political goals. Deterrence: it needs to be so politically and economically expensive to attack Iran that it won’t happen again in the future. Or at least that the US/Israel thinks 10-times over before they attack again. The highest Brent crude oil closing price since the start of the war is $112.19/b last Friday. In comparison the 20-year inflation adjusted Brent price is $103/b. So Brent crude last Friday at $112.19/b isn’t a shockingly high price. And it is still far below the nominal high of $148/b from 2008 which is $220/b if inflation adjusted. So once in a lifetime Iran activates its most powerful weapon. The oil weapon. It needs to show the power of this weapon and it needs to reap political gains. Getting Brent to $112/b and intraday high of $119.5/b (9 March) isn’t a display of the power of that weapon. And it is not a deterrence against future attacks.
So if the hardliners remain in power in Iran, then the SoH will likely remain chocked all the way to US midterm elections and Brent crude will at a minimum go above the historical nominal high of $148/b from 2008.
Thus the outlook for the oil price for the rest of the year doesn’t depend all that much of whether Trump pulls a TACO or not. Stops bombing or not. It depends more on who is in charge in Iran. If it is the hardliners, then deterrence against future attacks via chocking of the SoH and high oil prices is the likely line of action. It is impacting the world but the Iranian ’oil-weapon’ is directed towards the US president and the the US midterm elections.
If a pragmatic faction gets to power in Iran, then a very prosperous future is possible. However, if power is shifting towards a more pragmatic faction in Iran then a completely different direction could evolve. Such a faction could possibly be open for cooperation with the US and the GCC and possibly put its issues versus Israel aside. Then the prosperity we have seen evolving in Dubai could be a possible future also for Iran.
So far it looks like the hardliners are fully in charge. As far as we can see, the hardliners are still fully in control in Iran. That points towards continued chocking of the SoH and oil prices ticking higher as global inventories (the oil market buffers) are drawn lower. And not just for a few more weeks, but possibly all the way to the US midterm elections.


Solkraften pressar elpriserna dagtid

Michel Gubel ger sin syn på oljemarknaden

Svag vårflod dubblar elpriserna
Brent crude up USD 9/bl on the week… ”deal around the corner” narrative fades
Market Still Betting on Timely Resolution, But Each Day Raises Shortage Risk

Det fysiska spotpriset på brentolja har slagit nytt rekord

Marknaden måste börja betrakta de höga kopparpriserna som det nya normala

Christian Kopfer om läget för oljan
Market Still Betting on Timely Resolution, But Each Day Raises Shortage Risk
Brent crude up USD 9/bl on the week… ”deal around the corner” narrative fades
-
 Nyheter4 veckor sedan
Det fysiska spotpriset på brentolja har slagit nytt rekord
-
 Nyheter4 veckor sedan
Marknaden måste börja betrakta de höga kopparpriserna som det nya normala
-
 Nyheter3 veckor sedan
Christian Kopfer om läget för oljan
-
Analys2 veckor sedan
Market Still Betting on Timely Resolution, But Each Day Raises Shortage Risk
-
Analys1 vecka sedan
Brent crude up USD 9/bl on the week… ”deal around the corner” narrative fades
-
 Nyheter5 dagar sedan
Michel Gubel ger sin syn på oljemarknaden
-
Nyheter5 dagar sedan
Svag vårflod dubblar elpriserna
-
 Nyheter3 dagar sedan
Solkraften pressar elpriserna dagtid