

Analys
Råvaruplanket: Kvartalsrapport för råvaror

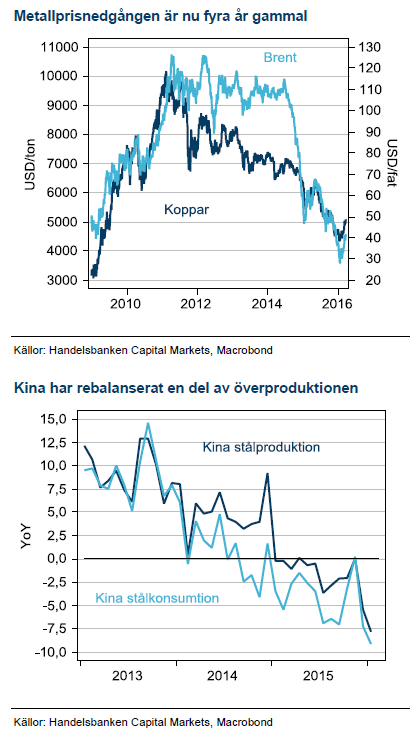
 Bottenkänning för råvaror
Lägre oljepris i nästa rörelse
 Efter mars månads oljeprisuppgång ser vi nu flera tecken på att resan närmar sig vägens slut och att nästa rörelse blir nedåt. Skifferoljan flödar inte längre, Nigeria och Irak har haft produktionsstörningar och inte minst spekulerar marknaden i en minskad produktion från OPEC och Ryssland. Vi går på tvären mot konsensus och tror att alla dessa drivkrafter ligger bakom oss och att priset når 30 snarare än USD 50.
Gruvbolagen stärker basmetallerna
Om oljeprisbotten fortfarande ligger framför oss tror vi att basmetallerna träffat den cykliska botten efter fyra års nedgång, i alla falla som grupp. Kopparproduktionen ser fortfarande något för hög ut men för zink, nickel och aluminium har det skett en massiv rebalansering av marknaden på producentsidan. Vi håller zink som den basmetall med bäst fundamenta och höjer prognosen till USD 2100.
Fed fångad i fällan
Fed:s magra räntehöjning har gett den största gulduppgången över tre månader sedan eurokrisen härjade. Förnimmelsen av att Fed hamnat i en situation där man inte kan styra ekonomin med räntevapnet skapar ett starkt behov hos investerare att parkera en del av pengarna i en säker hamn. Vi tror inte Fed:s situation kommer förbättras de kommande sex månaderna och trots att guld redan passerat vår starka tro på 12% högre pris i år så höjer vi prognosen till USD 1300.
Vårrally i kaffe men svaga vetepriser
Efter övervintringen har vetepriset kommit under press, med höga säkerhetslager världen över och goda förutsättningar för en ny bra skörd. Kaffepriserna har rusat med 18% under mars, inte helt ovanligt med stigande kaffepriser på våren och enligt säsongsmönstret brukar priset vara starkt fram till maj.
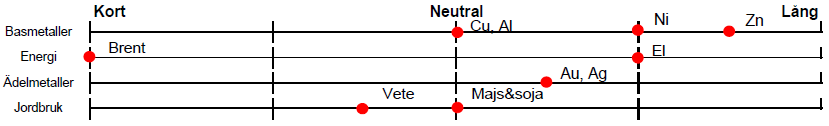
Vår syn för Q2 och Q3 2016:
Basmetaller
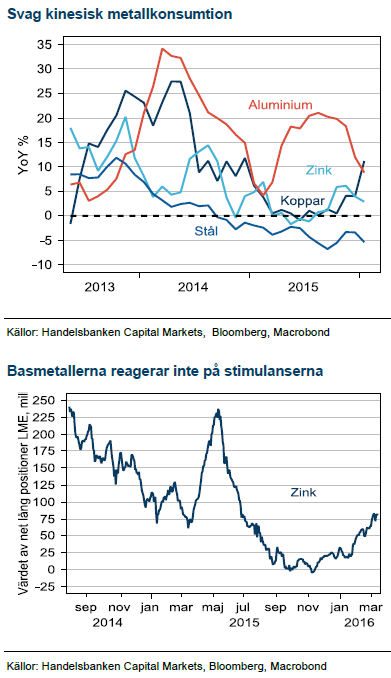 Efterfrågan är inte förklaring till vändning
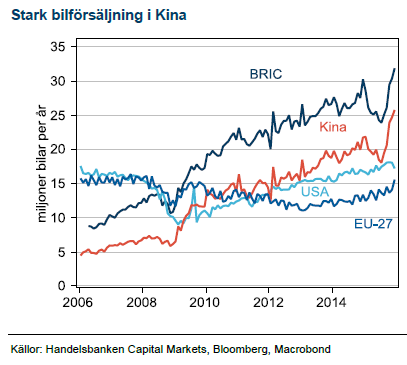
Trots stark fastighetsmarknad i Kina syns ännu inga tecken på att byggandet ska öka efter att ha minskat med omkring 15 % per år de senaste två åren. Vi tror fortfarande att stålkonsumtionen är en ledande indikator för basmetallkonsumtionen i Kina och den fortsätter att falla. Det enda ljuset i mörkret är bilproduktionen, som efter statliga subventioner sedan oktober går urstarkt. Globalt står nu bilmarknaden för 7-8% av efterfrågan på koppar.
Produktionen rebalanseras
Om inte efterfrågan stärks så måste utsikterna för produktionen förändrats för att motivera den senaste uppgången i basmetaller. Efter fyra år av nedgångar i metallpriserna har gruvbolagen slutligen tvingats skära ner på olönsam produktion för att säkra sin egen överlevnad. Det bästa beviset på att de har gjort allt de kan är att årets utdelningar till aktieägarna kapades. Något oljeindustrin fortfarande har framför sig.
Skillnaderna framträder
När marknaden balanseras via utbudssidan kommer varje metalls egen fundamenta fram i rampljuset. Zink är den metall som har störst brist i marknadsbalansen, därefter nickel, aluminium och sist koppar. Zinkbalansen har först förbättrats av de annonserade stängningarna av utbrutna gruvor och sedan i ett andra steg av stängningar av mindre högkostnadsproducenter. Vi höjer därför prognosen till USD 2100
 Aluminium är tveklöst den metall där eventuella prisuppgångar snabbats kommer brytas när avställd kapacitet åter blir lönsam och startas upp. Vi har redan sett hur årets uppgång på 10% medförde att kinesiska verk annonserade ökad produktion för året, vilket åter fick priset på fall. USD 1500 tycker vi därför är en nivå som vi känner oss komfortabla med kommande sex månader.
Vårt aggressiva mål för koppar på USD 4000 ser nu inte av att infalla i närtid. Kopparpriset har visserligen inte fallit till nivåer där större produktionssänkningar tvingas fram men kopparproduktionen sker huvudsakligen i diversifierade gruvbolag som tvingas sänka produktionen över hela linjen för att överleva. Vi höjer till spot, USD 5000.
Nickelpriset behåller vi på USD 9800, 13% uppsida från spot speglar redan nedtryckta nivåer.
Energi
 Oljan studsade
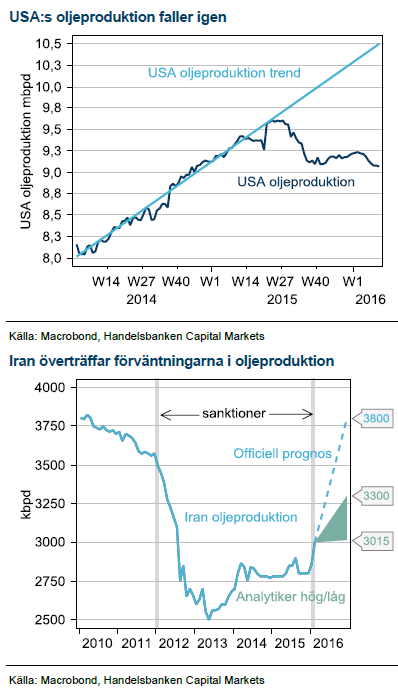
Efter att spenderat det mesta av januari och februari omkring 30-strecket studsade oljan plötsligt upp i mitten av mars. Utbudsstörningar i Irak och Nigeria tillsammans med diskussionerna mellan OPEC och Ryssland om att frysa produktionen gav priset stöd samtidigt som USA:s skifferolja minskade produktionen i sviterna av de låga priserna. Upptakten till OPEC:s sänkning av produktionen på 90-talet var väldigt lik den nuvarande när oljeministrarna reser mellan oljestäderna påhejade av spekulation i media och marknaden.
Ingen sänkning vid junimötet
Vi har argumenterat hårt för att det ännu är för tidigt för OPEC att genomföra en sänkning av produktionen. Högre priser nu skulle omedelbart föra tillbaka USA:s skifferoljeindustri till lånefinansierad tillväxt, det sista OPEC vill. Dessutom har OPEC problemet med Iran som håller på att ta tillbaka sin exportmarknad sedan sanktionerna. Om övriga OPEC sänker produktionen samtidigt som Iran ökar kommer länderna enbart växla marknadsandelar, det sista Saudiarabien vill. En sänkning kan först ske när skifferoljan blivit iskall och Iran återtagit sin export, vilket betyder tidigast 2017 i våra ögon.
Fågel Fenix
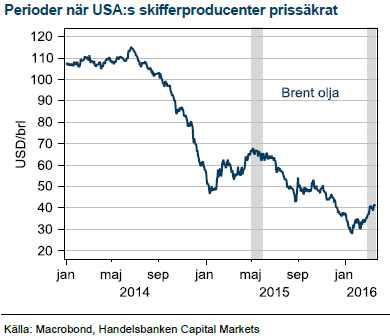 USA:s skifferindustri har visat sig priskänslig, men på allt lägre nivåer. Förra året var skifferindustrin framgångsrik i att refinansiera bolagen och sälja olja på termin under prisstudsen till USD 68 i maj. Den strategin förlängde produktionen när priserna sedan föll efter Iranavtalet i juli. I år ser vi att producenterna åter säljer olja på termin för 2017 som inklusive contango ger USD 45 efter senaste studsen till USD 40 för närmsta terminen. Historien ser alltså ut att upprepa sig och utan OPEC-sänkning tror vi att oljestudsen har gått för långt.
Kan elpriset stiga?
Kolpriserna ser slutligen ut att ha nått någon form av bottenkänning. Statistiskt närmar vi oss också timing förr ett torrare/kallare år. Vi tycker riskbilden i el talar för att börja tror på högre priser efter flera år av evig utförslöpa.
Ädelmetaller
 Feds huvudvärk är guldets gnista
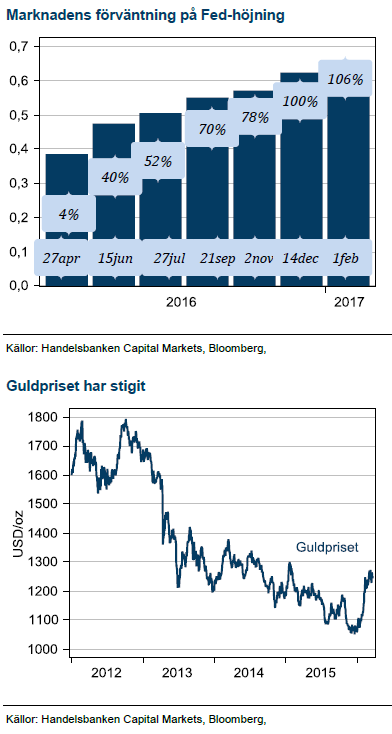
Vi har tidigare argumenterat för att Feds supermjuka penningpolitik var den främsta drivkraften till guldprisuppgången efter finanskrisen. Guld föll också kraftigt när Fed började med ”tapering”. Efter att Fed startat höjningscykeln i december har mycket utvecklats på ett ogynnsamt vis för Amerikanska centralbanken. Makrodata har visserligen förbättrats och finasiella marknader har i stort återhämtat sig sedan decemberhöjningen. Osäkerheten i marknaden består dock och det är långt kvar till räntemarknaden åter prisar höjningar från Fed likt vid decembermötet. Nu finns endast en höjning kvar i år enligt räntemarknadens prissättning.
Fed börjar för sent
I efter hand framstår det allt mer som att 2015 var året då den Amerikanska och globala ekonomin var ”stark” och hade klarat ett antal räntehöjningar. Då avstod Fed av flera skäl. När Fed nu känner sig redo har ekonomin redan börjat tippa över och är på väg in i en cyklisk avmattning. Om Fed väljer att fortsätta med höjningscykeln nu risker man att höja räntorna rakt in i en Amerikansk recession.
För guld har situationen utvecklats till en perfekt storm. Även om vi inte är beredda att dra slutsatserna att Fed har misslyckats så här långt konstaterar vi krasst att Feds bekymmer är utmärkt grogrund för guldpriset framgent.
Jordbruk
 Lägre vetepriser
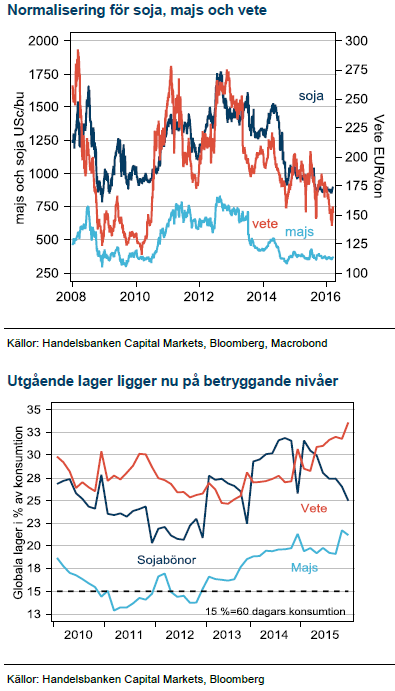
Vete i Paris har fallit omkring 13% procent i år och lagernivåerna är höga. Det går väldigt trögt att få ut vete på exportmarknaden. USA:s export ligger 18% under förra årets nivå och EU ligger 15% under. Ryssland tar marknadsandelar med hjälp av svag rubel. Tiden tickar snabbt för att exportera gammal skörd, främst de största importörerna i Nordafrika har bara några veckor till årets skörd.
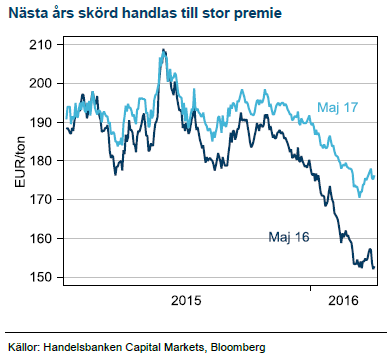
Prisfallet är redan större än vi förväntade oss för tre månader sedan. Trots det ser vi inget, förutom väderproblem i något av de större odlingsområdena som kan vända pristrenden. Terminer med längre löptid handlas till en stor premie, främst en riskpremie för eventuellt sämre skörd. Normalt faller denna riskpremie ur successivt fram till skörd. Vi tror på ett liknande scenario i år och illustrerar med grafen till höger där spreaden mellan gammal (maj 2016) och kommande (maj 2017) skörd syns. Vi trodde tidigare på priser kring 160 EUR/ton vid årets skörd men sänker nu denna till 140, lägsta på många år och rimligen en prövning som kan komma att balansera produktionen för nästa år och därmed dämpa lageruppbyggnaden.
Majspriserna på botten?
Majs har varit extra hårt ansatt då grödan är tätare kopplad till energimarknaden genom användningen i etanolindustrin och därmed det fallande oljepriset. Majspriserna har parkerat på låga nivåer, ett typsikt tecken för en råvara som ligger i överskott och handlas kring produktionskostanden. Även majsexporten från USA går trögt, 18 % under fjolårets nivå. Något stöd har dock majs fått från senaste tidens svagare USD samt något långsammare start på skörden i Argentina. Det finns inget större skäl till tro på en snar vändning upp, men vi bedömer nedsidan som begränsad.
 Kaffepriset stiger på våren
Mars månads kafferally summerar nu 19% efter El-Nino orsakade torka i Colombia. Ett vårrally i kaffe är inte ovanligt och enligt säsongsmönstret sedan 1975 brukar priserna vara starka fram till maj. Oro finns dock för att skörden kan bli lidande i två år i Colombia.
[box]SHB Råvarukommentar är producerat av Handelsbanken och publiceras i samarbete och med tillstånd på Råvarumarknaden.se[/box]
Ansvarsbegränsning
Detta material är producerat av Svenska Handelsbanken AB (publ) i fortsättningen kallad Handelsbanken. De som arbetar med innehållet är inte analytiker och materialet är inte oberoende investeringsanalys. Innehållet är uteslutande avsett för kunder i Sverige. Syftet är att ge en allmän information till Handelsbankens kunder och utgör inte ett personligt investeringsråd eller en personlig rekommendation. Informationen ska inte ensamt utgöra underlag för investeringsbeslut. Kunder bör inhämta råd från sina rådgivare och basera sina investeringsbeslut utifrån egen erfarenhet.
Informationen i materialet kan ändras och också avvika från de åsikter som uttrycks i oberoende investeringsanalyser från Handelsbanken. Informationen grundar sig på allmänt tillgänglig information och är hämtad från källor som bedöms som tillförlitliga, men riktigheten kan inte garanteras och informationen kan vara ofullständig eller nedkortad. Ingen del av förslaget får reproduceras eller distribueras till någon annan person utan att Handelsbanken dessförinnan lämnat sitt skriftliga medgivande. Handelsbanken ansvarar inte för att materialet används på ett sätt som strider mot förbudet mot vidarebefordran eller offentliggörs i strid med bankens regler.


Down on Friday. Up on Monday. The Brent June crude oil contract traded down 5.1% last week to a close of $90.38/b. It reached a high of $103.87/b last Monday and a low of $86.09/b on Friday as Iran announced that the Strait of Hormuz was fully open for transit. That quickly changed over the weekend as the US upheld its blockade of Iranian oil exports while Iran naturally responded by closing the SoH again. The US blew a hole in the engine room of the Iranian ship TOUSKA and took custody of the ship on Sunday. Brent crude is up 5.6% this morning to $95.4/b.

The cease-fire is expiring tomorrow. The US has said it will send a delegation for a second round of negotiations in Islamabad in Pakistan. But Iran has for now rejected a second round of talks as it views US demands as unrealistic and excessive while the US is also blocking the Strait of Hormuz.
While Brent is up 5% this morning, the financial market is still very optimistic that progress will be made. That talks will continue and that the SoH will fully open by the start of May which is consistent with a rest-of-year average Brent crude oil price of around $90/b with the market now trading that balance at around $88/b.
Financial optimism vs. physical deterioration. We have a divergence where the financial market is trading negotiations, improvements and resolution while at the same time the physical market is deteriorating day by day. Physical oil flows remain constrained by disrupted flows, longer voyage times and elevated freight and insurance costs.
Financial markets are betting that a US/Iranian resolution will save us in time from violent shortages down the road. But every day that the SoH remains closed is bringing us closer to a potentially very painful point of shortages and much higher prices.
The US blockade is also a weapon of leverage against its European and Asian allies. When Iran closed the SoH it held the world economy as a hostage against the US. The US blockade of the SoH is of course blocking Iranian oil exports. But it is also an action of disruption directed towards Europe and Asia. The US has called for the rest of the world to engaged in the war with Iran: ”If you want oil from the Persian Gulf, then go and get it”. A risk is that the US plays brinkmanship with the global oil market directed towards its European and Asian allies and maybe even towards China to force them to engage and take part. Maybe unthinkable. But unthinkable has become the norm with Trump in the White House.
Wild moves yesterday. Brent crude traded to a high of $114.43/b and a low of $96.0/b and closed at $99.94/b yesterday.
US – Iran negotiations ongoing or not? What a day. Donald Trump announced that good talks were ongoing between Iran and the US and that the 48 hour deadline before bombing Iranian power plants and energy infrastructure was postponed by five days subject to success of ongoing meetings. Iranian media meanwhile stated that no meetings were ongoing at all.
Today we are scratching our heads trying to figure out what yesterday was all about.
Friends and family playing the market? Was it just Trump and his friends and family who were playing with oil and equity markets with $580m and $1.46bn in bets being placed by someone in oil and equity markets just 15 minutes before Trump’s announcement?
Was Trump pulling a TACO as he reached his political and economic pain point: Brent at $112/b, US Gas at $4/gal, SPX below 200dma and US 10yr above 4.4%?
Different Iranian factions with Trump talking with one of them? Are there real negotiations going on but with the US talking to one faction in Iran while another, the hardliners, are not involved and are denying any such negotiations going on?
Extending the ultimatum to attack and invade Kharg island next weekend? Or, is the five day delay of the deadline a tactical decision to allow US amphibious assault ships and marines to arrive in the Gulf in the upcoming weekend while US and Israeli continues to degrade Iranian military targets till then. And then next weekend a move by the US/Israel to attack and conquer for example the Kharg island?
We do not really know which it is or maybe a combination of these.
We did get some kind of TACO ydy. But markets have been waiting for some kind of TACO to happen and yesterday we got some kind of TACO. And Brent crude is now trading at $101.5/b as a result rather than at $112-114/b as it did no the high yesterday.
But what really matters in our view is the political situation on the ground in Iran. Will hardliners continue to hold power or will a more pragmatic faction gain power?
If the hardliners remain in power then oil pain should extend all the way to US midterm elections. The hardliners were apparently still in charge as of last week. Iran immediately retaliated and damaged LNG infrastructure in Qatar after Israel hit Iranian South Pars. The SoH was still closed and all messages coming out of Iran indicated defiance. Hardliners continues in power has a huge consequence for oil prices going forward. The regime has played its ’oil-weapon’ (closing or chocking the Strait of Hormuz). It is using it to achieve political goals. Deterrence: it needs to be so politically and economically expensive to attack Iran that it won’t happen again in the future. Or at least that the US/Israel thinks 10-times over before they attack again. The highest Brent crude oil closing price since the start of the war is $112.19/b last Friday. In comparison the 20-year inflation adjusted Brent price is $103/b. So Brent crude last Friday at $112.19/b isn’t a shockingly high price. And it is still far below the nominal high of $148/b from 2008 which is $220/b if inflation adjusted. So once in a lifetime Iran activates its most powerful weapon. The oil weapon. It needs to show the power of this weapon and it needs to reap political gains. Getting Brent to $112/b and intraday high of $119.5/b (9 March) isn’t a display of the power of that weapon. And it is not a deterrence against future attacks.
So if the hardliners remain in power in Iran, then the SoH will likely remain chocked all the way to US midterm elections and Brent crude will at a minimum go above the historical nominal high of $148/b from 2008.
Thus the outlook for the oil price for the rest of the year doesn’t depend all that much of whether Trump pulls a TACO or not. Stops bombing or not. It depends more on who is in charge in Iran. If it is the hardliners, then deterrence against future attacks via chocking of the SoH and high oil prices is the likely line of action. It is impacting the world but the Iranian ’oil-weapon’ is directed towards the US president and the the US midterm elections.
If a pragmatic faction gets to power in Iran, then a very prosperous future is possible. However, if power is shifting towards a more pragmatic faction in Iran then a completely different direction could evolve. Such a faction could possibly be open for cooperation with the US and the GCC and possibly put its issues versus Israel aside. Then the prosperity we have seen evolving in Dubai could be a possible future also for Iran.
So far it looks like the hardliners are fully in charge. As far as we can see, the hardliners are still fully in control in Iran. That points towards continued chocking of the SoH and oil prices ticking higher as global inventories (the oil market buffers) are drawn lower. And not just for a few more weeks, but possibly all the way to the US midterm elections.
A brief sigh of relief yesterday as oil infra at Kharg wasn’t damaged. But higher today. Brent crude dabbled around a bit yesterday in relief that oil infrastructure at Iran’s Kharg island wasn’t damaged. It traded briefly below the 100-line and in a range of $99.54 – 106.5/b. Its close was near the low at $100.21/b.
No easy victorious way out for Trump. So no end in sight yet. Brent is up 3.2% today to $103.4/b with no signs that the war will end anytime soon. Trump has no easy way to declare victory and mission accomplished as long as Iran is in full control of the Strait of Hormuz while also holding some 440 kg of uranium enriched to 60% and not far from weapons grade at 90%. As long as these two factors are unresolved it is difficult for Trump to pull out of the Middle East. Naturally he gets increasingly frustrated over the situation as the oil price and US retail gas prices keeps ticking higher while the US is tied into the mess in the Middle East. Trying to drag NATO members into his mess but not much luck there.
When commodity prices spike they spike 2x, 3x, 4x or 5x. Supply and demand for commodities are notoriously inflexible. When either of them shifts sharply, the the price can easily go to zero (April 2022) or multiply 2x, 3x, or even 5x of normal. Examples in case cobalt in 2025 where Kongo restricted supply and the price doubled. Global LNG in 2022 where the price went 5x normal for the full year average. Demand for tungsten in ammunition is up strongly along with full war in the middle east. And its price? Up 537%.
Why hasn’t the Brent crude oil price gone 2x, 3x, 4x or 5x versus its normal of $68/b given close to full stop in the flow of oil of the Strait of Hormuz? We are after all talking about close to 20% of global supply being disrupted. The reason is the buffers. It is fairly easy to store oil. Commercial operators only hold stocks for logistical variations. It is a lot of oil in commercial stocks, but that is predominantly because the whole oil system is so huge. In addition we have Strategic Petroleum Reserves (SPRs) of close to 2500 mb of crude and 1000 mb of oil products. The IEA last week decided to release 400 mb from global SPR. Equal to 20 days of full closure of the Strait of Hormuz. Thus oil in commercial stocks on land, commercial oil in transit at sea and release of oil from SPRs is currently buffering the situation.
But we are running the buffers down day by day. As a result we see gradually increasing stress here and there in the global oil market. Asia is feeling the pinch the most. It has very low self sufficiency of oil and most of the exports from the Gulf normally head to Asia. Availability of propane and butane many places in India (LPG) has dried up very quickly. Local prices have tripled as a result. Local availability of crude, bunker oil, fuel oil, jet fuel, naphtha and other oil products is quickly running down to critical levels many places in Asia with prices shooting up. Oman crude oil is marked at $153/b. Jet fuel in Singapore is marked at $191/b.
Oil at sea originating from Strait of Hormuz from before 28 Feb is rapidly emptied. Oil at sea is a large pool of commercial oil. An inventory of oil in constant move. If we assume that the average journey from the Persian Gulf to its destinations has a volume weighted average of 13.5 days then the amount of oil at sea originating from the Persian Gulf when the the US/Israel attacked on 28 Feb was 13.5 days * 20 mb/d = 269 mb. Since the strait closed, this oil has increasingly been delivered at its destinations. Those closest to the Strait, like Pakistan, felt the emptying of this supply chain the fastest. Propane prices shooting to 3x normal there already last week and restaurants serving cold food this week is a result of that. Some 50-60% of Asia’s imports of Naphtha normally originates from the Persian Gulf. So naphtha is a natural pain point for Asia. The Gulf also a large and important exporter of Jet fuel. That shut in has lifted jet prices above $200/b.
To simplify our calculations we assume that no oil has left the Strait since that date and that there is no increase in Saudi exports from Yanbu. Then the draining of this inventory at sea originated from the Persian Gulf will essentially look like this:
The supply chain of oil at sea originating from the Strait of Hormuz is soon empty. Except for oil allowed through the Strait of Hormuz by Iran and increased exports from Yanbu in the Red Sea. Not included here.

Oil at sea is falling fast as oil is delivered without any new refill in the Persian Gulf. Waivers for Russian crude is also shifting Russian crude to consumers. Brent crude will likely start to feel the pinch much more forcefully when oil at sea is drawn down another 200 mb to around 1000 mb. That is not much more than 10 days from here.

Oil and oil products are starting to become very pricy many places. Brent crude has still been shielded from spiking like the others.


Market Still Betting on Timely Resolution, But Each Day Raises Shortage Risk

Christian Kopfer om läget för oljan

Marknaden måste börja betrakta de höga kopparpriserna som det nya normala

Det fysiska spotpriset på brentolja har slagit nytt rekord

40 minuter med Javier Blas om hur världen verkligen påverkas av energikrisen
40 minuter med Javier Blas om hur världen verkligen påverkas av energikrisen

Elpriserna fördubblas, stor osäkerhet inför sommaren

MP Materials, USA:s svar på Kinas dominans över sällsynta jordartsmetaller
Det fysiska spotpriset på brentolja har slagit nytt rekord

Studsvik har idag ansökt om att få bygga 1200-1600 MW kärnkraft i Valdemarsvik
-
 Nyheter3 veckor sedan
40 minuter med Javier Blas om hur världen verkligen påverkas av energikrisen
-
 Nyheter4 veckor sedan
Elpriserna fördubblas, stor osäkerhet inför sommaren
-
 Nyheter4 veckor sedan
MP Materials, USA:s svar på Kinas dominans över sällsynta jordartsmetaller
-
 Nyheter2 veckor sedan
Det fysiska spotpriset på brentolja har slagit nytt rekord
-
 Nyheter4 veckor sedan
Studsvik har idag ansökt om att få bygga 1200-1600 MW kärnkraft i Valdemarsvik
-
 Nyheter2 veckor sedan
Marknaden måste börja betrakta de höga kopparpriserna som det nya normala
-
Analys4 veckor sedan
TACO (or Whatever It Was) Sends Oil Lower — Iran Keeps Choking Hormuz
-

 Nyheter4 veckor sedan
Matproduktion är beroende av gödsel, Gulfkriget skapar brist