

Analys
SEB Råvarubrev 30 mars 2016

 Inget stöd från den svagare dollarn.
MARKNADEN I KORTHET
Efter att vissa FED ledamöter under förra veckan uttryckt sig något mer hökaktigt så plockade Yellen igår kväll effektivt ned förväntningar om en sådan utveckling. Talet var i stort sett en upprepning av budskapet från FEDs marsmöte. Dollarn föll följaktligen tillbaka efter talet. Det är dock intressant att notera att flera råvaror inte dragit nytta av dollarförsvagningen vilket vi anser stärka vår vy om svagare basmetaller och olja. Det faktum att det statliga specialstålbolaget Dongbei Special Steel missade en räntebetalning på sitt obligationslån (första gången ett statligt bolag missar en räntebetalning på en listad obligation) visar på de fortsatta problem stålindustrin står inför.
Råvaror: Olja och basmetaller kämpar för närvarande i motvind medan jordbruksprodukter klarat sig bättre.
Valuta: Dollarn faller antagligen något ytterligare innan vi når fast mark.
Börser: Fortsätter att utvecklas positivt ledda av USA. Bankaktier fortsätter dock att vara ett sänke.
Räntor: Centralbankernas agerande fortsätter att pressa ned de långa räntorna.
OBSERVATIONER I SAMMANDRAG
- Brentoljan ser nu ut att ha satt åtminstone en temporär topp på plats.
- Elpriset har tagit ett kliv uppåt och nu nått vårt säljområde.
- Försöket till en dollarbotten kom av sig efter Yellen. Ett nytt försök bör komma inom kort.
- Koppar ser allt svagare ut och vi ser en klar risk för ytterligare nedgång i närtid.
- Nickel närmar sig nu den säljnivå vi pekat ut under de senaste veckorna.
- Dollarsäljarna har visat sig vara mer envisa än vad vi förutsett (stopp under 8,09)
- Guldet har nått ett minimimål för korrektionen men inte med mindre än ett brott över $1271/uns blir vi positiva. Vi anser att marknaden är fortsatt allt för överköpt för att kunna fortsätta uppgången just nu.
- Kaffet har korrigerat kraftigare än förväntat men vi är kvar långa så länge inte $125,5 bryts.
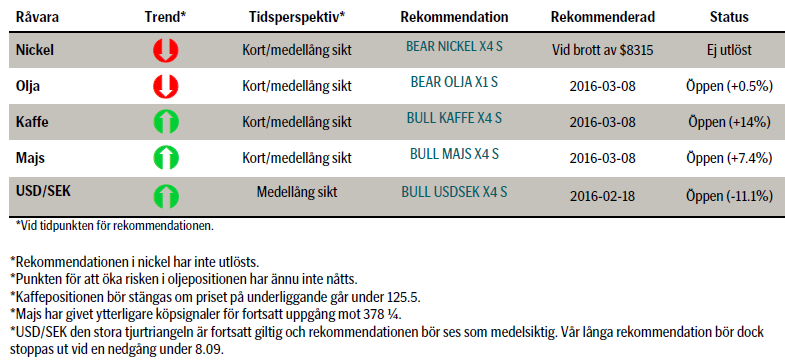
VECKANS REKOMMENDATIONER
En placering i certifikat och warranter är förknippat med risker. Du kan förlora hela ditt investerade kapital. Läs mer om riskerna i SEB:s offentliggjorda Grundprospekt för certifikat- och warrantprogram på seb.se/cert eller seb.se/mini
OLJA BRENT
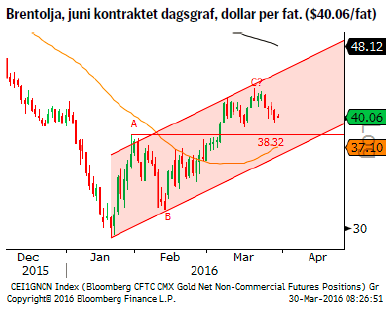 Än så länge så ser det ut som vårt antagande om en (åtminstone temporär) pristopp varit korrekt då förra veckan slutade netto ned för första gången på sex veckor. Den spekulativa netto långa nettopositioneringen fortsatte dock att öka och är nu den högsta sedan juni 2015 (inte långt från förra årets korrektionstopp). Dollarindex stärktes också under förra veckan vilket även det hjälpte till med att guida priset lägre. Fokus kommande veckor är fortsatt på det uppkommande oljeproducent mötet i Doha den 17:e april.
Vi har en negativ vy även för innevarande vecka.
OBSERVATIONER
- Antalet riggar föll igen (-15) igen efter förr förra veckans uppgång och uppgår nu till 372 stycken.
- Gårdagens dollarnedgång gav inte mycket till stöd för oljepriset vilket vi ser som en negativ faktor.
- Lagren fortsätter att stiga (vilket ger incitament att ställa av ytterligare borriggar). Lagren har ökat med 32 miljoner fat bara de senaste fyra veckorna.
- Commitment of Traders (CoT) rapporten visar på fortsatt spekulativt köpande.
- Köpandet är dock i huvudsak stängningar av korta positioner och inte nya långa positioner.
- CoT-positioneringen närmar sig de långa nivåer som vi såg vid förra årets korrektionstopp (Brentpositioneringen är den högsta någonsin).
- Det historiska säsongsmönstret pekar mot en pristopp under våren,
- $38.96 och $38.32/fat är veckans viktigaste stödpunkter.
- $41.62/fat är ett viktigt motstånd.
REKOMMENDATION
- BEAR OLJA X1 S (vi rekommenderar att öka hävstång om/när priset faller under $36,25/fat).
EL
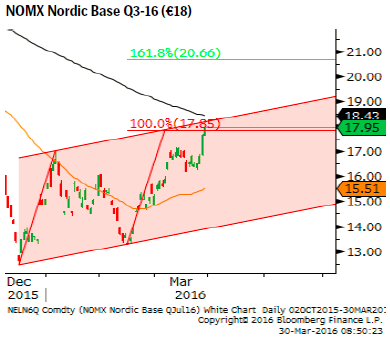 Efter den senaste prisuppgången så har vi hamnat i det område, €17.35 – 18.45 som vi primärt ser som ett målområde för innevarande uppgång. Divergensen mellan olja och el är relativt stor och bör sannolikt inte öka ytterligare. Ett stigande kolpris borde ge stöd men neutraliseras i princip av lägre CO2 priser.
OBSERVATIONER
- Befinner sig nu i det utmålade målområdet €17.35 – 18.45.
- Inflödet till vattenmagasinen fortsätter att öka varefter våren framskrider.
- Vattenmagasinen har sedan förra veckan minskat något och har nu en fyllnadsgrad på 43.5%. Fyllnadsgraden bör minska ytterligare då man nu tappar av för att ge plats för vårfloden.
- Hydrobalansen har ett något större underskott (-7 TWh) jämfört med förra veckan (-5,3 Twh).
- Den meterologiska prognosen säger att vi har torrare väder än normalt att förvänta (under en under året torr period).
- Kanaltaket och 200-dagars medelvärdet utgår två viktiga tekniska motstånd.
- Skulle priset mot förmodan inte vända i det primära målområdet så återfinns ett sekundärt mål vid €20.66.
REKOMMENDATION
- BEAR EL X2 S
KOPPAR (LME 3M)
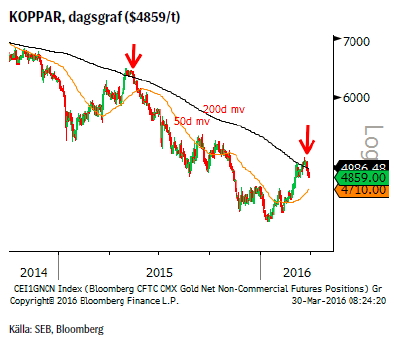 För det första så är hela metallkomplexet för närvarande på tillbakagång (fortsättning av nedåttrend eller korrektion av årets uppgång). För det andra så tillhör koppar och aluminium de två metaller som ser svagast ut och därför bör drabbas hårdast den närmaste tiden. Det kinesiska köpandet av koppar förväntas minska framgent då arbitraget att köpa koppar ur LMEs lager och sälja motsvarande koppar på Shanghaibörsen nu ser ut att komma till sitt slut då skillnaden i pris nu utjämnas. Kinesiska importörer har också köpt för lager utifall att den kinesiska valutan skulle komma att devalveras. Noterbart är också att trots dollarns fall efter Yellens tal igår kväll föll ändå kopparpriset.
OBSERVATIONER
- Arbitraget att flytta koppar till Kina minskar.
- Lageruppbyggnad i Kina pga. oro för CNY-försvagning.
- Dollarkorrektionens sista fas?
- Den långa nettopositioneringen gör att marknaden är sårbar för ett fallande pris (stopp loss försäljningar).
- Kapitalförvaltare har de två senaste veckorna minskat sin långa kopparposition.
- Prisuppgången i år kan inte motiveras av förändrade utbuds/efterfrågekalkyler (Goldman Sachs ser t.ex. inte marknaden i balans förrän 2019).
- Tekniskt så har vi precis återvänt ned under ett negativt lutat 200-dagars glidande medelvärde, precis så som korrektionen 2015 slutade.
REKOMMENDATION
- BEAR KOPPAR X4 S
NICKEL (LME 3M)
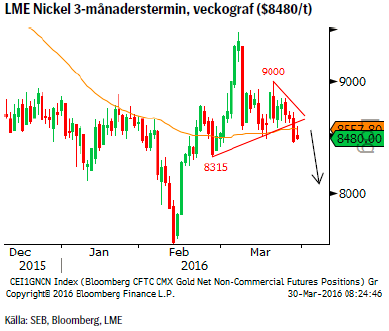 Nickelpriset befann sig förra veckan i ett relativt snävt intervall konsoliderandes det tidigare kraftiga prisfallet. Vår vy är fortfarande att priset ska ned ytterligare i närtid och det trots att prognoserna pekar på att marknaden kommer att hamna i underskott tidigare än förväntat. Noterbart är också att trots dollarns fall efter Yellens tal igår kväll föll ändå nickelpriset.
OBSERVATIONER
- INSG’s (Int’l Nickel Study Group) senaste rapport om ett underskott om 8,100 ton redan i januari indikerar att vi snabbare än förväntat hamnat i underskott.
- Det globala underskottet förväntas att förvärras under kvartal 2.
- Prisutvecklingen visar dock att marknaden tar underskottet med ro och revideringar av data är antagligen också att förvänta.
- Data för januari är ofta föremål för revideringar då inkommande data ofta är försenat pga. det kinesiska nyåret.
- Svaghet inom rostfritt stål och än så länge bara planerade, inte genomförda, produktionsneddragningar bör dämpa försök till prisuppgångar.
- Tekniskt är konsolideringen de senaste veckorna ett fortsättningsmönster för nedsidan ($8315/ton måste dock brytas för att bekräfta nästa steg nedåt).
REKOMMENDATION
- BEAR NICKEL X4 S vid ett brott av $8315/t.
GULD
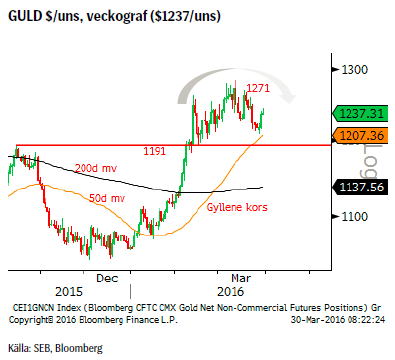 Guldpriset fortsatte förra veckan att glida nedåt och ett minimimål, $1212/uns, har också uppnåtts. Vi håller dock kvar vår vy att priset bör falla under $1200/uns (idealet är $1191/uns) innan ett nytt försök mot högre nivåer görs. Marknaden adderade, trots nedgången i pris, ytterligare långa positioner och nettopositioneringen är nu den största sedan januari 2015 vilket vi fortsatt ser som en nedåtrisk. Centralbanker i öst fortsätter att köpa guld i stor skala (Ryssland ska enligt IMF ha adderat ytterligare 356,000 uns under februari, även Kina sägs ha gjort så men där saknas data hos IMF).
Vi bibehåller förra veckas rekommendation att gå lång vid en dipp under $1200/uns.
OBSERVATIONER
- Dollarförsvagningen bör vara i sin slutfas trots Yellens idoga försök att spela ned förväntningar om räntehöjningar.
- Flödet in i guldrelaterade aktier och produkter har fortsatt.
- Centralbanker i öst fortsätter att köpa (och i väst att sälja t.ex. Bank of Canada har sålt av hela sitt innehav).
- CoT (Commitment of Traders) rapporten visade att de spekulativa köparna förra veckan kom tillbaka.
- CoT positioneringen är nu den högsta på 14 månader.
- Guldsmedsstrejken (mot höjning av punktskatten på ädelmetaller) i Indien är över vilket kan tänkas öka aktiviteten.
- Tekniskt bör vi hålla oss under $1271/uns för att möjligheten till den sökta nedgången ska kvarstå.
- Tekniskt så skulle även en så kallad huvud/skuldra toppformation kunna vara i görande.
REKOMMENDATION
- BULL GULD X2 S när priset går under $1200.
KAFFE
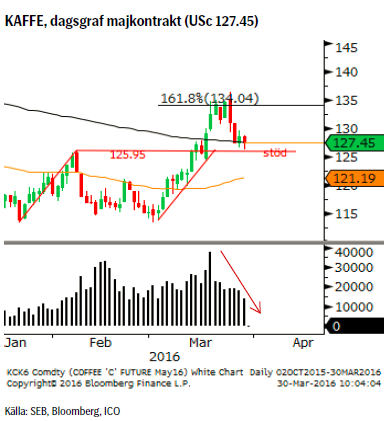 Kaffepriset förra veckan var som vi fruktade allt för högt och marknaden allt för överköpt. Korrektionen, driven av vinsthemtagningar, blev dock kraftigare än vad vi räknat med. Med underliggande fundamentala faktorer talandes för högre priser samt att volymen fallit kraftigt under korrektionen kvarstår vår positiva vy. Idealt ska priset nu börja stiga från stödet vid $125.95 – 127.49.
OBSERVATIONER
- ICO pekade i sin senaste rapport på ett ökat skördeunderskott i år.
- Osäkerheten är dock stor hur mycket som kan kompenseras via ”okända” lager.
- Det politiska läget i Brasilien förvärras hela tiden vilket kan komma att ge störningar i både utbud och utskeppning.
- El Niňo har gjort att växterna generellt är i sämre skick och därför förväntas ge en mindre avkastning.
- El Niňo klingar allt tydligare av (havsytetemperaturen i Stilla havet har på några månader fallit med cirka 1.5 grad (av de 3 graders uppgång som fenomenet orsakat).
REKOMMENDATION
- BULL KAFFE X4 S – stopp under 125.5.
AKTUELLA REKOMMENDATIONER
[box]SEB Veckobrev Veckans råvarukommentar är producerat av SEB:s Commodities Sales desk och publiceras i samarbete och med tillstånd på Råvarumarknaden.se[/box]
KÄLLOR
Bloomberg, Reuters, SEB
VILLKOR
För varje enskilt certifikat/mini future finns Slutliga Villkor som anger de fullständiga villkoren. Slutliga Villkor finns tillgängligt på kurssidan för respektive certifikat/mini future på www.seb.se, Börs & finans, fliken Strukturerade placeringar.
RISKER
En sammanfattning av de risker som är förknippade med Börshandlade certifikat generellt finns i Produktbroschyren för respektive certifikat eller mini future som är tillgängligt på seb.se/cert respektive seb.se/mini. För en fullständig bild av riskerna behöver du ta del av SEB:s offentliggjorda Grundprospekt för Certifikat- och Warrantprogram som är publicerat på www.seb.se/cert respektive seb.se/mini.
DISCLAIMER
Detta marknadsföringsmaterial, framtaget av SEB:s Commodities Sales desk, har upprättats enbart i informationssyfte.
Även om innehållet är baserat på källor som SEB bedömt som tillförlitliga ansvarar SEB inte för fel eller brister i informationen. Den utgör inte oberoende, objektiv investeringsanalys och skyddas därför inte av de bestämmelser som SEB har infört för att förebygga potentiella intressekonflikter. Yttranden från SEB:s Commodities Sales desk kan vara oförenliga med tidigare publicerat material från SEB, då den senare hänvisas uppmanas du att läsa den fullständiga rapporten innan någon åtgärd vidtas.
Dokumentationen utgör inte någon investeringsrådgivning och tillhandahålls till dig utan hänsyn till dina investeringsmål. Du uppmanas att självständigt bedöma och komplettera uppgifterna i denna dokumentation och att basera dina investeringsbeslut på material som bedöms erforderligt. Alla framåtblickande uttalanden, åsikter och förväntningar är föremål för risker, osäkerheter och andra faktorer och kan orsaka att det faktiska resultatet avviker väsentligt från det förväntade. Historisk avkastning är ingen garanti för framtida resultat. Detta dokument utgör inte ett erbjudande att teckna några värdepapper eller andra finansiella instrument. SEB svarar inte för förlust eller skada – direkt eller indirekt, eller av vad slag det vara må – som kan uppkomma till följd av användandet av detta material eller dess innehåll.
Observera att det kan förekomma att SEB, dess ledamöter, dess anställda eller dess moder- och/eller dotterbolag vid olika tillfällen innehar, har innehaft eller kommer att inneha aktier, positioner, rådgivningsuppdrag i samband med corporate finance-transaktioner, investment- eller merchantbanking-uppdrag och/eller lån i de bolag/finansiella instrument som nämns i materialet.
Materialet är avsett för mottagaren, all spridning, distribuering mångfaldigande eller annan användning av detta meddelande får inte ske utan SEB:s medgivande. Materialet riktar sig inte till personer vars medverkan kräver ytterligare prospekt, registrerings- eller andra åtgärder än vad som följer av svensk rätt. Det åligger var och en att iaktta sådana restriktioner. Materialet får inte distribueras i eller till land där distribution kräver ovan nämnda åtgärder eller strider mot reglering i sådant land. Materialet riktar sig således inte till fysiska eller juridiska personer hemmahörande i USA eller i något annat land där publicering eller tillhandahållande av materialet är förbjudet eller strider mot tillämpliga bestämmelser i landet.
Oaktat detta får SEB tillåta omfördelning av materialet till utvald tredje part i enlighet med gällande avtal. Materialet får inte spridas till fysiska eller juridiska personer som är medborgare eller har hemvist i ett land där sådan spridning är otillåten enligt tillämplig lag eller annan bestämmelse.
Skandinaviska Enskilda Banken AB (publ) är ett publikt aktiebolag och står under tillsyn av Finansinspektionen samt de lokala finansiella tillsynsmyndigheter i varje jurisdiktionen där SEB har filial eller dotterbolag.
Market is starting to take US/Iran headlines with a pinch of salt. Brent crude rose $2.8/b yesterday to an official close of $112.1/b. But after that it traded as low as $108.05/b before ending late night at around $109.7/b. Through the day it traded in a range of $106.87 – 112.72/b amid a flurry of news or rumors from Iran and the US. ”US temporary sanctions during negotiations” (falls alarm). ”We will bomb Iran” (not anyhow),… etc. While the market is still fluctuating to this kind of news flow, it is starting to take such headlines with a pinch of salt.

We’ll see. Maybe, maybe not. The Brent M1 contract is trading at $110.2/b this morning which very close to the average ticks through yesterday of $110.4/b.
Trump with bearish, verbal intervention whenever Brent trades above $110/b it seems. What seems to be a pattern is that Trump states something like ”very good negotiations going on with Iran”, ”New leaders in Iran are great,..”, ”Great progress in negotiations,…”, ”Deal in sight,..” etc whenever the Brent M1 contract trades above $110/b. An effort to cool the market. These hot air verbal interventions from Trump used to have a heavy bearish impact on prices, but they now seems to have less and less effect unless they are backed by reality.
As far as we can see there has been no real progress in the negotiations between the US and Iran with both sides still standing by their previous demands.
Iran is getting stronger while the cease fire lasts making a return to war for Trump yet harder. Iran is naturally in constant preparation for a return to war given Trump’s steady threats of bombing Iran again. Iran is naturally doing what ever is possible to prepare for a return to war. And every day the cease fire lasts it is better prepared. This naturally makes it more and more difficult and dangerous for the US to return to warring activity versus Iran as the consequences for energy infrastructure in the Persian Gulf will be more and more severe the longer the cease fire lasts. Israel seems to see it this way as well. That the war is not won and that current frozen state of a cease fire gives Iran opportunity to rebuild military and politically.
Global inventories are drawing down day by day. How much? In the meantime the Strait of Hormuz stays closed. There is varying measures and estimates of how much global inventories are drawing down. Our rough estimate, back of the envelope, is that global inventories are drawing down by at least some 10 mb/d or about 300 mb/d in a balance between loss of supply versus demand destruction. Other estimates we see are a monthly draw of 250-270 mb/d. The IEA only ’measured’ a draw in global observable stocks of 117 mb in April with oil on water rising 53 mb while on shore stocks fell 170 mb. But global stocks are hard to measure with large invisible, unmeasured stocks. As such a back of the envelope approach may be better.
Oil products is what the world is consuming. Oil product prices likely to rise while product stocks fall. Strategic Petroleum Reserves (SPR) are predominantly crude oil. Discharging oil from OECD SPR stocks, a sharp reduction in Chinese crude imports and a reduction in global refinery throughput of 6-7 mb/d has helped to keep crude oil markets satisfactorily supplied. But global inventories are drawing down none the less. And oil products is really what the world is consuming. So if global refinery throughput stays subdued, then demand will eventually have to match the supply of oil products. The likely path forward this summer is a steady draw down in jet fuel, diesel and gasoline. Higher prices for these. Then, if possible, higher refinery throughput and higher usage of crude in response to very profitable refinery margins. And lastly sharper draw in crude stocks and higher prices for these. But some 6 mb/d of oil products used to be exported through the Strait of Hormuz. And it may not be so easy to ramp up refinery activity across the world to compensate. Especially as Ukraine continues to damage Russian refineries as well as Russian crude production and export facilities.
Watch oil product stocks and prices as well as Brent calendar 2027. What to watch for this summer is thus oil product inventories falling and oil product premiums to crude rising. Another measure to watch is the Brent crude 2027 contract as it rises steadily day by day as the Strait of Hormuz stays closed and global oil inventories decline. The latter is close to the highest level since the start of the war and keeps rising.
The Brent M1 contract and the Brent 2027 prices and current price of jet fuel in Europe (ARA). All in USD/b

Our back of the envelope calculation of the global shortage created by the closure of the Strait of Hormuz. Note that 3.5 mb/d of discharge from SPR is also a draw. Note also that ’Forced demand loss’ of 2.5 mb/d is probably temporary and will fall back towards zero as logistics are sorted out leaving ’Price demand loss’ to do the job of balancing the market. Thus a shortfall of at least 9 mb/d created by the closure. More if SPR discharge is included and more if Forced demand loss recedes.

Brent is climbing higher. Front-month is at USD 106.3/bl this morning, close to a weekly high and a USD 9/bl jump from Mondays open. This is the move we flagged as a risk earlier in the week: the market shifting from ”a deal is around the corner” to ”this is going to take longer than we thought”.

Analyst Commodities, SEB
During April, rest-of-year Brent remained remarkably stable around USD 90/bl. A stability which rested on one single assumption: the SoH reopens around 1 May. That assumption is now slowly falling apart.
As we highlighted yesterday: every week of delay beyond 1 May adds (theoretically) ish USD 5/bl to the rest-of-year average, as global inventories draw 100 million barrels per week. i.e., a mid-May reopening implies rest-of-year Brent closer to USD 100/bl, and anything pushing into June or July takes us meaningfully higher.
What’s changed in the last 48 hours:
#1: The US military has formally warned that clearing suspected sea mines from SoH could take up to six months. That is a completely different timescale from what the financial market is pricing. Even a political deal tomorrow does not immediately reopen the strait.
#2: Trump has shifted his tone from urgency to ”strategic patience”. In yesterday’s press conference: ”Don’t rush me… I want a great deal.” The market is reading this as a president no longer feeling pressured by timelines, with the naval blockade running in the background.
#3: So far, the military activity is escalating, not de-escalating. Axios reports Iran is laying more mines in SoH. The US 3rd carrier strike group (USS George H.W. Bush) is arriving with two countermine vessels. Trump yesterday ordered the US Navy to destroy any Iranian boats caught laying mines. While CNN reports that the Pentagon is actively drawing up plans to strike Iranian SoH capabilities and individual Iranian military leaders if the ceasefire collapses. i.e., NOT a attitude consistent with an imminent deal!
Spot crude and product prices eased off the early-April highs on a combination of system rerouting and deal optimism. Both now weakening. Goldman estimates April Gulf output is reduced by 14.5 mbl/d, or 57% of pre-war supply, a number that keeps getting worse the longer this drags on.
Demand-side adaptation is ongoing: S. Korea has cut its Middle East crude dependence from 69% to 56% by pulling more from the Americas and Africa, and Japan is kicking off a second round of SPR releases from 1 May. But SPRs are finite.
Ref. to the negotiations, we should not bet on speed. The current Iranian leadership is dominated by genuine hardliners willing to absorb economic pain and run the clock to extract concessions. That is not a setup for a rapid resolution. US/Israeli media briefings keep framing the delay as ”internal Iranian divisions”, the reality is more complicated and points toward weeks and months, not days.
Our point is that the complexity is large, and higher prices have only just started (given a scenario where the negotiations drag out in time). The market spent April leaning on the USD 90/bl rest-of-year assumption; that case is diminishing by the hour. If ”early May reopening” is replaced by ”June, July or later” over the next week or two, both crude and products have meaningful room to reprice higher from here. There is a high risk being short energy and betting on any immediate political resolution(!).
Down on Friday. Up on Monday. The Brent June crude oil contract traded down 5.1% last week to a close of $90.38/b. It reached a high of $103.87/b last Monday and a low of $86.09/b on Friday as Iran announced that the Strait of Hormuz was fully open for transit. That quickly changed over the weekend as the US upheld its blockade of Iranian oil exports while Iran naturally responded by closing the SoH again. The US blew a hole in the engine room of the Iranian ship TOUSKA and took custody of the ship on Sunday. Brent crude is up 5.6% this morning to $95.4/b.
The cease-fire is expiring tomorrow. The US has said it will send a delegation for a second round of negotiations in Islamabad in Pakistan. But Iran has for now rejected a second round of talks as it views US demands as unrealistic and excessive while the US is also blocking the Strait of Hormuz.
While Brent is up 5% this morning, the financial market is still very optimistic that progress will be made. That talks will continue and that the SoH will fully open by the start of May which is consistent with a rest-of-year average Brent crude oil price of around $90/b with the market now trading that balance at around $88/b.
Financial optimism vs. physical deterioration. We have a divergence where the financial market is trading negotiations, improvements and resolution while at the same time the physical market is deteriorating day by day. Physical oil flows remain constrained by disrupted flows, longer voyage times and elevated freight and insurance costs.
Financial markets are betting that a US/Iranian resolution will save us in time from violent shortages down the road. But every day that the SoH remains closed is bringing us closer to a potentially very painful point of shortages and much higher prices.
The US blockade is also a weapon of leverage against its European and Asian allies. When Iran closed the SoH it held the world economy as a hostage against the US. The US blockade of the SoH is of course blocking Iranian oil exports. But it is also an action of disruption directed towards Europe and Asia. The US has called for the rest of the world to engaged in the war with Iran: ”If you want oil from the Persian Gulf, then go and get it”. A risk is that the US plays brinkmanship with the global oil market directed towards its European and Asian allies and maybe even towards China to force them to engage and take part. Maybe unthinkable. But unthinkable has become the norm with Trump in the White House.


Sommarväder skapar prisrally på elbörsen
Oil product price pain is set to rise as the Strait of Hormuz stays closed into summer

Solkraften pressar elpriserna dagtid

Michel Gubel ger sin syn på oljemarknaden