

Analys
Råvaror efter sommaren

![]() Under sommaren har intresset för råvaror mest handlat om guld och silver i Rio de Janeiro. Det har dock inte hindrat råvarumarknaden från att röra på sig. Oljan har återhämtat sig till nära USD 50 och zink och nickel fortsätter springa ifrån övriga basmetaller. I veckans första brev efter sommaruppehållet sammanfattar vi läget för råvarorna och de teman vi tror man ska fokusera på under hösten.
Under sommaren har intresset för råvaror mest handlat om guld och silver i Rio de Janeiro. Det har dock inte hindrat råvarumarknaden från att röra på sig. Oljan har återhämtat sig till nära USD 50 och zink och nickel fortsätter springa ifrån övriga basmetaller. I veckans första brev efter sommaruppehållet sammanfattar vi läget för råvarorna och de teman vi tror man ska fokusera på under hösten.
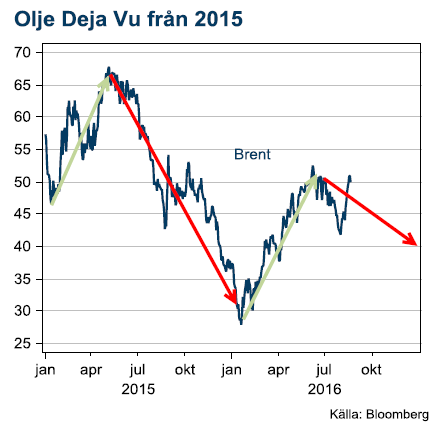
Déjà vu för råolja
Den senaste återhämtningen i oljepriset från USD 40 till USD 50 har drivits av Saudis budskap om ett nytt möte mellan OPEC och Ryssland i september. Syftet med mötet ska vara att frysa produktionen. Marknadsreaktionen har varit kraftig och tolkar antagligen in förhoppningar på en sänkt produktion i steg två.
Vi tror att temat är mycket osäkert, hittills har det visat sig svårt för parterna att komma överrens. En sänkning av produktionen ser vi vidare som mycket osannolik. Det skulle i praktiken medföra att OPEC ger bort en marknadsandel till amerikanska producenter som just börjat vädra morgonluft efter prisuppgången under våren.
 Det är ändock mer sannolikt att parterna når en överenskommelse om att frysa produktionen den här gången. Till skillnad mot förra försöket, i april så har Iran kommit upp i full produktion. Tillsammans med de övriga stora, Saudi och Irak i OPEC och Ryssland utanför OPEC ligger samtliga på eller nära sin rekordproduktion. Det talar för att ingen längre har något att förlora på att frysa produktionen. Samtidigt blir konsekvensen av att frysa på nuvarande nivåer snarare att marknaden tillförs mer olja än mindre. Saudiarabien har nämligen en stark säsongsvariation i sin inhemska oljekonsumtion. Den är som högts under sommarmånaderna då energibehovet för att kyla byggnader är som störst. Om man fryser produktionen på de här nivåerna kommer exporten att öka under kommande vinter när den inhemska efterfrågan når årslägsta.
Oljemarknaden är fortfarande i överskott och vi tror att när uppståndelsen kring OPEC:s kommande extramöte lagt sig så kommer oljan återvända ner till USD 40.
Morgonluft i Texas
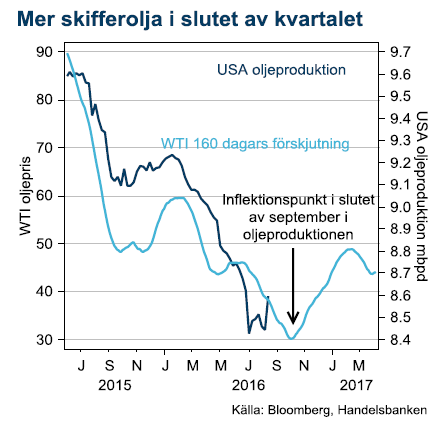 I skifferfälten börjar riggarna ställas tillbaka i produktion efter vårens prisuppgång. Under sju veckor i rad har antalet aktiva borriggar ökat med 80 stycken från en botten i juni på 316.
Pengar var flaskhalsen
Efter en lång period av för lågt oljepris var bristen på pengar i skifferbolagens kassor uppenbar. När priserna steg under våren gav det möjlighet att återuppta produktionen med förbättrad intjäning och tillgång till finansiella marknader. Fler borriggar behöver inte vara den bästa indikatorn på högre oljeproduktion men är ett uppenbart tecken på ökad aktivitet i oljefälten. Det finns massor med redan borrade hål som nu kan sättas i produktion när bolagen har bättre finansiell ställning och ökad produktion från dessa håll syns redan i den veckovisa produktionsstatistiken. Givet det samband som historiskt har gällt mellan en kraftig prisförändring och ökad eller minskad aktivitet i oljefälten så ska oljeproduktion öka i slutet av kvartalet. Produktionen ser redan ut att ha slutat falla så historien kommer sannolikt att upprepa sig.
Riskerna kommer från svaga länder
Vad vi lärt oss under våren är hur känsligt oljepriset blivit för störningar i de länder som lider av låga oljepriser. Nigerias produktion drabbades hårt när staten saknade medel att stödja grupper som snabbt tog till vapen för att förstöra produktionsanläggningar. I Venezuela råder vad som närmst bör beskrivas som en balansakt före kollaps. Dessa två länder ser vi som det största hotet mot låga energipriser. Om produktionen faller bort i något av dem är det tillräckligt för att föra oljemarknaden från överskott till brist.
Stål handlar fortfarande bara om Kina
Det fleråriga temat med kinesisk överproduktion har inte kommit mycket mer än halvvägs. Annonserade nedskärningar tas med en gäspning av marknaden som kräver att bli överbevisad snarare än att köpa på rykten.
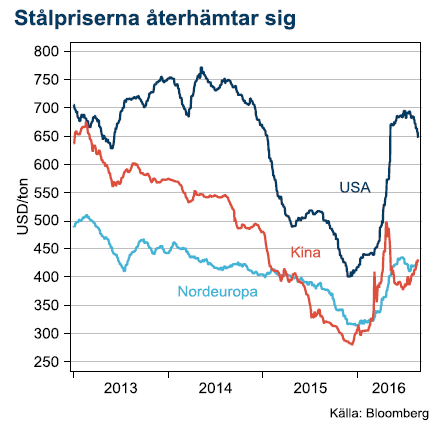 Trots det har saker och ting utvecklats annorlunda detta år. Priserna har stigit både i, och utanför Kina trots att exporttrycket från Kina inte har lättat såsom förhoppningarna var efter höjda tullar i USA och Europa. Istället är det den inhemska marknaden i Kina som förbättrats. Regeringen har stimulerat ekonomin för att dämpa nedgången. I den kampen har man använt sig av en gammal kär medicin, investeringar i infrastruktur. Därmed har prisbilden på stål stärkts och med högre inhemska priser krävs också högre priser på exportmarknaden vilket minskar prispressen från Kinas exportvolymer i USA och Europa.
Under de senaste åren har Kinas minicykler blivit mer frekventa men varat allt kortare i tid. Regeringen agerar mer som brandmän än reformatorer. Vi tror därför inte att återhämtningen på stålpriserna blir så långvarig, kanske inte ens över årsskiftet. Det betyder en ny våg av prispress från Kina för Europa och USA under början av nästa år.
Basmetallerna stiger utan stöd från Kina
De divergerande utsikterna för basmetaller var något som vi uppmärksammade inför det här året. Nu syns tydligt effekterna av skiftande fundamenta i priserna. Zink har stigit 40%, nickel 15% samtidigt som koppar ligger kvar kring nollan.
Zink ligger i en lång stigande trend
En av de mer häpnadsväckande metallerna i år är zink. Till slut har zink tippat över i underskott i marknadsbalansen after att den ältade historien om utbrutna gruvor som stänger ner produktionen. Den första, Australiensiska Century levererade sin sista malm redan före jul men i en marknad som karaktäriseras av svag efterfrågan och höga lager så har det tagit lång tid före den lägre produktionen har gjort ett avryck i priserna.
När vi nu kommit dit tror vi inte att en uppsjö mindre gruvor står redo att öka produktionen för att kompensera. De senaste svältåren för gruvindustrin har gjort proaktiva, marknadsbaserade investeringar sällsynta. Underskottet på zink kommer sannolikt att växa och vi förutser en stark marknad under resten av 2016 och en bra bit in i 2017. Kinesiska smältverk har nyligen höjt betalningen för zinkkoncentrat från gruvorna med 20% till de högsta nivån på fyra år. Ett starkt tecken på den ökade konkurrensen om gruvornas produktion.
Nickel fick hjälp av ny president
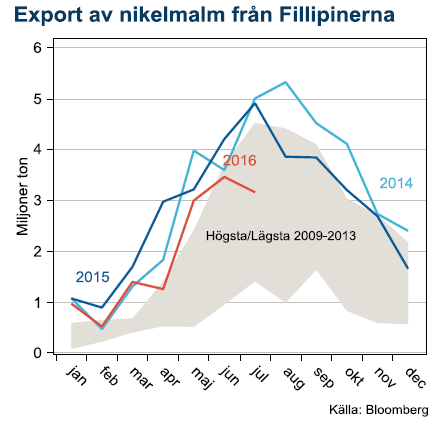 En av de minst väntade vändningarna det här året var nickel. Efter en prisnedgång på 63% sedan Indonesiens exportförbud drev upp priserna till en topp i början av 2014 har priset nu stigit 35% sedan botten i februari. Den här gången beror det inte på Indonesien utan Filipinerna, världens största producent. Landet fick en ny president i månadsskiftet juni/juli och den nya regeringen har gått hårt fram för att strama upp gruvindustrin enligt internationell miljöstandard. Det är en välbehövlig aktion, Filipinerna har tagit mycket av den marknad som Indonesien lämnade under exportförbudet men Filipinerna har ökat produktionen med spontant uppstartad primitiv produktion.
Med mindre produktion från Filipinerna och ett välkänt säsongsmönster där exporten faller dramatiskt under monsunperioden tror vi att det finns en uppsida för nickelpriset. I början av nästa år kommer inte exportvolymerna att öka såsom brukligt och därmed kommer en del av den kinesiska industrin som konsumerar malmen att svältas och tvingas köpa nickel från marknader prissatta mot LME.
Aluminium lyste starkt
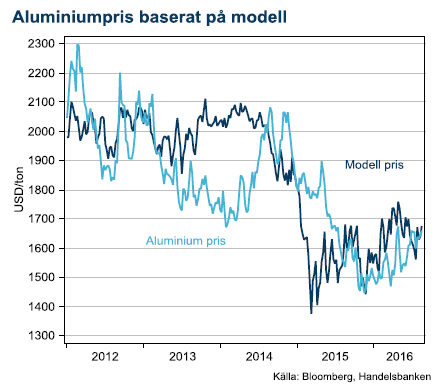 Lättviktsmetallen handlas omkring årshögsta, mestadels beroende på en svagare dollar och starkare oljepris. Modellen vi använder för aluminiumpriset stämmer just nu perfekt med rörelserna i USD och olja. Med vår tror på ett oljepris ner mot USD 40 så bör aluminium falla tillbaka till USD 1500-1550.
Koppar kommer i skymundan
Kärnan i basmetallgruppen har utvecklats klart sämst under året. Kopparpriset är i princip oförändrat trots att Kina har stimulerat ekonomin med den klassiska medicinen infrastrukturella investeringar som ökar efterfrågan på basmetaller. Ny produktion som kommer till marknaden från gruvor vars expansion ligger sent i supercykeln har kompenserat för att produktionsstörningarna i befintliga gruvor stigit till normala nivåer från väldigt låga nivåer under första halvåret.
Vi förväntar oss inte att kopparpriset ska återhämta sig, speciellt inte i ljuset av att de kinesiska stimulanserna kommer minska i betydelse under slutet av året.
Guld och silver efter OS
För ädelmetallerna är uppmärksamheten över efter att de olympiska spelen nått sitt slut. Sedan Fed blev mer mjuka i sin politik redan under våren finns det sannolikt inte mycket överraskningar på den mjuka sidan av räntepolitiken i USA. Brexit skapade den andra överraskningen som drev på guld och silver men nu är Brexit redan historia för de finansiella marknaderna. Vi tycker att det är svårt att hitta liknande drivkrafter framöver och tar en mer neutral syn på guld och silver efter årets kraftiga prisuppgång.
[box]SHB Råvarukommentar är producerat av Handelsbanken och publiceras i samarbete och med tillstånd på Råvarumarknaden.se[/box]
Ansvarsbegränsning
Detta material är producerat av Svenska Handelsbanken AB (publ) i fortsättningen kallad Handelsbanken. De som arbetar med innehållet är inte analytiker och materialet är inte oberoende investeringsanalys. Innehållet är uteslutande avsett för kunder i Sverige. Syftet är att ge en allmän information till Handelsbankens kunder och utgör inte ett personligt investeringsråd eller en personlig rekommendation. Informationen ska inte ensamt utgöra underlag för investeringsbeslut. Kunder bör inhämta råd från sina rådgivare och basera sina investeringsbeslut utifrån egen erfarenhet.
Informationen i materialet kan ändras och också avvika från de åsikter som uttrycks i oberoende investeringsanalyser från Handelsbanken. Informationen grundar sig på allmänt tillgänglig information och är hämtad från källor som bedöms som tillförlitliga, men riktigheten kan inte garanteras och informationen kan vara ofullständig eller nedkortad. Ingen del av förslaget får reproduceras eller distribueras till någon annan person utan att Handelsbanken dessförinnan lämnat sitt skriftliga medgivande. Handelsbanken ansvarar inte för att materialet används på ett sätt som strider mot förbudet mot vidarebefordran eller offentliggörs i strid med bankens regler.


Market is starting to take US/Iran headlines with a pinch of salt. Brent crude rose $2.8/b yesterday to an official close of $112.1/b. But after that it traded as low as $108.05/b before ending late night at around $109.7/b. Through the day it traded in a range of $106.87 – 112.72/b amid a flurry of news or rumors from Iran and the US. ”US temporary sanctions during negotiations” (falls alarm). ”We will bomb Iran” (not anyhow),… etc. While the market is still fluctuating to this kind of news flow, it is starting to take such headlines with a pinch of salt.

We’ll see. Maybe, maybe not. The Brent M1 contract is trading at $110.2/b this morning which very close to the average ticks through yesterday of $110.4/b.
Trump with bearish, verbal intervention whenever Brent trades above $110/b it seems. What seems to be a pattern is that Trump states something like ”very good negotiations going on with Iran”, ”New leaders in Iran are great,..”, ”Great progress in negotiations,…”, ”Deal in sight,..” etc whenever the Brent M1 contract trades above $110/b. An effort to cool the market. These hot air verbal interventions from Trump used to have a heavy bearish impact on prices, but they now seems to have less and less effect unless they are backed by reality.
As far as we can see there has been no real progress in the negotiations between the US and Iran with both sides still standing by their previous demands.
Iran is getting stronger while the cease fire lasts making a return to war for Trump yet harder. Iran is naturally in constant preparation for a return to war given Trump’s steady threats of bombing Iran again. Iran is naturally doing what ever is possible to prepare for a return to war. And every day the cease fire lasts it is better prepared. This naturally makes it more and more difficult and dangerous for the US to return to warring activity versus Iran as the consequences for energy infrastructure in the Persian Gulf will be more and more severe the longer the cease fire lasts. Israel seems to see it this way as well. That the war is not won and that current frozen state of a cease fire gives Iran opportunity to rebuild military and politically.
Global inventories are drawing down day by day. How much? In the meantime the Strait of Hormuz stays closed. There is varying measures and estimates of how much global inventories are drawing down. Our rough estimate, back of the envelope, is that global inventories are drawing down by at least some 10 mb/d or about 300 mb/d in a balance between loss of supply versus demand destruction. Other estimates we see are a monthly draw of 250-270 mb/d. The IEA only ’measured’ a draw in global observable stocks of 117 mb in April with oil on water rising 53 mb while on shore stocks fell 170 mb. But global stocks are hard to measure with large invisible, unmeasured stocks. As such a back of the envelope approach may be better.
Oil products is what the world is consuming. Oil product prices likely to rise while product stocks fall. Strategic Petroleum Reserves (SPR) are predominantly crude oil. Discharging oil from OECD SPR stocks, a sharp reduction in Chinese crude imports and a reduction in global refinery throughput of 6-7 mb/d has helped to keep crude oil markets satisfactorily supplied. But global inventories are drawing down none the less. And oil products is really what the world is consuming. So if global refinery throughput stays subdued, then demand will eventually have to match the supply of oil products. The likely path forward this summer is a steady draw down in jet fuel, diesel and gasoline. Higher prices for these. Then, if possible, higher refinery throughput and higher usage of crude in response to very profitable refinery margins. And lastly sharper draw in crude stocks and higher prices for these. But some 6 mb/d of oil products used to be exported through the Strait of Hormuz. And it may not be so easy to ramp up refinery activity across the world to compensate. Especially as Ukraine continues to damage Russian refineries as well as Russian crude production and export facilities.
Watch oil product stocks and prices as well as Brent calendar 2027. What to watch for this summer is thus oil product inventories falling and oil product premiums to crude rising. Another measure to watch is the Brent crude 2027 contract as it rises steadily day by day as the Strait of Hormuz stays closed and global oil inventories decline. The latter is close to the highest level since the start of the war and keeps rising.
The Brent M1 contract and the Brent 2027 prices and current price of jet fuel in Europe (ARA). All in USD/b

Our back of the envelope calculation of the global shortage created by the closure of the Strait of Hormuz. Note that 3.5 mb/d of discharge from SPR is also a draw. Note also that ’Forced demand loss’ of 2.5 mb/d is probably temporary and will fall back towards zero as logistics are sorted out leaving ’Price demand loss’ to do the job of balancing the market. Thus a shortfall of at least 9 mb/d created by the closure. More if SPR discharge is included and more if Forced demand loss recedes.

Brent is climbing higher. Front-month is at USD 106.3/bl this morning, close to a weekly high and a USD 9/bl jump from Mondays open. This is the move we flagged as a risk earlier in the week: the market shifting from ”a deal is around the corner” to ”this is going to take longer than we thought”.

Analyst Commodities, SEB
During April, rest-of-year Brent remained remarkably stable around USD 90/bl. A stability which rested on one single assumption: the SoH reopens around 1 May. That assumption is now slowly falling apart.
As we highlighted yesterday: every week of delay beyond 1 May adds (theoretically) ish USD 5/bl to the rest-of-year average, as global inventories draw 100 million barrels per week. i.e., a mid-May reopening implies rest-of-year Brent closer to USD 100/bl, and anything pushing into June or July takes us meaningfully higher.
What’s changed in the last 48 hours:
#1: The US military has formally warned that clearing suspected sea mines from SoH could take up to six months. That is a completely different timescale from what the financial market is pricing. Even a political deal tomorrow does not immediately reopen the strait.
#2: Trump has shifted his tone from urgency to ”strategic patience”. In yesterday’s press conference: ”Don’t rush me… I want a great deal.” The market is reading this as a president no longer feeling pressured by timelines, with the naval blockade running in the background.
#3: So far, the military activity is escalating, not de-escalating. Axios reports Iran is laying more mines in SoH. The US 3rd carrier strike group (USS George H.W. Bush) is arriving with two countermine vessels. Trump yesterday ordered the US Navy to destroy any Iranian boats caught laying mines. While CNN reports that the Pentagon is actively drawing up plans to strike Iranian SoH capabilities and individual Iranian military leaders if the ceasefire collapses. i.e., NOT a attitude consistent with an imminent deal!
Spot crude and product prices eased off the early-April highs on a combination of system rerouting and deal optimism. Both now weakening. Goldman estimates April Gulf output is reduced by 14.5 mbl/d, or 57% of pre-war supply, a number that keeps getting worse the longer this drags on.
Demand-side adaptation is ongoing: S. Korea has cut its Middle East crude dependence from 69% to 56% by pulling more from the Americas and Africa, and Japan is kicking off a second round of SPR releases from 1 May. But SPRs are finite.
Ref. to the negotiations, we should not bet on speed. The current Iranian leadership is dominated by genuine hardliners willing to absorb economic pain and run the clock to extract concessions. That is not a setup for a rapid resolution. US/Israeli media briefings keep framing the delay as ”internal Iranian divisions”, the reality is more complicated and points toward weeks and months, not days.
Our point is that the complexity is large, and higher prices have only just started (given a scenario where the negotiations drag out in time). The market spent April leaning on the USD 90/bl rest-of-year assumption; that case is diminishing by the hour. If ”early May reopening” is replaced by ”June, July or later” over the next week or two, both crude and products have meaningful room to reprice higher from here. There is a high risk being short energy and betting on any immediate political resolution(!).
Down on Friday. Up on Monday. The Brent June crude oil contract traded down 5.1% last week to a close of $90.38/b. It reached a high of $103.87/b last Monday and a low of $86.09/b on Friday as Iran announced that the Strait of Hormuz was fully open for transit. That quickly changed over the weekend as the US upheld its blockade of Iranian oil exports while Iran naturally responded by closing the SoH again. The US blew a hole in the engine room of the Iranian ship TOUSKA and took custody of the ship on Sunday. Brent crude is up 5.6% this morning to $95.4/b.
The cease-fire is expiring tomorrow. The US has said it will send a delegation for a second round of negotiations in Islamabad in Pakistan. But Iran has for now rejected a second round of talks as it views US demands as unrealistic and excessive while the US is also blocking the Strait of Hormuz.
While Brent is up 5% this morning, the financial market is still very optimistic that progress will be made. That talks will continue and that the SoH will fully open by the start of May which is consistent with a rest-of-year average Brent crude oil price of around $90/b with the market now trading that balance at around $88/b.
Financial optimism vs. physical deterioration. We have a divergence where the financial market is trading negotiations, improvements and resolution while at the same time the physical market is deteriorating day by day. Physical oil flows remain constrained by disrupted flows, longer voyage times and elevated freight and insurance costs.
Financial markets are betting that a US/Iranian resolution will save us in time from violent shortages down the road. But every day that the SoH remains closed is bringing us closer to a potentially very painful point of shortages and much higher prices.
The US blockade is also a weapon of leverage against its European and Asian allies. When Iran closed the SoH it held the world economy as a hostage against the US. The US blockade of the SoH is of course blocking Iranian oil exports. But it is also an action of disruption directed towards Europe and Asia. The US has called for the rest of the world to engaged in the war with Iran: ”If you want oil from the Persian Gulf, then go and get it”. A risk is that the US plays brinkmanship with the global oil market directed towards its European and Asian allies and maybe even towards China to force them to engage and take part. Maybe unthinkable. But unthinkable has become the norm with Trump in the White House.


Sommarväder skapar prisrally på elbörsen
Oil product price pain is set to rise as the Strait of Hormuz stays closed into summer

Solkraften pressar elpriserna dagtid

Michel Gubel ger sin syn på oljemarknaden