

Analys
Orange juice: Declining supply meets weak demand
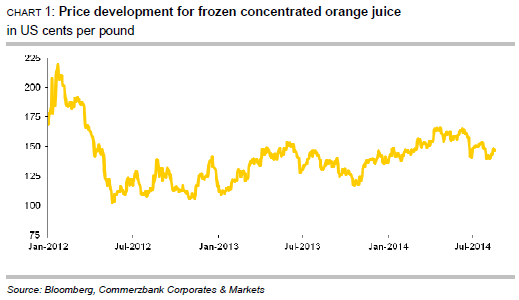
![]() In oranges and orange juice, the outlook for both supply and demand is dim. Especially in the US, a declining supply will meet with softening demand. Supply concerns were in focus for months, causing prices to rise. But disappointing US consumption data and a lack of strong storms in the south of the US turned the price movement around in the summer. Prices were able to regain ground recently as estimates see Florida’s harvest as from October at a 50-year low and California is supposed to harvest fewer oranges as well. The price for frozen concentrated orange juice, which strongly depends on the US market, will probably continue to fluctuate for a long while, driven by declining supply and similarly declining demand.
In oranges and orange juice, the outlook for both supply and demand is dim. Especially in the US, a declining supply will meet with softening demand. Supply concerns were in focus for months, causing prices to rise. But disappointing US consumption data and a lack of strong storms in the south of the US turned the price movement around in the summer. Prices were able to regain ground recently as estimates see Florida’s harvest as from October at a 50-year low and California is supposed to harvest fewer oranges as well. The price for frozen concentrated orange juice, which strongly depends on the US market, will probably continue to fluctuate for a long while, driven by declining supply and similarly declining demand.
Prices for frozen concentrated orange juice on the New York exchange have not been able to sustain their month-long uptrend that was intact until June. Instead, they dropped by more than 15% between the middle of June and the first days of August. Only at the current margin could the quotations regain some ground, rising from 139 US cents to nearly 150 US cents per pound. Though the two-year high of mid-June at 167 US cents per pound is still some ways away (chart 1).
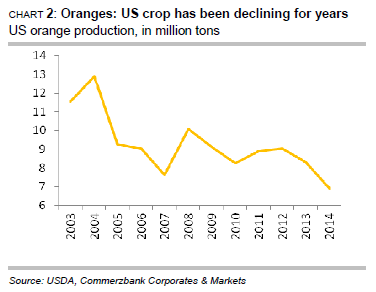
The focus was therefore very much on the supply side. The month-long price rise until June had been triggered by prospects of a lower US supply. In fact, the last harvest in the US was already unsatisfactory. In its July report the USDA once more reduced its estimate for the 2013/14 US harvest compared to its last forecast from January. It now envisages only 6.3 million tons of oranges, 16% less than in 2012/13 (chart 2). This is the second large consecutive decline. The plant disease citrus greening, which causes the fruit to drop prematurely, still maintains its grip on large parts of the growing regions. As a result of the lower harvest, US orange juice production should come in at 481,000 tons, 20% below 2012/13 levels, which were already lower than in the previous year.
 Moreover, the drought in Brazil spurred doubts as to whether rising production in Brazil would be able to compensate for the decline in the US. For Brazil, the USDA had predicted in January that the 2013/14 orange harvest would increase by 8.5%, but this forecast was cut to 6% in July. This still remarkable rise is largely attributable to high yields. The quantity of oranges used for processing is seen to rise at a similarly strong rate. As a result, Brazil’s orange juice production, which had fallen massively by almost a quarter in 2012/13, is now expected to post a 12% increase.
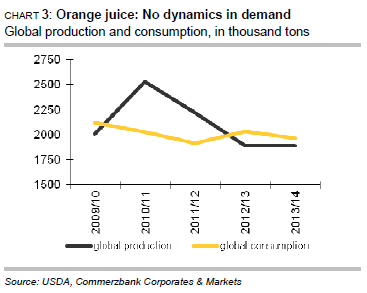
Unlike global orange production itself, where growth not only in Brazil but also in China will probably more than offset the decline in the US, global orange juice production should stagnate in 2013/14 in the best case according to the USDA. Juice production had already declined in the two preceding years.
However, not only juice production but also the consumption of orange juice is lacking momentum. Global consumption has for years been fluctuating around the mark of 2 million tons (chart 3). Consumption is clearly declining in the US – the most important market alongside the EU. US per-capita consumption of orange juice has reportedly fallen from 46 litres ten years ago to only 35 litres in 2013. According to latest data, US retailers sold 9% less orange juice than one year before in the four weeks ending on 2 August 2014. A wide range of other juices and new developments in other beverages are now competing with orange juice. Also, many consumers prefer beverages with lower sugar content or lower prices. In other developed countries, too, the market for orange juice should be largely saturated. Double-digit growth rates in some other countries, such as China, for instance, cannot reverse this outlook, given the low absolute figures.
 But the market is now looking less at the current year 2013/14 than at the coming season. The year 2014/2015 as measured by the USDA begins in October or November in countries in the northern hemisphere. In Brazil, by far the most important country in the southern hemisphere, it even only starts in July 2015. The first USDA forecasts are only expected for autumn. In the US, the orange harvest for 2014/15 should thus get underway in a few weeks. Prospects are far from promising. Estimates are circulating according to which Florida’s orange production, which normally accounts for about 70% of total US production, could fall to less than 90 million boxes of 90 pounds (or 40.8 kilograms) each. This would be less than 3.7 million tons, i.e. the lowest level since 1965. Since according to latest USDA data, Florida harvested 133.6 million boxes in 2012/13 and 104.4 million boxes in 2013/14, this would be a fall by about another 15% compared with the already weak current year. Not all watchers anticipate such a dramatic situation. But there is broad agreement that the harvest will likely remain below 100 million boxes. In California, the only other important growing state in the US, the drought will presumably leave its mark. The situation there has been difficult since 2012 and has become further exacerbated in recent weeks, and more than half of the acreage currently falls in the highest category of “exceptional drought”. The critical outlook for US production has recently given prices a bit of a lift.
It remains to be seen whether in the present situation of weak demand the continuing decline in supply can contribute to noticeable price rises on a lasting basis. We only expect this to happen if supply shortfalls attributable to storms or diseases turn out even larger than currently expected. Fears of a marked hurricane season have driven up prices often already. This year has been relatively calm so far, but the hurricane season only ends in November. Hence, stormrelated crop losses in Florida are still a possibility.

Brent crude has climbed roughly USD 1.5-2 per barrel since Friday, yet falling USD 0.3 per barrel this mornig and currently trading near USD 67.25/bbl after yesterday’s climb. While the rally reflects short-term geopolitical tension, price action has been choppy, and crude remains locked in a broader range – caught between supply-side pressure and spot resilience.

Prices have been supported by renewed Ukrainian drone strikes targeting Russian infrastructure. Over the weekend, falling debris triggered a fire at the 20mtpa Kirishi refinery, following last week’s attack on the key Primorsk terminal.
Argus estimates that these attacks have halted ish 300 kbl/d of Russian refining capacity in August and September. While the market impact is limited for now, the action signals Kyiv’s growing willingness to disrupt oil flows – supporting a soft geopolitical floor under prices.
The political environment is shifting: the EU is reportedly considering sanctions on Indian and Chinese firms facilitating Russian crude flows, while the U.S. has so far held back – despite Bessent warning that any action from Washington depends on broader European participation. Senator Graham has also publicly criticized NATO members like Slovakia and Hungary for continuing Russian oil imports.
It’s worth noting that China and India remain the two largest buyers of Russian barrels since the invasion of Ukraine. While New Delhi has been hit with 50% secondary tariffs, Beijing has been spared so far.
Still, the broader supply/demand balance leans bearish. Futures markets reflect this: Brent’s prompt spread (gauge of near-term tightness) has narrowed to the current USD 0.42/bl, down from USD 0.96/bl two months ago, pointing to weakening backwardation.
This aligns with expectations for a record surplus in 2026, largely driven by the faster-than-anticipated return of OPEC+ barrels to market. OPEC+ is gathering in Vienna this week to begin revising member production capacity estimates – setting the stage for new output baselines from 2027. The group aims to agree on how to define “maximum sustainable capacity,” with a proposal expected by year-end.
While the IEA pegs OPEC+ capacity at 47.9 million barrels per day, actual output in August was only 42.4 million barrels per day. Disagreements over data and quota fairness (especially from Iraq and Nigeria) have already delayed this process. Angola even quit the group last year after being assigned a lower target than expected. It also remains unclear whether Russia and Iraq can regain earlier output levels due to infrastructure constraints.
Also, macro remains another key driver this week. A 25bp Fed rate cut is widely expected tomorrow (Wednesday), and commodities in general could benefit a potential cut.
Summing up: Brent crude continues to drift sideways, finding near-term support from geopolitics and refining strength. But with surplus building and market structure softening, the upside may remain capped.
Brent crude is essentially flat on the week, but after a volatile ride. Prices started Monday near USD 65.5/bl, climbed steadily to a mid-week high of USD 67.8/bl on Wednesday evening, before falling sharply – losing about USD 2/bl during Thursday’s session.
Brent is currently trading around USD 65.8/bl, right back where it began. The volatility reflects the market’s ongoing struggle to balance growing surplus risks against persistent geopolitical uncertainty and resilient refined product margins. Thursday’s slide snapped a three-day rally and came largely in response to a string of bearish signals, most notably from the IEA’s updated short-term outlook.
The IEA now projects record global oversupply in 2026, reinforcing concerns flagged earlier by the U.S. EIA, which already sees inventories building this quarter. The forecast comes just days after OPEC+ confirmed it will continue returning idle barrels to the market in October – albeit at a slower pace of +137,000 bl/d. While modest, the move underscores a steady push to reclaim market share and adds to supply-side pressure into year-end.
Thursday’s price drop also followed geopolitical incidences: Israeli airstrikes reportedly targeted Hamas leadership in Doha, while Russian drones crossed into Polish airspace – events that initially sent crude higher as traders covered short positions.
Yet, sentiment remains broadly cautious. Strong refining margins and low inventories at key pricing hubs like Europe continue to support the downside. Chinese stockpiling of discounted Russian barrels and tightness in refined product markets – especially diesel – are also lending support.
On the demand side, the IEA revised up its 2025 global demand growth forecast by 60,000 bl/d to 740,000 bl/d YoY, while leaving 2026 unchanged at 698,000 bl/d. Interestingly, the agency also signaled that its next long-term report could show global oil demand rising through 2050.
Meanwhile, OPEC offered a contrasting view in its latest Monthly Oil Market Report, maintaining expectations for a supply deficit both this year and next, even as its members raise output. The group kept its demand growth estimates for 2025 and 2026 unchanged at 1.29 million bl/d and 1.38 million bl/d, respectively.
We continue to watch whether the bearish supply outlook will outweigh geopolitical risk, and if Brent can continue to find support above USD 65/bl – a level increasingly seen as a soft floor for OPEC+ policy.
Brent crude makes some gains as Israel’s attack on Hamas in Qatar rattles markets. Brent crude spiked to a high of USD 67.38/b yesterday as Israel made a strike on Hamas in Qatar. But it wasn’t able to hold on to that level and only closed up 0.6% in the end at USD 66.39/b. This morning it is starting on the up with a gain of 0.9% at USD 67/b. Still rattled by Israel’s attack on Hamas in Qatar yesterday. Brent is getting some help on the margin this morning with Asian equities higher and copper gaining half a percent. But the dark cloud of surplus ahead is nonetheless hanging over the market with Brent trading two dollar lower than last Tuesday.

Geopolitical risk premiums in oil rarely lasts long unless actual supply disruption kicks in. While Israel’s attack on Hamas in Qatar is shocking, the geopolitical risk lifting crude oil yesterday and this morning is unlikely to last very long as such geopolitical risk premiums usually do not last long unless real disruption kicks in.
US API data yesterday indicated a US crude and product stock build last week of 3.1 mb. The US API last evening released partial US oil inventory data indicating that US crude stocks rose 1.3 mb and middle distillates rose 1.5 mb while gasoline rose 0.3 mb. In total a bit more than 3 mb increase. US crude and product stocks usually rise around 1 mb per week this time of year. So US commercial crude and product stock rose 2 mb over the past week adjusted for the seasonal norm. Official and complete data are due today at 16:30.
A 2 mb/week seasonally adj. US stock build implies a 1 – 1.4 mb/d global surplus if it is persistent. Assume that if the global oil market is running a surplus then some 20% to 30% of that surplus ends up in US commercial inventories. A 2 mb seasonally adjusted inventory build equals 286 kb/d. Divide by 0.2 to 0.3 and we get an implied global surplus of 950 kb/d to 1430 kb/d. A 2 mb/week seasonally adjusted build in US oil inventories is close to noise unless it is a persistent pattern every week.
US IEA STEO oil report: Robust surplus ahead and Brent averaging USD 51/b in 2026. The US EIA yesterday released its monthly STEO oil report. It projected a large and persistent surplus ahead. It estimates a global surplus of 2.2 m/d from September to December this year. A 2.4 mb/d surplus in Q1-26 and an average surplus for 2026 of 1.6 mb/d resulting in an average Brent crude oil price of USD 51/b next year. And that includes an assumption where OPEC crude oil production only averages 27.8 mb/d in 2026 versus 27.0 mb/d in 2024 and 28.6 mb/d in August.
Brent will feel the bear-pressure once US/OECD stocks starts visible build. In the meanwhile the oil market sits waiting for this projected surplus to materialize in US and OECD inventories. Once they visibly starts to build on a consistent basis, then Brent crude will likely quickly lose altitude. And unless some unforeseen supply disruption kicks in, it is bound to happen.
US IEA STEO September report. In total not much different than it was in January

US IEA STEO September report. US crude oil production contracting in 2026, but NGLs still growing. Close to zero net liquids growth in total.


Tyskland har så höga elpriser att företag inte har råd att använda elektricitet
Brent crude ticks higher on tension, but market structure stays soft

Kinas elproduktion slog nytt rekord i augusti, vilket även kolkraft gjorde

Det stigande guldpriset en utmaning för smyckesköpare

Aktier i guldbolag laggar priset på guld

Meta bygger ett AI-datacenter på 5 GW och 2,25 GW gaskraftverk
Aker BP gör ett av Norges största oljefynd på ett decennium, stärker resurserna i Yggdrasilområdet
Brent sideways on sanctions and peace talks

Ett samtal om koppar, kaffe och spannmål
Sommarens torka kan ge högre elpriser i höst
-
 Nyheter4 veckor sedan
Meta bygger ett AI-datacenter på 5 GW och 2,25 GW gaskraftverk
-
 Nyheter4 veckor sedan
Aker BP gör ett av Norges största oljefynd på ett decennium, stärker resurserna i Yggdrasilområdet
-
Analys4 veckor sedan
Brent sideways on sanctions and peace talks
-
 Nyheter4 veckor sedan
Ett samtal om koppar, kaffe och spannmål
-
 Nyheter4 veckor sedan
Sommarens torka kan ge högre elpriser i höst
-
Analys4 veckor sedan
Brent edges higher as India–Russia oil trade draws U.S. ire and Powell takes the stage at Jackson Hole
-

 Nyheter3 veckor sedan
Mahvie Minerals är verksamt i guldrikt område i Finland
-
Analys3 veckor sedan
Increasing risk that OPEC+ will unwind the last 1.65 mb/d of cuts when they meet on 7 September