

Analys
Kinafrossa inför 2018 – Råvaruplanket

![]() Kina och OPEC-feber 2017
Kina och OPEC-feber 2017
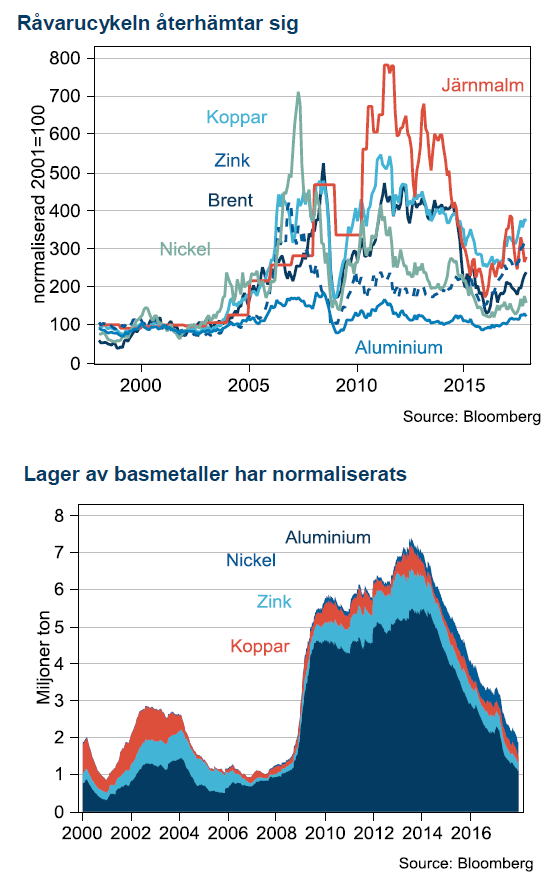
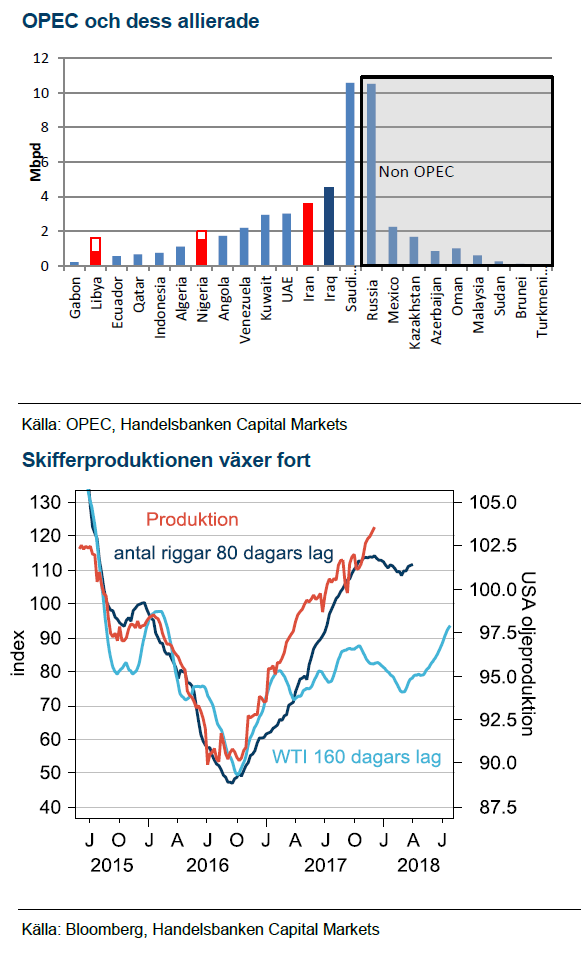
Råvarupriser har stigit markant under 2017, främst är det basmetallkomplexet som handlas omkring 20% högre sedan Kinas ekonomi utvecklats starkt i bakvattnet av 2015 och 16 års stimulanser. Oljepriset har också stigit, dock bara 8% över året men 35% sedan årets botten i juni. För olja har de fallande globala lagernivåerna varit avgörande, marknadens betydande överskott ser ut att var under avveckling och balans närmar sig. OPEC har fått hela äran och förlängningen av OPEC-avtalet hyllades av marknaden.
 Kinafrossa 2018
Vi tror att Kinas pågående produktionsreform kommer vara en mer långsiktig, strukturell förändring i råvarumarknaden än vad som initialt annonserats. Genom att minska på överproduktionen av vissa råvaror kan Kina slå två flugor i en smäll: lönsamheten stiger för de producenter som får vara kvar och luften blir bättre vilket gynnar alla.
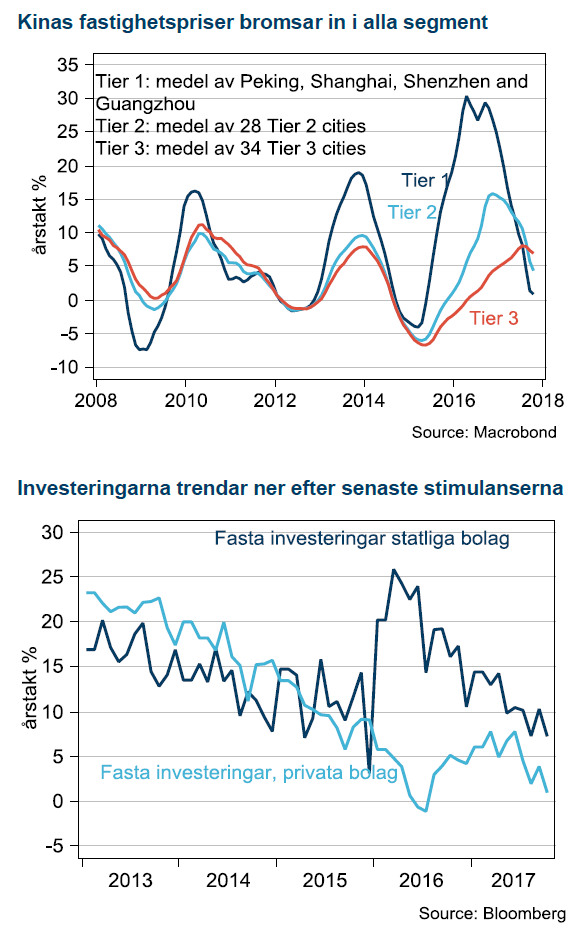
Trots det ser första halvåret 2018 kritiskt ut för Kina. Stimulansinjektionen har slutat verka, uppgången i bostadspriserna har stannat av i de stora städerna, investeringarna har minskat både från statliga och privata bolag. Mer stimulanser kommer säkert men först måste det blir sämre, vilket betyder att nästa stimulansvåg är att vänta tidigast andra halvåret 2018. Fram till dess ser vi risk för tillfällig dipp i basmetaller.
Motvind i öknen
Även oljepriset står inför en nedgång när säsongsmönstret för den påbörjade lagernedgången byter rikting och börjar stiga under första kvartalet. Skifferoljan står också inför ökad aktivitet när höstens högre oljepris slår igenom med början i fler riggar till fälten. Vi har ett oljepris på USD 51 för 2018.
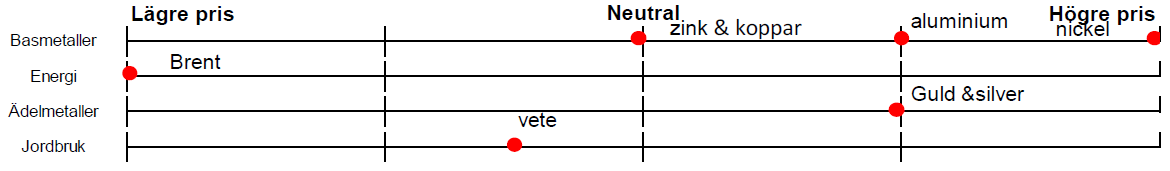
Vår syn för Q1-Q2 2018:
Basmetaller
 Striktare plan för luftföroreningar
Vi argumenterar för att när regeringen väl lyckats få en del av kapaciteten ur produktion så kommer den inte tillbaka. Det sammanfaller med regeringens långsiktiga mål att få bort olönsam småskalig produktion i miljöbelastande segment samtidigt som det gynnar de producenter som får vara kvar och säljer till högre pris.
Oron för Kina är makrobaserad och utbudsreformerna kommer sannolikt bara delvis hålla emot. Uppgången i fastighetspriserna har bromsat in, initialt kontrollerat, men nu växer oron för att de ska börja falla. Tillväxten i investeringar faller också efter snart två år utan stimulanser. Oron i investerarkollektivet växer då president Xi Jingping inte ”pratat upp” tillväxten, snarare motsatsen genom att säga att Kina prioriterar tillväxt av bättre kvalité.
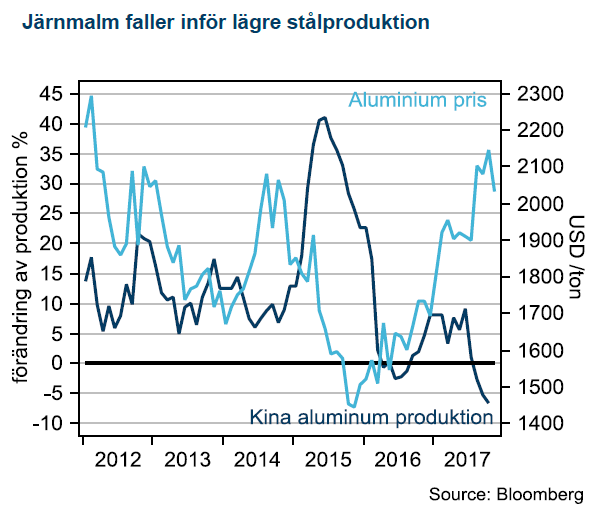
Aluminium gynnas av produktionsreformer
Aluminium är den basmetall som gynnas mest av omstrukturering i Kinas produktion likt den i stålindustrin. Det skulle innebära mindre produktion från de olönsamma verken under den kommande vintern. Vi har USD 2175 som medelprognos för 2018.
Zinkrallyt har planat ut
Även för zink finns det viss påverkan från nedstängningar i Kina men med zink över USD 3000 ser vi ökad risk från mer produktion till marknaden plus makrorisk från Kina på efterfrågan. Vi har USD 2960 som medelprognos 2018.
 Nickel – volatil men intressant
Bland metaller som både drabbas av Kinas stängningar och rider på elbilsrevolutionen finns en tydlig stjärna och det är nickel. Metallens höga volatilitet gör dock att det är en nervös exponering. Vi har USD 13000 som medelprognos 2018.
Koppar – stöd i cykeln men makroexponerad
Koppar är den basmetall där de senaste årens låga investeringar börjar göra sig påmind genom en allt tunnare projektpipeline. Tillsammans med en högre påverkan från utbudsstörningar tror vi att koppar, rent cykliskt kan få bättre stöd framöver. På den negativa sidan är koppar fortfarande den metall som har högst Kinaexponering och speciellt mot fastighetsmarknaden. Vi har USD 6325 som medelprognos 2018.
Energi
 Brent på tvåårshögsta
Sommarens amerikanska ”driving season” blev startskottet på höstens oljeprisuppgång. På grund av att USA är en så stor del av globala lager har även de globala fallit som konsekvens av USA:s driving season och ökade export. Trots det har inte lagernivåerna kommit ner till normala nivåer, som är OPEC:s mål i den nuvarande kampanjen. Dessutom har Venezuelas kaosartade finansiella situation och Kronprins MBS framfart under antikorruptionskampanjen adderat en ordentlig riskpremie i oljepriset.
Skifferoljan är vinnare
I vår modell, som tjänat oss väl sedan oljekollapsen 2014, kommer antalet riggar att öka framöver som effekt av oljepriset vände i juli. Oljepriset leder produktionen med omkring 160 dagar och antalet riggar i oljefälten leder produktionen med omkring 80 dagar. Båda dessa ledande indikatorer talat nu för att produktionen kommer stiga under H1 2018.
OPEC-avtalet en tom gest
Även om OPEC har överraskat både oss och marknaden med bättre genomförande av de avtalade produktionssänkningarna än historiskt så tycker vi allt för mycket av lagernedgången tillskrivs OPEC. Ryssland sänker från rekordhöga nivåer som referenspunkt och mycket av sänkningarna utanför Saudiarabien är mer att betrakta som passiva sänkningar än aktiva. De fallande lagren är också en säsongsfaktor som kommer jobba mot OPEC under första kvartalet och vi tror då att oljan handlas ner mot USD 50 igen.
Slutet på avtalet under 2018
Under nästa år kommer fokus på tiden efter OPEC-avtalet att växa: Ryssland har understrukit att man vill ut ur avtalet så fort marknaden är i balans. Vårt mer negativa makroscenario för Kina kommer också att underminera priset när efterfrågan där inte motsvara förväntningarna. Vårt huvudscenario för nästa år är att USA adderar omkring 10 riggar per vecka under första halvåret, OPEC tar ingen ny riktning vid nästa OPEC-möte den 22a juni. Vid OPEC mötet i nov/dec avslutas avtalet och vi tror Brentoljan handlas på USD 51/fat i medel. Den största risken för vårt scenario ser vi i en finansiell kollaps i Venezuela som spiller över på oljeproduktionen eller mer aktivt motstånd bland saudiske prins MBS rivaler.
Ädelmetaller
 Guldet väntar på Italien
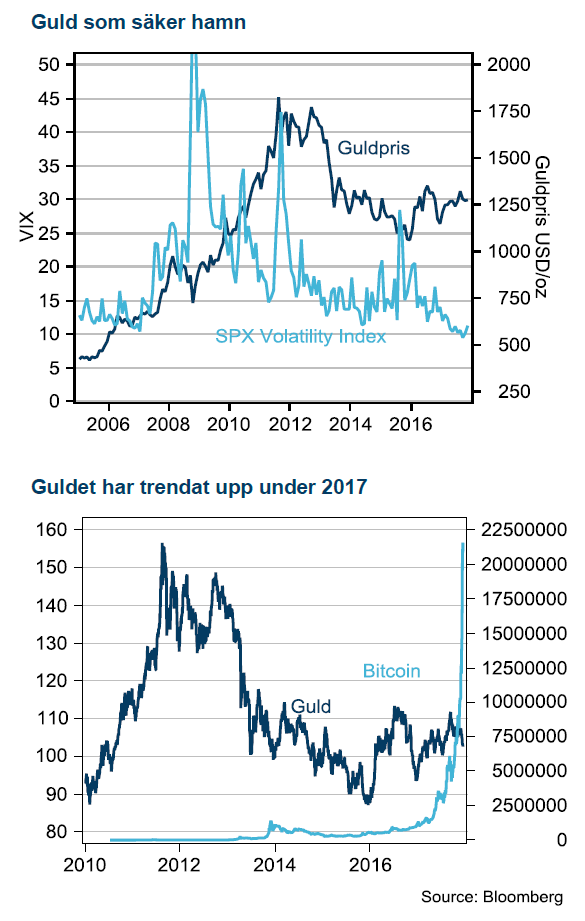
Guldpriset har stigit 8% i år och fått en mycket tydligare koppling till risk och oro. Största hickan på senare år kom 2016 under Brexitomröstningen men utan stöd av vidare oro i aktiemarknaden har guld fallit tillbaka igen. Nordkoreas vapenskrammel har också fått guld att stiga men senaste tiden har guld pressats av en allt starkare USD och fortsatt frammarsch med räntehöjningar från Fed. Nästa val i raden är Italien som ska vara klart senast i maj nästa år men konsensusbilden verkar vara att det kommer inträffa i april. Just nu verkar Italiensk politik vara utanför marknadens radar då Italiensk statistik varit relativt bra på senaste tiden. Vi ser dock en tydlig risk att italiensk, EU-fientlig politik blossar upp igen i början av nästa år.
Utkonkurrerad av Bitcoin
Under det senaste året har dock guld fått stark konkurrens av bitcoin som alternativ tillgång och motvikt till det etablerade monetära systemet. Bitcoins har stigit på ett vis som inte går att relatera till traditionella risktillgångar och tilltalar delvis en liknande publik som guldinvesterare.
Fed höjer vidare
USA tror vi har mindre betydelse för guld framöver. Fed har genomfört fem höjningar som passerat marknaden utan något problem. Trots Fed:s optimistiska syn på konjunkturen räknar vi med att de finansiella förhållandena försämras framöver. Vår prognos är att Fed slutar höja styrräntan 2018 efter höjning i mars och september, därefter drabbas USA av lågkonjunktur 2019. I det scenariot står guld kvar som en fast tillgång som investerare gillar.
Jordbruk
 Neutrala utsikter för vete
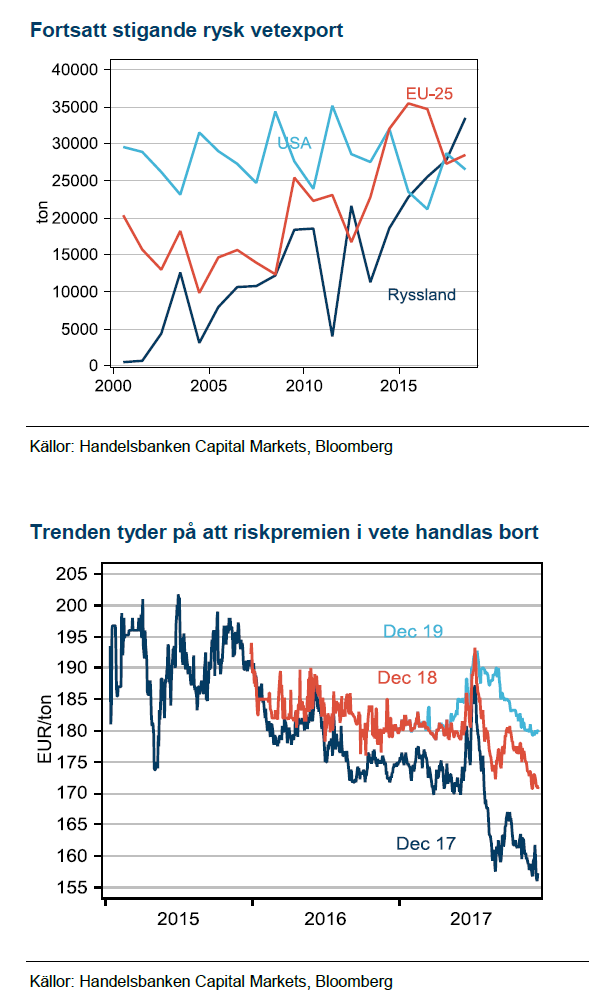
Under de senaste två åren har vi argumenterat för att riskerna inför skörd skapar en osäkerhet som driver riskpremien för högt och när skörden väl landat i lagerhusen pyser riskpremien ut igen. Temat upprepade sig och vi handlar nu väldigt nära vårt riktmärke för decemberterminen i intervallet mot 160-165 EUR/ton.
Ryssland fortsätter sätta press
Förra året blev Rysslands höga veteexport ett sänke för MATIF-priserna. Det blev en repris i år. Vi ser också en stor sannolikhet för en repris 2018. USA kommer visserligen minska arealen ytterligare med kanske 2-3% efter att ha minskat den med 8,5% i år. Ryssland kommer å andra sidan odla konstant areal och skicket på höstsådda vetet är bättre än vid samma tid förra året. Australiens avkastning blev i år 40% lägre, 1,69 ton/ha mot 2,5 normalt. Vi tror att den skörden kommer normaliseras och sammantaget talar därför utsikterna för 2018 för en repris där decemberterminen förfaller omkring 160 EUR/ton även 2018.
[box]Handelsbankens råvarukommentar är producerad av Handelsbanken och publiceras i samarbete och med tillstånd på Råvarumarknaden.se[/box]
Ansvarsbegränsning
Handelsbanken Capital Markets, som är en division inom Svenska Handelsbanken AB (publ) (i fortsättningen kallad ”SHB”), är ansvarig för sammanställningen av analysrapporter. I Sverige står SHB under tillsyn av Finansinspektionen, i Norge av norska Finansinspektionen, i Finland av finska Finansinspektionen och i Danmark av danska Finansinspektionen. Alla analysrapporter bygger på information från handels- och statistiktjänster och annan information som SHB bedömt vara tillförlitlig. SHB har emellertid inte själv verifierat informationen och kan inte garantera att informationen är sann, korrekt eller fullständig. I den mån lagen tillåter tar varken SHB, styrelseledamöter, tjänstemän eller medarbetare, eller någon annan person, ansvar för någon som helst förlust, oavsett om den uppstår till följd av användning av en analysrapport eller dess innehåll eller på annat sätt uppstår i anslutning till något i denna.


Some rebound but not much. Brent crude rebounded 1.5% yesterday to $65.47/b. This morning it is inching 0.2% up to $65.6/b. The lowest close last week was on Thursday at $64.11/b.

The curve structure is almost as week as it was before the weekend. The rebound we now have gotten post the message from OPEC+ over the weekend is to a large degree a rebound along the curve rather than much strengthening at the front-end of the curve. That part of the curve structure is almost as weak as it was last Thursday.
We are still on a weakening path. The message from OPEC+ over the weekend was we are still on a weakening path with rising supply from the group. It is just not as rapidly weakening as was feared ahead of the weekend when a quota hike of 500 kb/d/mth for November was discussed.
The Brent curve is on its way to full contango with Brent dipping into the $50ies/b. Thus the ongoing weakening we have had in the crude curve since the start of the year, and especially since early June, will continue until the Brent crude oil forward curve is in full contango along with visibly rising US and OECD oil inventories. The front-month Brent contract will then flip down towards the $60/b-line and below into the $50ies/b.
At what point will OPEC+ turn to cuts? The big question then becomes: When will OPEC+ turn around to make some cuts? At what (price) point will they choose to stabilize the market? Because for sure they will. Higher oil inventories, some more shedding of drilling rigs in US shale and Brent into the 50ies somewhere is probably where the group will step in.
There is nothing we have seen from the group so far which indicates that they will close their eyes, let the world drown in oil and the oil price crash to $40/b or below.
The message from OPEC+ is also about balance and stability. The world won’t drown in oil in 2026. The message from the group as far as we manage to interpret it is twofold: 1) Taking back market share which requires a lower price for non-OPEC+ to back off a bit, and 2) Oil market stability and balance. It is not just about 1. Thus fretting about how we are all going to drown in oil in 2026 is totally off the mark by just focusing on point 1.
When to buy cal 2026? Before Christmas when Brent hits $55/b and before OPEC+ holds its last meeting of the year which is likely to be in early December.
Brent crude oil prices have rebounded a bit along the forward curve. Not much strengthening in the structure of the curve. The front-end backwardation is not much stronger today than on its weakest level so far this year which was on Thursday last week.

The front-end backwardation fell to its weakest level so far this year on Thursday last week. A slight pickup yesterday and today, but still very close to the weakest year to date. More oil from OPEC+ in the coming months and softer demand and rising inventories. We are heading for yet softer levels.

Down to the lowest since early May. Brent crude has fallen sharply the latest four days. It closed at USD 64.11/b yesterday which is the lowest since early May. It is staging a 1.3% rebound this morning along with gains in both equities and industrial metals with an added touch of support from a softer USD on top.
What stands out the most to us this week is the collapse in the Dubai one to three months time-spread.
Dubai is medium sour crude. OPEC+ is in general medium sour crude production. Asian refineries are predominantly designed to process medium sour crude. So Dubai is the real measure of the balance between OPEC+ holding back or not versus Asian oil demand for consumption and stock building.
A sharp weakening of the front-end of the Dubai curve. The front-end of the Dubai crude curve has been holding out very solidly throughout this summer while the front-end of the Brent and WTI curves have been steadily softening. But the strength in the Dubai curve in our view was carrying the crude oil market in general. A source of strength in the crude oil market. The core of the strength.
The now finally sharp decline of the front-end of the Dubai crude curve is thus a strong shift. Weakness in the Dubai crude marker is weakness in the core of the oil market. The core which has helped to hold the oil market elevated.
Facts supports the weakening. Add in facts of Iraq lifting production from Kurdistan through Turkey. Saudi Arabia lifting production to 10 mb/d in September (normal production level) and lifting exports as well as domestic demand for oil for power for air con is fading along with summer heat. Add also in counter seasonal rise in US crude and product stocks last week. US oil stocks usually decline by 1.3 mb/week this time of year. Last week they instead rose 6.4 mb/week (+7.2 mb if including SPR). Total US commercial oil stocks are now only 2.1 mb below the 2015-19 seasonal average. US oil stocks normally decline from now to Christmas. If they instead continue to rise, then it will be strongly counter seasonal rise and will create a very strong bearish pressure on oil prices.
Will OPEC+ lift its voluntary quotas by zero, 137 kb/d, 500 kb/d or 1.5 mb/d? On Sunday of course OPEC+ will decide on how much to unwind of the remaining 1.5 mb/d of voluntary quotas for November. Will it be 137 kb/d yet again as for October? Will it be 500 kb/d as was talked about earlier this week? Or will it be a full unwind in one go of 1.5 mb/d? We think most likely now it will be at least 500 kb/d and possibly a full unwind. We discussed this in a not earlier this week: ”500 kb/d of voluntary quotas in October. But a full unwind of 1.5 mb/d”
The strength in the front-end of the Dubai curve held out through summer while Brent and WTI curve structures weakened steadily. That core strength helped to keep flat crude oil prices elevated close to the 70-line. Now also the Dubai curve has given in.

Brent crude oil forward curves

Total US commercial stocks now close to normal. Counter seasonal rise last week. Rest of year?

Total US crude and product stocks on a steady trend higher.

Analys
OPEC+ will likely unwind 500 kb/d of voluntary quotas in October. But a full unwind of 1.5 mb/d in one go could be in the cards
Down to mid-60ies as Iraq lifts production while Saudi may be tired of voluntary cut frugality. The Brent December contract dropped 1.6% yesterday to USD 66.03/b. This morning it is down another 0.3% to USD 65.8/b. The drop in the price came on the back of the combined news that Iraq has resumed 190 kb/d of production in Kurdistan with exports through Turkey while OPEC+ delegates send signals that the group will unwind the remaining 1.65 mb/d (less the 137 kb/d in October) of voluntary cuts at a pace of 500 kb/d per month pace.
Signals of accelerated unwind and Iraqi increase may be connected. Russia, Kazakhstan and Iraq were main offenders versus the voluntary quotas they had agreed to follow. Russia had a production ’debt’ (cumulative overproduction versus quota) of close to 90 mb in March this year while Kazakhstan had a ’debt’ of about 60 mb and the same for Iraq. This apparently made Saudi Arabia angry this spring. Why should Saudi Arabia hold back if the other voluntary cutters were just freeriding? Thus the sudden rapid unwinding of voluntary cuts. That is at least one angle of explanations for the accelerated unwinding.
If the offenders with production debts then refrained from lifting production as the voluntary cuts were rapidly unwinded, then they could ’pay back’ their ’debts’ as they would under-produce versus the new and steadily higher quotas.
Forget about Kazakhstan. Its production was just too far above the quotas with no hope that the country would hold back production due to cross-ownership of oil assets by international oil companies. But Russia and Iraq should be able to do it.
Iraqi cumulative overproduction versus quotas could reach 85-90 mb in October. Iraq has however steadily continued to overproduce by 3-5 mb per month. In July its new and gradually higher quota came close to equal with a cumulative overproduction of only 0.6 mb that month. In August again however its production had an overshoot of 100 kb/d or 3.1 mb for the month. Its cumulative production debt had then risen to close to 80 mb. We don’t know for September yet. But looking at October we now know that its production will likely average close to 4.5 mb/d due to the revival of 190 kb/d of production in Kurdistan. Its quota however will only be 4.24 mb/d. Its overproduction in October will thus likely be around 250 kb/d above its quota with its production debt rising another 7-8 mb to a total of close to 90 mb.
Again, why should Saudi Arabia be frugal while Iraq is freeriding. Better to get rid of the voluntary quotas as quickly as possible and then start all over with clean sheets.
Unwinding the remaining 1.513 mb/d in one go in October? If OPEC+ unwinds the remaining 1.513 mb/d of voluntary cuts in one big go in October, then Iraq’s quota will be around 4.4 mb/d for October versus its likely production of close to 4.5 mb/d for the coming month..
OPEC+ should thus unwind the remaining 1.513 mb/d (1.65 – 0.137 mb/d) in one go for October in order for the quota of Iraq to be able to keep track with Iraq’s actual production increase.
October 5 will show how it plays out. But a quota unwind of at least 500 kb/d for Oct seems likely. An overall increase of at least 500 kb/d in the voluntary quota for October looks likely. But it could be the whole 1.513 mb/d in one go. If the increase in the quota is ’only’ 500 kb/d then Iraqi cumulative production will still rise by 5.7 mb to a total of 85 mb in October.
Iraqi production debt versus quotas will likely rise by 5.7 mb in October if OPEC+ only lifts the overall quota by 500 kb/d in October. Here assuming historical production debt did not rise in September. That Iraq lifts its production by 190 kb/d in October to 4.47 mb/d (August level + 190 kb/d) and that OPEC+ unwinds 500 kb/d of the remining quotas in October when they decide on this on 5 October.


Teck Resources kan förse Nordamerika och kanske hela G7 med all germanium som behövs

Leading Edge Materials är på rätt plats i rätt tid

Oljepriset faller efter ny handelskonflikt mellan USA och Kina

Christian Kopfer kommenterar guld, koppar, olja och stål, samt några råvarubolag

Silver spränger den magiska gränsen, kostar nu över 50 USD per uns

Kinas elproduktion slog nytt rekord i augusti, vilket även kolkraft gjorde

Tyskland har så höga elpriser att företag inte har råd att använda elektricitet

Det stigande guldpriset en utmaning för smyckesköpare

OPEC+ missar produktionsmål, stöder oljepriserna

Ett samtal om guld, olja, fjärrvärme och förnybar energi
-
 Nyheter4 veckor sedan
Kinas elproduktion slog nytt rekord i augusti, vilket även kolkraft gjorde
-
Nyheter4 veckor sedan
Tyskland har så höga elpriser att företag inte har råd att använda elektricitet
-
 Nyheter4 veckor sedan
Det stigande guldpriset en utmaning för smyckesköpare
-
 Nyheter2 veckor sedan
OPEC+ missar produktionsmål, stöder oljepriserna
-
 Nyheter3 veckor sedan
Ett samtal om guld, olja, fjärrvärme och förnybar energi
-
Analys4 veckor sedan
Brent crude ticks higher on tension, but market structure stays soft
-
Analys3 veckor sedan
Are Ukraine’s attacks on Russian energy infrastructure working?
-

 Nyheter1 vecka sedan
Guld nära 4000 USD och silver 50 USD, därför kan de fortsätta stiga