

Analys
Det dramatiska året då två karteller bröt samman – Årskrönika 2014

![]()
 Efterfrågan är inte problemet
Råvaror har nu avslutat det tredje året i rad som sämsta tillgångsklass och det är många som pekar ut svag global BNP som drivkraften. Visserligen är Kinas inbromsning och framförallt gir till mindre råvarukonsumerade tillväxt ett av skälen men USA:s ekonomi har slagit alla förväntningar och avslutar året med starkaste tillväxten sedan 2003. Istället kan de flesta stora prisrörelserna tillskrivas utbudssidan av prisekvationen i råvarumarknaden.
Olja och järnmalm halverades
Två av råvaruindustrins starkaste producentkarteller bröt samman under 2014. Mest omskrivet var det faktum att oljekartellen OPEC abdikerade från sin roll som prisgarant. Konsekvensen av detta var att Brentolja föll 48 % och blev årets förlorare, tätt följd av järnmalm som också nära halverades under året som gick. De fyra största järnmalmsbolagen släppte till slut alla hämningar och investerade i ny gruvproduktion som kommer ge ett långvarigt överskott för att hindra nya marginalproducenter från att anträda marknaden. Ett sista bevis på att supercykeln är över och att producenternas grepp om marknaden lättar är att priserna på de flesta råvaror har återvänt ner till produktionskostnaden.
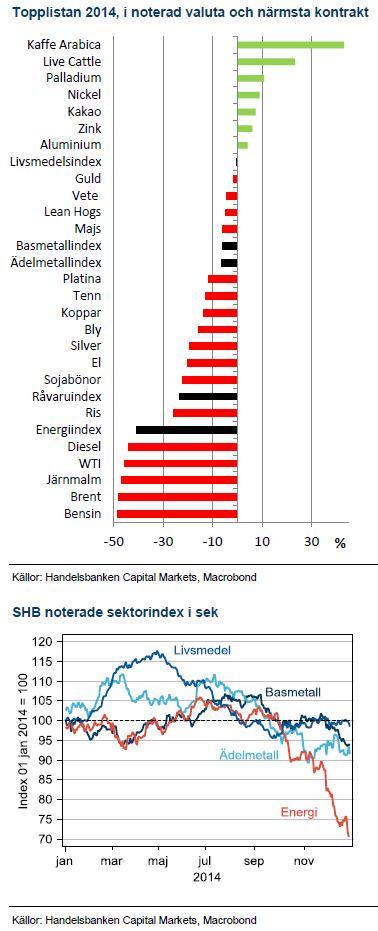
Breda nedgångar och tunt i toppen
För andra året i rad slutade samtliga fyra råvarusektorer; livsmedel, energi, basmetaller och ädelmetaller på minus. En förstärkning av USD mot SEK med 17,4% hjälpte de SEKnoterade indexen men räckte inte till för positiv avkastning. Råvaror som slutade året på plus var det ont om men tre av sex basmetaller slutade upp med nickel som vinnare i sektorn. Även här är det utbudsdramatik som ligger bakom prisrörelsen när Indonesien införde exportförbud för bland annat nickelmalm, vilket minskade världens utbud med 20%. Marknaden har betat av lager och står nu inför nickelbrist under 2015. Årets vinnare var, precis som vanligt, en väderdrabbad jordbruksråvara; kaffe från torkans Brasilien.
Geopolitisk risk blev makrotemat
Rysslands stora betydelse för råvarumarknanden kom i ljuset när Ryssland annekterade Krim under första halvåret. Priserna på olja steg i takt med rädlsan för att Väst skulle bemöta aktionen med exportsanktioner. Så blev inte fallet och riskpremien pös ut. Vetepriset steg också kraftig under mars efter oro för att Ukrainas produktion skulle bli lidande. Ebolautbrottet fick sin återspegling i råvarumarknaden i form av stigande pris på kakao som till 60% produceras i Västra Afrika.
Producentvalutor i skottgluggen
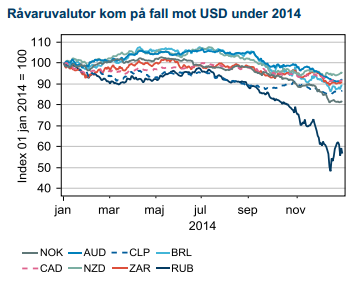 Med fallande råvarupriser och stark USD har råvaruvalutor kommit på fall. Norska kronan var den svagaste av alla industrinationer med ett fall på 19% mot USD. Fallet accelererade i december när Norges bank sänkte räntan och varnade för spridningseffekter till övriga ekonomin efter oljeprisfallet. Norges krona är dock i gott sällkap; Kanada dollar och Australien dollar föll båda med 9% medan Nya Zeelands valuta som mer beror på jordbruksråvaror än olja föll med 6%. Bland utvecklingsekonomierna föll Rysslands rubel 41% efter att passerat en lägsta notering någonsin mot USD i mitten av december. Chiles peso föll med kopparpriset, både koppar och peson gick ner 14% under året. Brasiliens stora råvaruekonomi fick ett tufft år med en halvering av olja och järnmalm och real slutade 11% ner. Sydafrikas rand föll 9% när både platina och guld slutade på minus.
De svaga råvaruvalutorna kommer att få stor betydelse för råvarupriserna under 2015. De flesta producenter har lejonparten av sina produktionskostnader i lokal valuta samtidigt som de säljer råvarorna i USD. De stora valutarörelserna under 2014 sänker därför produktionskostnaden.
Olja tog alla rubriker
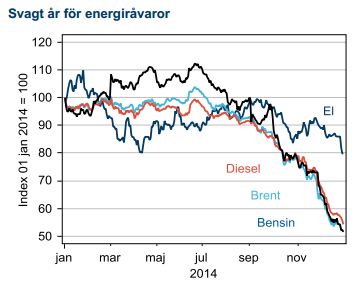 Sällan har ett OPEC-möte varit så emotsett som det andra för 2014 som gick av stapeln den 27:e november. Opec lyckades sänka den redan svaga oljemarknaden ytterligare och både Brent och WTI föll 20 % under de efterföljande två veckorna. OPEC:s beslut att inte sänka produktionen blev slutet på fyra år av höga och stabila priser. När OPEC, åtminstone temporärt abdikerat, sätter marknaden priset. För en marknad i tillfälligt överskott blir priset lågt. Olja är en kapitalintensiv, cyklisk industri och tillfälliga perioder av låga priser utan incitament till nya investeringar skapar förutsättningar för nästa prisuppgång. Denna cykel är dock annorlunda då USA:s skifferoljeproducenter har anträtt marknaden. Under 2015 ska deras flexibla produktionsapparat testas i en lågprismiljö för första gången. Utkomsten avgör nya jämviktspriset som marknaden i dag prisar omkring 78 USD/fat – lägre än vad som prisades under finanskrisen i december 2008
Lägsta elkonsumtionen sedan 1986
El slutade för andra året i rad på minus 20 %. Efterfrågan i Sverige var den lägsta på 30 år. Tung industri fortsätter minska sin konsumtion samtidigt som det varma vädret och ett kolpris som föll med 12 % agerade sänke. Åren med höga elpriser är nu ett minne blott och priset är nere på 2007 års nivåer
Järnmalm nära en halvering
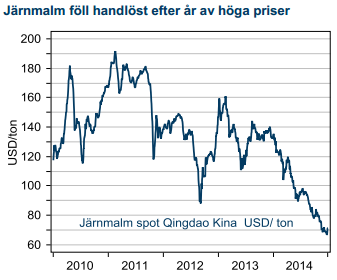 Kinas extrema hunger på stål kom till ett abrupt slut under 2014. Året började med en inhemsk tillväxttakt i stålkonsumtion på 7% och slutade på -3%. Samtidigt kom resultatet från år av investeringar i ny gruvproduktion. Produktionen av järnmalm för exportmarknaden växte med 12% när Rio Tinto, BHP Billiton, Vale och Fortescue ökade kapaciteten. Efterfrågan ökade samtidigt blott med 9% när inhemska kinesiska järnmalmsgruvor inte stängde ner sin olönsamma högkostnadsproduktion i den utsträckning marknaden förväntat sig. Överskottet pressade priset och de stora bolagen som en gång formade ett oligopol blev anklagade för att förstöra marknaden. De försvarade sig med att strategin var att hindra marginalproducenter före de anträder marknaden. Året såg också flera konkurser bland nyetablerade marginalproducenter, inte minst i Sverige.
Blandad utveckling för basmetaller
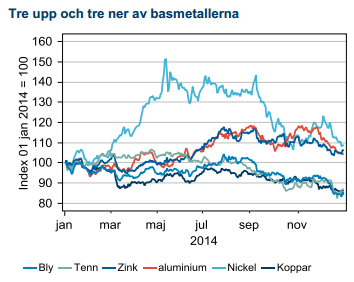 Dramatiken började i mars då Kinas makrodata oväntat föll handlöst. Främst industriproduktionen var svag och fick koppar att komma under press. Samtidigt började nickel stiga efter att Indonesien infört exportförbud den 12:e januari. Indonesien står för 20 % av världens produktion. Malmen som produceras där konsumeras främst i Kina och där fanns strategiska lager som gjorde att exportförbudet initialt inte fick stort genomslag. Med rysslandskrisen i mars ändrades tonläget då eventuella sanktioner mot Rysslands oljeexport väntades mötas av exporthinder från Rysslands sida på metaller viktiga för Väst, däribland nickel. Prisuppgången tog fart men dämpades när sanktioner aldrig kom till stånd och Filipinerna överraskande ökade exporten av liknande malm som Indonesien minskat och därmed tillfälligt kompenserade för bortfallet.
Aluminium inledde året på pressade nivåer då flera stora producenter stängde ner olönsam produktion. Metallen fick ett välbehövligt lyft när Amerikansk makrodata simultant överraskade positivt och bilindustrin Väster om Atlanten gick som tåget och planerade substituera in mer aluminium för att reducera vikten i fordonen. Överkapaciteten i världen för att producera aluminium är dock stor och årets två prisrallyn fick båda abrupta slut omkring 2100 USD/ton och året slutade i den gamla välkända gråzonen kring 1800 USD.
Zink steg under året, delvis av samma skäl som aluminium –båda har stor exponering mot USA och bilindustrin. Zink steg också när det länge välkända scenariot då några stora, utbrutna zinkgruvor ska stänga närmar sig. 2015 blir året då det ska visa sig om många små gruvor kommer expandera och kompensera bortfallet.
Ädelmetaller
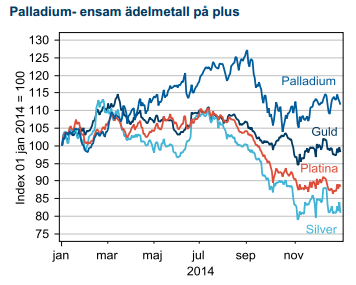 Palladium var ytterligare en av de råvaror som handlades upp på risken att Ryssland skulle minska tillgången till Väst som motdrag till eventuella exportsanktioner på olja. Palladiumexport har litet värde för Ryssland men metallen är viktigt för västerländsk bilindustri. Produktionen domineras av ett fåtal länder och prisuppgången eskalerade då Sydafrika är ett av dem och landet har haft sin beskärda del av motgångar under fjolåret. Våldsamma strejker har avlöst varandra men upplösningen fick priset på både palladium och platina på fall.
Guld och silver har åter varit föremål för Feds ordlek kring när den kommande räntehöjningen skall äga rum. De båda ädla värdebevararna steg kraftigt på Feds expansiva politik och befinner sig nu i en korrigering parallellt med att räntepolitiken åter går mot normalisering.
Jordbuk handlades inte endast på väder
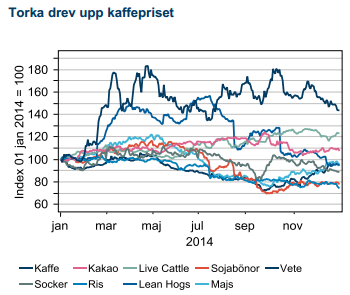 Jordbruksråvarornas största prisrörelser brukar vara väderberoende då tillväxten i konsumtionen är relativt konstant. Fjolåret var inget undantag då året inleddes med ett rally i kaffe. Från slutet av januari till början av mars steg kaffepriset med 80% när största producenten Brasilien drabbats av den värsta torkan på decennier, vilket förde priset på kaffebönorna till det högsta på två år.
Därefter var det dock geopolitisk risk som drev upp priset på jordbruksråvaror. Vetepriset steg med 25% från mars till maj när Rysslands aggressioner antogs påverka Ukrainas veteproduktion via brist på krediter, diesel, gödning och utsäde. Farhågorna var dock felaktiga och de producenter som sålde skörden 2014 i maj när riskpremien var som störst kunde tjäna 34% på hedgen fram till september då priset bottnade. Därefter startade en ny prisuppgång på 38% fram till december, åter beroende på Ryssland. Denna gång spekulerades det i risk för exportrestriktioner från Rysslands sida efter att rubelfallet ökat incitamenten för inhemska spannmålshandlare att exportera vete. Ryska politiker vill undvika matinflation och sade sig överväga alla medel utom regelrätt exportförbud för att hindra vetet att lämna landet. Globala säkerhetslager är dock betryggande och priset slutade året i ny utförslöpa och den andra riskpremien är kanske chansen att sälja skörden för 2015?
[box]Krönikan är producerat av Handelsbanken och publiceras i samarbete och med tillstånd på Råvarumarknaden.se[/box]
Ansvarsbegränsning
Detta material är producerat av Svenska Handelsbanken AB (publ) i fortsättningen kallad Handelsbanken. De som arbetar med innehållet är inte analytiker och materialet är inte oberoende investeringsanalys. Innehållet är uteslutande avsett för kunder i Sverige. Syftet är att ge en allmän information till Handelsbankens kunder och utgör inte ett personligt investeringsråd eller en personlig rekommendation. Informationen ska inte ensamt utgöra underlag för investeringsbeslut. Kunder bör inhämta råd från sina rådgivare och basera sina investeringsbeslut utifrån egen erfarenhet.
Informationen i materialet kan ändras och också avvika från de åsikter som uttrycks i oberoende investeringsanalyser från Handelsbanken. Informationen grundar sig på allmänt tillgänglig information och är hämtad från källor som bedöms som tillförlitliga, men riktigheten kan inte garanteras och informationen kan vara ofullständig eller nedkortad. Ingen del av förslaget får reproduceras eller distribueras till någon annan person utan att Handelsbanken dessförinnan lämnat sitt skriftliga medgivande. Handelsbanken ansvarar inte för att materialet används på ett sätt som strider mot förbudet mot vidarebefordran eller offentliggörs i strid med bankens regler.


Market is starting to take US/Iran headlines with a pinch of salt. Brent crude rose $2.8/b yesterday to an official close of $112.1/b. But after that it traded as low as $108.05/b before ending late night at around $109.7/b. Through the day it traded in a range of $106.87 – 112.72/b amid a flurry of news or rumors from Iran and the US. ”US temporary sanctions during negotiations” (falls alarm). ”We will bomb Iran” (not anyhow),… etc. While the market is still fluctuating to this kind of news flow, it is starting to take such headlines with a pinch of salt.

We’ll see. Maybe, maybe not. The Brent M1 contract is trading at $110.2/b this morning which very close to the average ticks through yesterday of $110.4/b.
Trump with bearish, verbal intervention whenever Brent trades above $110/b it seems. What seems to be a pattern is that Trump states something like ”very good negotiations going on with Iran”, ”New leaders in Iran are great,..”, ”Great progress in negotiations,…”, ”Deal in sight,..” etc whenever the Brent M1 contract trades above $110/b. An effort to cool the market. These hot air verbal interventions from Trump used to have a heavy bearish impact on prices, but they now seems to have less and less effect unless they are backed by reality.
As far as we can see there has been no real progress in the negotiations between the US and Iran with both sides still standing by their previous demands.
Iran is getting stronger while the cease fire lasts making a return to war for Trump yet harder. Iran is naturally in constant preparation for a return to war given Trump’s steady threats of bombing Iran again. Iran is naturally doing what ever is possible to prepare for a return to war. And every day the cease fire lasts it is better prepared. This naturally makes it more and more difficult and dangerous for the US to return to warring activity versus Iran as the consequences for energy infrastructure in the Persian Gulf will be more and more severe the longer the cease fire lasts. Israel seems to see it this way as well. That the war is not won and that current frozen state of a cease fire gives Iran opportunity to rebuild military and politically.
Global inventories are drawing down day by day. How much? In the meantime the Strait of Hormuz stays closed. There is varying measures and estimates of how much global inventories are drawing down. Our rough estimate, back of the envelope, is that global inventories are drawing down by at least some 10 mb/d or about 300 mb/d in a balance between loss of supply versus demand destruction. Other estimates we see are a monthly draw of 250-270 mb/d. The IEA only ’measured’ a draw in global observable stocks of 117 mb in April with oil on water rising 53 mb while on shore stocks fell 170 mb. But global stocks are hard to measure with large invisible, unmeasured stocks. As such a back of the envelope approach may be better.
Oil products is what the world is consuming. Oil product prices likely to rise while product stocks fall. Strategic Petroleum Reserves (SPR) are predominantly crude oil. Discharging oil from OECD SPR stocks, a sharp reduction in Chinese crude imports and a reduction in global refinery throughput of 6-7 mb/d has helped to keep crude oil markets satisfactorily supplied. But global inventories are drawing down none the less. And oil products is really what the world is consuming. So if global refinery throughput stays subdued, then demand will eventually have to match the supply of oil products. The likely path forward this summer is a steady draw down in jet fuel, diesel and gasoline. Higher prices for these. Then, if possible, higher refinery throughput and higher usage of crude in response to very profitable refinery margins. And lastly sharper draw in crude stocks and higher prices for these. But some 6 mb/d of oil products used to be exported through the Strait of Hormuz. And it may not be so easy to ramp up refinery activity across the world to compensate. Especially as Ukraine continues to damage Russian refineries as well as Russian crude production and export facilities.
Watch oil product stocks and prices as well as Brent calendar 2027. What to watch for this summer is thus oil product inventories falling and oil product premiums to crude rising. Another measure to watch is the Brent crude 2027 contract as it rises steadily day by day as the Strait of Hormuz stays closed and global oil inventories decline. The latter is close to the highest level since the start of the war and keeps rising.
The Brent M1 contract and the Brent 2027 prices and current price of jet fuel in Europe (ARA). All in USD/b

Our back of the envelope calculation of the global shortage created by the closure of the Strait of Hormuz. Note that 3.5 mb/d of discharge from SPR is also a draw. Note also that ’Forced demand loss’ of 2.5 mb/d is probably temporary and will fall back towards zero as logistics are sorted out leaving ’Price demand loss’ to do the job of balancing the market. Thus a shortfall of at least 9 mb/d created by the closure. More if SPR discharge is included and more if Forced demand loss recedes.

Brent is climbing higher. Front-month is at USD 106.3/bl this morning, close to a weekly high and a USD 9/bl jump from Mondays open. This is the move we flagged as a risk earlier in the week: the market shifting from ”a deal is around the corner” to ”this is going to take longer than we thought”.

Analyst Commodities, SEB
During April, rest-of-year Brent remained remarkably stable around USD 90/bl. A stability which rested on one single assumption: the SoH reopens around 1 May. That assumption is now slowly falling apart.
As we highlighted yesterday: every week of delay beyond 1 May adds (theoretically) ish USD 5/bl to the rest-of-year average, as global inventories draw 100 million barrels per week. i.e., a mid-May reopening implies rest-of-year Brent closer to USD 100/bl, and anything pushing into June or July takes us meaningfully higher.
What’s changed in the last 48 hours:
#1: The US military has formally warned that clearing suspected sea mines from SoH could take up to six months. That is a completely different timescale from what the financial market is pricing. Even a political deal tomorrow does not immediately reopen the strait.
#2: Trump has shifted his tone from urgency to ”strategic patience”. In yesterday’s press conference: ”Don’t rush me… I want a great deal.” The market is reading this as a president no longer feeling pressured by timelines, with the naval blockade running in the background.
#3: So far, the military activity is escalating, not de-escalating. Axios reports Iran is laying more mines in SoH. The US 3rd carrier strike group (USS George H.W. Bush) is arriving with two countermine vessels. Trump yesterday ordered the US Navy to destroy any Iranian boats caught laying mines. While CNN reports that the Pentagon is actively drawing up plans to strike Iranian SoH capabilities and individual Iranian military leaders if the ceasefire collapses. i.e., NOT a attitude consistent with an imminent deal!
Spot crude and product prices eased off the early-April highs on a combination of system rerouting and deal optimism. Both now weakening. Goldman estimates April Gulf output is reduced by 14.5 mbl/d, or 57% of pre-war supply, a number that keeps getting worse the longer this drags on.
Demand-side adaptation is ongoing: S. Korea has cut its Middle East crude dependence from 69% to 56% by pulling more from the Americas and Africa, and Japan is kicking off a second round of SPR releases from 1 May. But SPRs are finite.
Ref. to the negotiations, we should not bet on speed. The current Iranian leadership is dominated by genuine hardliners willing to absorb economic pain and run the clock to extract concessions. That is not a setup for a rapid resolution. US/Israeli media briefings keep framing the delay as ”internal Iranian divisions”, the reality is more complicated and points toward weeks and months, not days.
Our point is that the complexity is large, and higher prices have only just started (given a scenario where the negotiations drag out in time). The market spent April leaning on the USD 90/bl rest-of-year assumption; that case is diminishing by the hour. If ”early May reopening” is replaced by ”June, July or later” over the next week or two, both crude and products have meaningful room to reprice higher from here. There is a high risk being short energy and betting on any immediate political resolution(!).
Down on Friday. Up on Monday. The Brent June crude oil contract traded down 5.1% last week to a close of $90.38/b. It reached a high of $103.87/b last Monday and a low of $86.09/b on Friday as Iran announced that the Strait of Hormuz was fully open for transit. That quickly changed over the weekend as the US upheld its blockade of Iranian oil exports while Iran naturally responded by closing the SoH again. The US blew a hole in the engine room of the Iranian ship TOUSKA and took custody of the ship on Sunday. Brent crude is up 5.6% this morning to $95.4/b.
The cease-fire is expiring tomorrow. The US has said it will send a delegation for a second round of negotiations in Islamabad in Pakistan. But Iran has for now rejected a second round of talks as it views US demands as unrealistic and excessive while the US is also blocking the Strait of Hormuz.
While Brent is up 5% this morning, the financial market is still very optimistic that progress will be made. That talks will continue and that the SoH will fully open by the start of May which is consistent with a rest-of-year average Brent crude oil price of around $90/b with the market now trading that balance at around $88/b.
Financial optimism vs. physical deterioration. We have a divergence where the financial market is trading negotiations, improvements and resolution while at the same time the physical market is deteriorating day by day. Physical oil flows remain constrained by disrupted flows, longer voyage times and elevated freight and insurance costs.
Financial markets are betting that a US/Iranian resolution will save us in time from violent shortages down the road. But every day that the SoH remains closed is bringing us closer to a potentially very painful point of shortages and much higher prices.
The US blockade is also a weapon of leverage against its European and Asian allies. When Iran closed the SoH it held the world economy as a hostage against the US. The US blockade of the SoH is of course blocking Iranian oil exports. But it is also an action of disruption directed towards Europe and Asia. The US has called for the rest of the world to engaged in the war with Iran: ”If you want oil from the Persian Gulf, then go and get it”. A risk is that the US plays brinkmanship with the global oil market directed towards its European and Asian allies and maybe even towards China to force them to engage and take part. Maybe unthinkable. But unthinkable has become the norm with Trump in the White House.


Sommarväder skapar prisrally på elbörsen
Oil product price pain is set to rise as the Strait of Hormuz stays closed into summer

Solkraften pressar elpriserna dagtid

Michel Gubel ger sin syn på oljemarknaden