

Analys
SHB Råvarubrevet 25 oktober 2013

 Råvaror allmänt
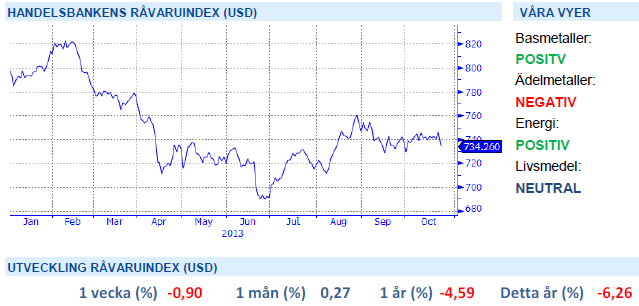
Nu märks USA-effekten
Senaste veckan har bjudit på tillfälligt dystrare ekonomiska utsikter efter den finanspolitiska turbulensen i USA. Nedstängningen av den federala staten slår automatiskt på BNP-tillväxten under det fjärde kvartalet. Intressant är vilka effekter den förhöjda osäkerheten i USA (skuldtaksfrågan är ju bara framskjuten till början av nästa år) kommer att få på investerings- och konsumtionsbeslut, även om denna osäkerhet har minskat något sedan en överenskommelse kom på plats. Offentliganställda har flera viktiga deadlines att beakta – stundar ännu en nedstängning i januari? Marknadens förväntningar på en nedskalning av Federal Reserves obligationsköparprogram, QE3, har också förändrats tydligt den senaste månaden. Från att en nästan enhällig ekonomkår trodde på en nedskalning i september är konsensus nu snarare mars 2014. Bland råvarorna har det främst prisats in i guld som handlas på 4 veckors högsta.
Vårt tema där Kina ska stå för höstens positiva makroöverraskning håller i sig. Flashen för inköpschefsindex kom in under veckan på 50,9, upp från 50,2 i september och den högsta nivån på 7 månader. Basmetallerna är dock fortsatt ”rangehandlade”, klämda mellan starkare utsikter för efterfrågan från Kina och ett produktionsöverskott i marknaden.
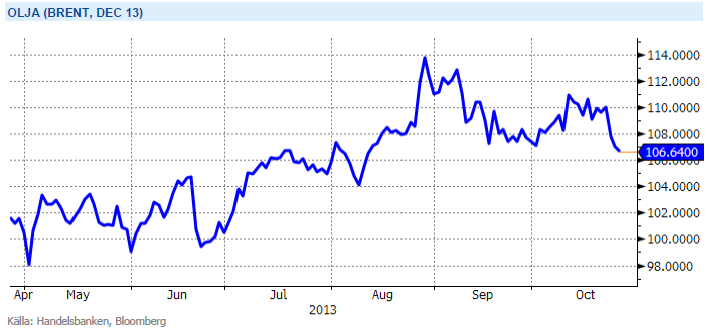
Brentpriset ser denna vecka ut att gå mot det största raset på 4 månader. Orsakerna till prisuppgången i augusti verkar nu omvänt. Lagernivåerna i USA steg under veckan oväntat mycket – i somras föll de oväntat mycket. Den politiska turbulensen i Mellanöstern har också hamnat utanför kameralinsen senaste veckorna vilket prisar ur mer av riskpremien. När elpriset dessutom har haft två svaga veckor efter väderomslag med stor nederbörd och blötare prognoser så har vårt energiindex tappat sin starka trend uppåt. Vi tror dock på en come back, främst för el i närtid.
Basmetaller
Lagerproblematik pressar upp fysisk premie
Basmetallerna har stärkts över lag under veckan, dels på grund av positiv PMI-flash från Kina, och vi tror på en fortsatt stark höst. LME Index har stabiliserats efter sommarens bottennoteringar och vi räknar med att den positiva trenden fortsätter utan några dramatiska rörelser. Överskottet bör ha diskonterats för och läget på metaller kanske bäst illustreras genom bilden nedan där Nickel och Aluminium är de två metaller som handlas på störst rabatt sett i förhållande till marginalkostnad.
Ser vi till Aluminium och Zink förstärks balansen ytterligare av de lager som förväntas nå marknaden i samband med LME´s eventuella reglering för att få bukt på flaskhalsarna, dvs köerna som drivit upp fysiska premierna 100-200 procent över 10-års snittet samtidigt som börskurserna ligger kvar kring 10-års snittet. På Aluminium innebär det sannolikt att vi börjar röra oss tillbaka mot normalnivån om ca 100 dollar (från de 250-300 dollar vi sett) så vi förväntar oss att LME inom kort ger besked kring dessa regleringar som i stora drag skall se till att lika mycket metall går ut som kommer in, med implementeringstart från april nästa år.
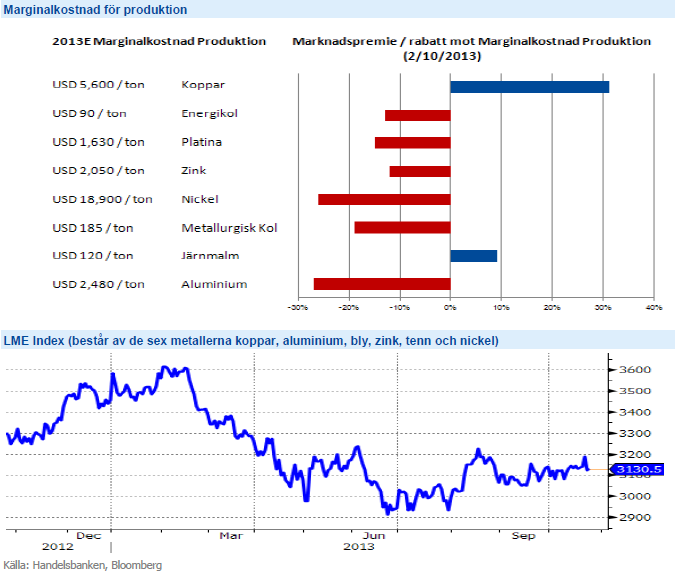
Vi tror att Kinas tillväxt kommer överraska positivt under Q4 och Q1, vilket kommer stärka metallerna. Vi tror på: LONG BASMETALLER
Ädelmetaller
Återigen oro för strejk i Sydafrika
Guldet handlas upp 1.5 procent med visst stöd från ETF-flöden och en försvagad dollar där EURUSD för första gången på två år passerade 1.38. Platina stiger med ungefär lika mycket och ökat fokus på den förnyade strejkoron i Sydafrika. AMCU-facket misslyckades i sina löneförhandlingar gentemot Anglo American (världens största Platinaproducent) och det radikala facket är sedan tidigare i konflikt med Impala Platinum (världens näst största Platinaproducent), där alla försök till medling misslyckats. AMCU skall i början av nästa vecka besluta om man skall gå ut i strejk vid Impala. Kortsiktigt stöd om man ser till dollarutvecklingen och oron kring Sydafrika men vi räknar med att guldet sedan faller tillbaka i den mer långsiktigt negativa trend där vi befinner oss.
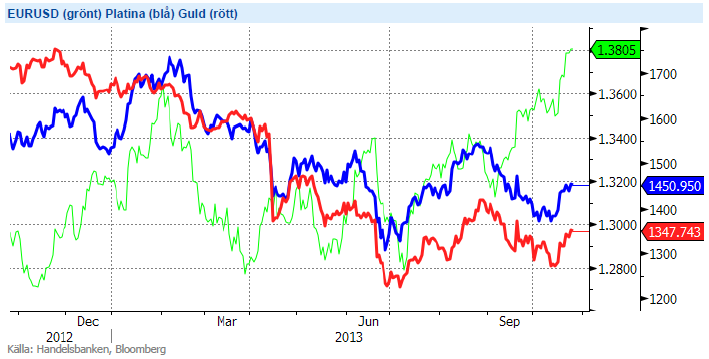
Efter en uppgång under sommaren tror vi åter att guldets väg lutar utför. Vi tror på: SHRT GULD H
Energi
Höga lager pressar oljan
Oljepriset har fallit under veckan till följd av stigande lager (högsta nivå sedan juni) och handlas nu på 106,6 USD/fat. Oro för kortsiktigt överskott av amerikansk råolja har fått spreaden mellan WTI och Brent-olja att gå isär, som mest under veckan på dryga 11 dollar, vilket är störst sedan april. Kombinationen av växande nordamerikanska produktionen, nya rörledningar till den amerikanska gulfkusten och storskaliga revisionsstopp på raffinaderier är anledningen till att WTI-oljan handlas så mycket lägre än Brent.
Elmarknaden (Q1-14) backar med närmare 5 procent under veckan efter att vädret slagit om och lågtrycket drivit stora nederbördsfronter rakt in mot framförallt Norge. Som mest uppmättes hela 3.5 TWh nederbördsenergi i Norge och Sverige under tisdagen och detta är enligt statistik den mest nederbördsrika dag mätt till energimängd på hela 10 år! Även den höga temperaturen har överraskat och i södra Sverige noterades 19 grader vilket är den högsta temperaturen på över 125 år! Ser vi till energibalansen bör den såldes förbättras till 15.6 TWh i underskott med prognoserna. Kolet får stöd av en svagare dollar, fraktrater samt marginalkostnad för produktion vilken inte motiverar full produktion på dessa låga nivåer. Utsläppsrätterna som bröt igenom 5 EUR-nivån har nu återhämtat sig vilket resulterar i att brytpriset för kol nu stigit med 3 euro. När de värsta lågtrycksbetonade vädret dragit förbi ser vi åter elen som köpvärd inför vintern.
Energiunderskott tillsammans med osäkerhet kring kärnkraftsverken inför vintern talar för högre elpris. Vi tror på: LONG EL
Livsmedel
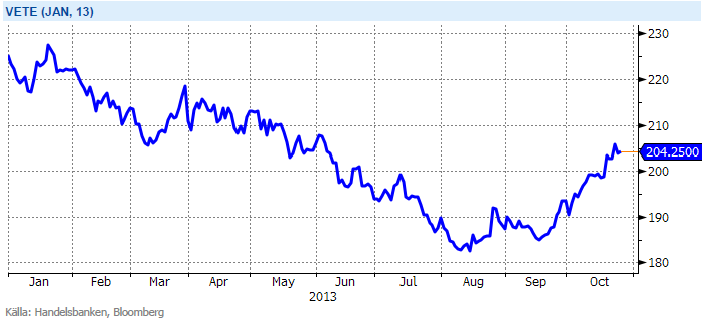
Vetet är fortsatt starkt
Prisuppgången på vete den senaste tiden (6,9 % under oktober) är driven av problemen i Ryssland och Argentina, med stöd av producenternas ovilja att sälja i en stigande marknad. Det ser ut att ha blivit något torrare i Ryssland men den sådd som görs nu görs sent och under blöta förhållanden. Omkring 5 procent av vårveteskörden återstår i Ryssland, den del av detta som blir skördat håller låg kvalitet. Utan nya problem inom kort blir vi inte förvånade om vi ser ytterligare korrigering nedåt den närmsta tiden. Det finns trots allt gott om spannmål att tillgå i världen och ännu mer på ingång.
Skörden på sojabönor i USA går framåt, till helgen beräknas omkring 85 procent av skörden vara avklarad. Inkommande skörderapporter talar för en avkastning på åtminstone 42 bushels per acre. Sojasådden i Brasilien går framåt i rask i bra takt under bra förhållanden, vilket stärker tron om en kommande rekordskörd. Det tillsammans med höga förväntningar på en stor amerikansk sojaareal till våren talar för lägre priser på soja på några månaders sikt.
Med anledning av ett ökat intresse kring kaffe har vi i skrivit lite mer ingående om denna lyxiga råvara. Läs Kaffe Special Edition.
Handelsbankens Råvaruindex
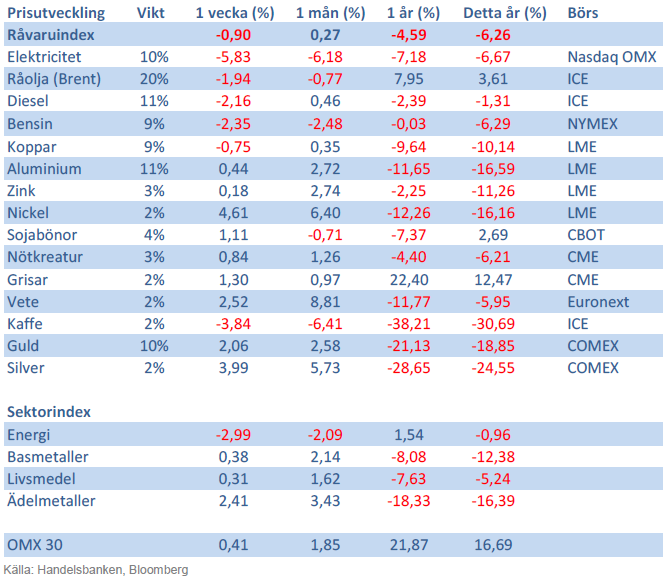
Handelsbankens råvaruindex består av de underliggande indexen för respektive råvara. Vikterna är bestämda till hälften från värdet av nordisk produktion (globala produktionen för sektorindex) och till hälften från likviditeten i terminskontrakten.
[box]SHB Råvarubrevet är producerat av Handelsbanken och publiceras i samarbete och med tillstånd på Råvarumarknaden.se[/box]
Ansvarsbegränsning
Detta material är producerat av Svenska Handelsbanken AB (publ) i fortsättningen kallad Handelsbanken. De som arbetar med innehållet är inte analytiker och materialet är inte oberoende investeringsanalys. Innehållet är uteslutande avsett för kunder i Sverige. Syftet är att ge en allmän information till Handelsbankens kunder och utgör inte ett personligt investeringsråd eller en personlig rekommendation. Informationen ska inte ensamt utgöra underlag för investeringsbeslut. Kunder bör inhämta råd från sina rådgivare och basera sina investeringsbeslut utifrån egen erfarenhet.
Informationen i materialet kan ändras och också avvika från de åsikter som uttrycks i oberoende investeringsanalyser från Handelsbanken. Informationen grundar sig på allmänt tillgänglig information och är hämtad från källor som bedöms som tillförlitliga, men riktigheten kan inte garanteras och informationen kan vara ofullständig eller nedkortad. Ingen del av förslaget får reproduceras eller distribueras till någon annan person utan att Handelsbanken dessförinnan lämnat sitt skriftliga medgivande. Handelsbanken ansvarar inte för att materialet används på ett sätt som strider mot förbudet mot vidarebefordran eller offentliggörs i strid med bankens regler.


Down on Friday. Up on Monday. The Brent June crude oil contract traded down 5.1% last week to a close of $90.38/b. It reached a high of $103.87/b last Monday and a low of $86.09/b on Friday as Iran announced that the Strait of Hormuz was fully open for transit. That quickly changed over the weekend as the US upheld its blockade of Iranian oil exports while Iran naturally responded by closing the SoH again. The US blew a hole in the engine room of the Iranian ship TOUSKA and took custody of the ship on Sunday. Brent crude is up 5.6% this morning to $95.4/b.

The cease-fire is expiring tomorrow. The US has said it will send a delegation for a second round of negotiations in Islamabad in Pakistan. But Iran has for now rejected a second round of talks as it views US demands as unrealistic and excessive while the US is also blocking the Strait of Hormuz.
While Brent is up 5% this morning, the financial market is still very optimistic that progress will be made. That talks will continue and that the SoH will fully open by the start of May which is consistent with a rest-of-year average Brent crude oil price of around $90/b with the market now trading that balance at around $88/b.
Financial optimism vs. physical deterioration. We have a divergence where the financial market is trading negotiations, improvements and resolution while at the same time the physical market is deteriorating day by day. Physical oil flows remain constrained by disrupted flows, longer voyage times and elevated freight and insurance costs.
Financial markets are betting that a US/Iranian resolution will save us in time from violent shortages down the road. But every day that the SoH remains closed is bringing us closer to a potentially very painful point of shortages and much higher prices.
The US blockade is also a weapon of leverage against its European and Asian allies. When Iran closed the SoH it held the world economy as a hostage against the US. The US blockade of the SoH is of course blocking Iranian oil exports. But it is also an action of disruption directed towards Europe and Asia. The US has called for the rest of the world to engaged in the war with Iran: ”If you want oil from the Persian Gulf, then go and get it”. A risk is that the US plays brinkmanship with the global oil market directed towards its European and Asian allies and maybe even towards China to force them to engage and take part. Maybe unthinkable. But unthinkable has become the norm with Trump in the White House.
Wild moves yesterday. Brent crude traded to a high of $114.43/b and a low of $96.0/b and closed at $99.94/b yesterday.
US – Iran negotiations ongoing or not? What a day. Donald Trump announced that good talks were ongoing between Iran and the US and that the 48 hour deadline before bombing Iranian power plants and energy infrastructure was postponed by five days subject to success of ongoing meetings. Iranian media meanwhile stated that no meetings were ongoing at all.
Today we are scratching our heads trying to figure out what yesterday was all about.
Friends and family playing the market? Was it just Trump and his friends and family who were playing with oil and equity markets with $580m and $1.46bn in bets being placed by someone in oil and equity markets just 15 minutes before Trump’s announcement?
Was Trump pulling a TACO as he reached his political and economic pain point: Brent at $112/b, US Gas at $4/gal, SPX below 200dma and US 10yr above 4.4%?
Different Iranian factions with Trump talking with one of them? Are there real negotiations going on but with the US talking to one faction in Iran while another, the hardliners, are not involved and are denying any such negotiations going on?
Extending the ultimatum to attack and invade Kharg island next weekend? Or, is the five day delay of the deadline a tactical decision to allow US amphibious assault ships and marines to arrive in the Gulf in the upcoming weekend while US and Israeli continues to degrade Iranian military targets till then. And then next weekend a move by the US/Israel to attack and conquer for example the Kharg island?
We do not really know which it is or maybe a combination of these.
We did get some kind of TACO ydy. But markets have been waiting for some kind of TACO to happen and yesterday we got some kind of TACO. And Brent crude is now trading at $101.5/b as a result rather than at $112-114/b as it did no the high yesterday.
But what really matters in our view is the political situation on the ground in Iran. Will hardliners continue to hold power or will a more pragmatic faction gain power?
If the hardliners remain in power then oil pain should extend all the way to US midterm elections. The hardliners were apparently still in charge as of last week. Iran immediately retaliated and damaged LNG infrastructure in Qatar after Israel hit Iranian South Pars. The SoH was still closed and all messages coming out of Iran indicated defiance. Hardliners continues in power has a huge consequence for oil prices going forward. The regime has played its ’oil-weapon’ (closing or chocking the Strait of Hormuz). It is using it to achieve political goals. Deterrence: it needs to be so politically and economically expensive to attack Iran that it won’t happen again in the future. Or at least that the US/Israel thinks 10-times over before they attack again. The highest Brent crude oil closing price since the start of the war is $112.19/b last Friday. In comparison the 20-year inflation adjusted Brent price is $103/b. So Brent crude last Friday at $112.19/b isn’t a shockingly high price. And it is still far below the nominal high of $148/b from 2008 which is $220/b if inflation adjusted. So once in a lifetime Iran activates its most powerful weapon. The oil weapon. It needs to show the power of this weapon and it needs to reap political gains. Getting Brent to $112/b and intraday high of $119.5/b (9 March) isn’t a display of the power of that weapon. And it is not a deterrence against future attacks.
So if the hardliners remain in power in Iran, then the SoH will likely remain chocked all the way to US midterm elections and Brent crude will at a minimum go above the historical nominal high of $148/b from 2008.
Thus the outlook for the oil price for the rest of the year doesn’t depend all that much of whether Trump pulls a TACO or not. Stops bombing or not. It depends more on who is in charge in Iran. If it is the hardliners, then deterrence against future attacks via chocking of the SoH and high oil prices is the likely line of action. It is impacting the world but the Iranian ’oil-weapon’ is directed towards the US president and the the US midterm elections.
If a pragmatic faction gets to power in Iran, then a very prosperous future is possible. However, if power is shifting towards a more pragmatic faction in Iran then a completely different direction could evolve. Such a faction could possibly be open for cooperation with the US and the GCC and possibly put its issues versus Israel aside. Then the prosperity we have seen evolving in Dubai could be a possible future also for Iran.
So far it looks like the hardliners are fully in charge. As far as we can see, the hardliners are still fully in control in Iran. That points towards continued chocking of the SoH and oil prices ticking higher as global inventories (the oil market buffers) are drawn lower. And not just for a few more weeks, but possibly all the way to the US midterm elections.
A brief sigh of relief yesterday as oil infra at Kharg wasn’t damaged. But higher today. Brent crude dabbled around a bit yesterday in relief that oil infrastructure at Iran’s Kharg island wasn’t damaged. It traded briefly below the 100-line and in a range of $99.54 – 106.5/b. Its close was near the low at $100.21/b.
No easy victorious way out for Trump. So no end in sight yet. Brent is up 3.2% today to $103.4/b with no signs that the war will end anytime soon. Trump has no easy way to declare victory and mission accomplished as long as Iran is in full control of the Strait of Hormuz while also holding some 440 kg of uranium enriched to 60% and not far from weapons grade at 90%. As long as these two factors are unresolved it is difficult for Trump to pull out of the Middle East. Naturally he gets increasingly frustrated over the situation as the oil price and US retail gas prices keeps ticking higher while the US is tied into the mess in the Middle East. Trying to drag NATO members into his mess but not much luck there.
When commodity prices spike they spike 2x, 3x, 4x or 5x. Supply and demand for commodities are notoriously inflexible. When either of them shifts sharply, the the price can easily go to zero (April 2022) or multiply 2x, 3x, or even 5x of normal. Examples in case cobalt in 2025 where Kongo restricted supply and the price doubled. Global LNG in 2022 where the price went 5x normal for the full year average. Demand for tungsten in ammunition is up strongly along with full war in the middle east. And its price? Up 537%.
Why hasn’t the Brent crude oil price gone 2x, 3x, 4x or 5x versus its normal of $68/b given close to full stop in the flow of oil of the Strait of Hormuz? We are after all talking about close to 20% of global supply being disrupted. The reason is the buffers. It is fairly easy to store oil. Commercial operators only hold stocks for logistical variations. It is a lot of oil in commercial stocks, but that is predominantly because the whole oil system is so huge. In addition we have Strategic Petroleum Reserves (SPRs) of close to 2500 mb of crude and 1000 mb of oil products. The IEA last week decided to release 400 mb from global SPR. Equal to 20 days of full closure of the Strait of Hormuz. Thus oil in commercial stocks on land, commercial oil in transit at sea and release of oil from SPRs is currently buffering the situation.
But we are running the buffers down day by day. As a result we see gradually increasing stress here and there in the global oil market. Asia is feeling the pinch the most. It has very low self sufficiency of oil and most of the exports from the Gulf normally head to Asia. Availability of propane and butane many places in India (LPG) has dried up very quickly. Local prices have tripled as a result. Local availability of crude, bunker oil, fuel oil, jet fuel, naphtha and other oil products is quickly running down to critical levels many places in Asia with prices shooting up. Oman crude oil is marked at $153/b. Jet fuel in Singapore is marked at $191/b.
Oil at sea originating from Strait of Hormuz from before 28 Feb is rapidly emptied. Oil at sea is a large pool of commercial oil. An inventory of oil in constant move. If we assume that the average journey from the Persian Gulf to its destinations has a volume weighted average of 13.5 days then the amount of oil at sea originating from the Persian Gulf when the the US/Israel attacked on 28 Feb was 13.5 days * 20 mb/d = 269 mb. Since the strait closed, this oil has increasingly been delivered at its destinations. Those closest to the Strait, like Pakistan, felt the emptying of this supply chain the fastest. Propane prices shooting to 3x normal there already last week and restaurants serving cold food this week is a result of that. Some 50-60% of Asia’s imports of Naphtha normally originates from the Persian Gulf. So naphtha is a natural pain point for Asia. The Gulf also a large and important exporter of Jet fuel. That shut in has lifted jet prices above $200/b.
To simplify our calculations we assume that no oil has left the Strait since that date and that there is no increase in Saudi exports from Yanbu. Then the draining of this inventory at sea originated from the Persian Gulf will essentially look like this:
The supply chain of oil at sea originating from the Strait of Hormuz is soon empty. Except for oil allowed through the Strait of Hormuz by Iran and increased exports from Yanbu in the Red Sea. Not included here.

Oil at sea is falling fast as oil is delivered without any new refill in the Persian Gulf. Waivers for Russian crude is also shifting Russian crude to consumers. Brent crude will likely start to feel the pinch much more forcefully when oil at sea is drawn down another 200 mb to around 1000 mb. That is not much more than 10 days from here.

Oil and oil products are starting to become very pricy many places. Brent crude has still been shielded from spiking like the others.


Market Still Betting on Timely Resolution, But Each Day Raises Shortage Risk

Christian Kopfer om läget för oljan

Marknaden måste börja betrakta de höga kopparpriserna som det nya normala

Det fysiska spotpriset på brentolja har slagit nytt rekord

40 minuter med Javier Blas om hur världen verkligen påverkas av energikrisen
40 minuter med Javier Blas om hur världen verkligen påverkas av energikrisen

Elpriserna fördubblas, stor osäkerhet inför sommaren

MP Materials, USA:s svar på Kinas dominans över sällsynta jordartsmetaller
Det fysiska spotpriset på brentolja har slagit nytt rekord

Studsvik har idag ansökt om att få bygga 1200-1600 MW kärnkraft i Valdemarsvik
-
 Nyheter3 veckor sedan
40 minuter med Javier Blas om hur världen verkligen påverkas av energikrisen
-
 Nyheter4 veckor sedan
Elpriserna fördubblas, stor osäkerhet inför sommaren
-
 Nyheter4 veckor sedan
MP Materials, USA:s svar på Kinas dominans över sällsynta jordartsmetaller
-
 Nyheter2 veckor sedan
Det fysiska spotpriset på brentolja har slagit nytt rekord
-
 Nyheter4 veckor sedan
Studsvik har idag ansökt om att få bygga 1200-1600 MW kärnkraft i Valdemarsvik
-
 Nyheter2 veckor sedan
Marknaden måste börja betrakta de höga kopparpriserna som det nya normala
-
Analys4 veckor sedan
TACO (or Whatever It Was) Sends Oil Lower — Iran Keeps Choking Hormuz
-

 Nyheter4 veckor sedan
Matproduktion är beroende av gödsel, Gulfkriget skapar brist