

Analys
SHB Råvarubrevet 11 oktober 2013

 Råvaror allmänt
De pratar åtminstone med varandra
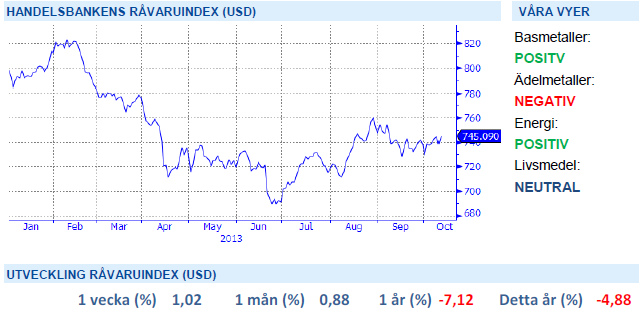
De senaste veckorna har präglats av den pågående amerikanska skuldtakskrisen, som i skrivandets stund verkar vara på väg att skjutas på framtiden i sex veckor. Ju längre skuldtaksdiskussionerna pågår, desto större blir risken att ett dystrare stämningsläge hos företag och hushåll spiller över på investerings- och köpbeslut varefter konjunkturen får sig en törn. Att skjuta diskussionerna på framtiden kan vara lika mycket ett problem som en lösning, då den förhöjda osäkerheten kommer att ligga kvar en tid och skapa nedåtrisker för konjunkturen. Handelsbankens råvaruindex har under oktober stigit över 2% och vi tror att den positiva trenden fortsätter.
Basmetaller
LME Week – Hårt golv, mjukt tak
Årets LME-vecka, då den globala metallindustrin samlas i London, bjöd på en mer optimistisk känsla än vad som förmedlades för ett år sedan. Det gångna året har också inneburit fallande metallpriser, men nu börjar man se ljuset igen. Stämningen kan sammanfattas i fyra ord; ”firm floor, soft ceiling”. Resonemanget bygger på en fortsatt solid efterfrågan, framförallt i Asien, i kombination med att det gångna årets prisfall gjort att en hel del produktionskapacitet försvunnit. Nedskrivningar av tillgångsvärden i gruvsektorn har gjort det betydligt svårare att få finansiering för projekt med osäkra kassaflöden, och nya projekt i geografiska högriskzoner blir ifrågasatta. Därtill fortsätter kostnaderna för utvinning att öka i hög takt.
Därav citatet ”firm floor, soft ceiling”, balansen är nu sådan att ytterligare prisfall leder till snabba utbudsminskningar, då många metaller ligger på prisnivåer som motsvarar marginalkostnaden för produktion. Samtidigt finns det en stor tröghet i nyproduktion för att möta en potentiellt växande efterfrågan, varför priskänsligheten bedöms ligga på uppsidan. Övriga ämnen var LME:s oförmåga att lösa lagerproblemen (vilket lett till höga fysiska premier), krav på ökad transparens genom s.k. Commitment of Traders-rapportering, och konsekvenserna av EMIR-regleringarna för kostnader på prissäkring. Men den viktigaste skillnaden mot förra året är det positiva sentimentet för prisökningar på basmetaller.
Läs hela vår rapport från LME veckan här: LME Week 2013 på en sida
Vi tror att Kinas tillväxt kommer överraska positivt under Q4 och Q1, vilket kommer stärka metallarna. Vi tror på: LONG BASMETALLER
Ädelmetaller
Guld – dags att bli negativ igen
Vi har haft en mer positiv kortsiktig syn på guld och övriga ädelmetaller en tid, baserat på att det varit översålt, vi ser risk att marknaden blir mer orolig för inflation, och risken för geopolitiska spänningar runt Syrien-situationen. Vår mer långsiktiga syn har dock hela tiden varit negativ. Nu finner vi det för gott att slänga in handduken på vår kortsiktiga positiva syn, och det finns ett par anledningar till det. Vi har hela tiden sagt att man ska ”dansa nära nödutgången”, och en viktig signal för att sätta fart mot den är när vi får en mer ”konjunkturbaserad” prisutveckling i marknaden. I detta fall är det två saker som pekar mot det, den första är den blixtrande fart med vilken guldet föll tillbaks efter Feds besked i september att inte bromsa in stimulanserna. Fed-beskedet ledde till en omedelbar uppgång på hela 6 procent för guldet, men redan innan veckan var slut hade hela uppgången raderats ut. Nu handlar vi under nivåerna som rådde före beskedet.
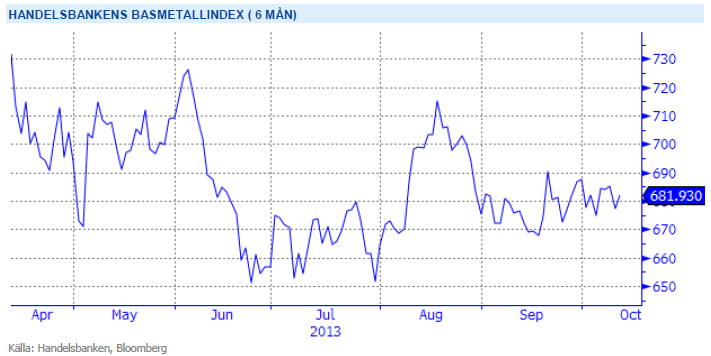
Den andra viktiga signalen som är negativ för guld är att det endast är ädelmetallerna som fallit sedan beskedet. Både olja och basmetaller har stigit sedan Fed-beskedet, och Handelsbankens basmetallindex har gått nästan 7 procent bättre än ädelmetallindex. Vi ser detta som en logisk utveckling med de mer positiva konjunktursignalerna som kommer från Kina och USA, och vi tror att denna utveckling kan komma att fortsätta.
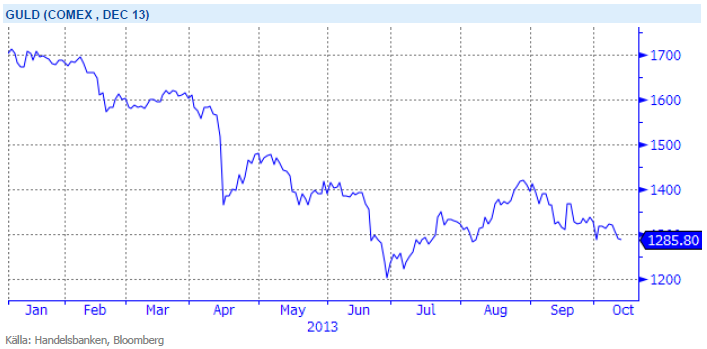
Efter en uppgång under sommaren tror vi åter att guldets väg lutar utför. Vi tror på: SHRT GULD H
Energi
USA tynger oljemarknaden
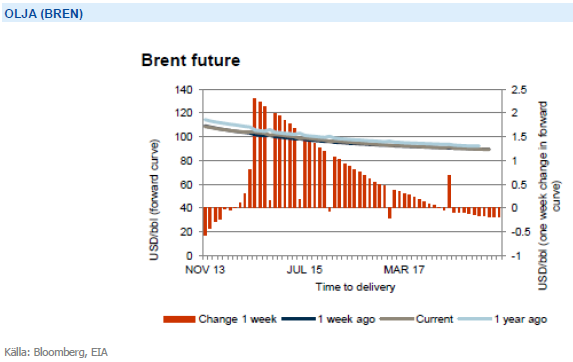
Oljemarknaden som redan tyngts av dödläget i budgetförhandlingarna och risken för en inbromsning i efterfrågan från världens största oljekonsument, pressades ytterligare av lagersiffror som visade största lagerökningen på ett år (+ 6.8 miljoner fat mot förväntade 1.5 miljoner fat efter raffinaderierna överraskande dragit ner kapacitetsutnyttjandet mer och tidigare än väntat). Samtidigt reviderade EIA sin produktionstillväxt för 2014 till 1.5 miljoner fat per dag (+50k) och tillväxt i efterfrågan på 1.17 miljoner fat per dag (-20k). Marknaden vände dock upp igen efter att Libyens premiärminister Ali Zeidan kidnappats av rebeller vilket minskar förhoppningen om att Libyens oljeexport kommer återgå till normala nivåer. Vi är fortsatt positiva till olja i portföljen sett till konjunkturåterhämtningen samt det faktum att reservkapaciteten är låg vilket gör marknaden känslig för produktionsstörningar. Lägg därtill den extraavkastning som investerare i olja ofta får eftersom terminer historiskt handlats i rabatt till spot (se nedan).
Vi är fortsatt positiva till elpriset och tror att det kan finnas ännu lite mer uppsida kvar. Kolpriset bottnade sannolikt ur under sommaren med nya signaler om att amerikanska gruvbolag stänger ned kapacitet på dessa låga nivåer och delar av nedstängningen kommer troligtvis bli permanent. Energiunderskottet är nu 18TWh och med väderprognoserna som ligger för nästa vecka kan den försämras med ytterligare 2 TWh. Med kärnkraftens relativa betydelse inför vintern, en osäkerhet som tenderar att överraska negativt, bör vi således ha ett gott stöd med ytterligare möjligheter på uppsidan var gång prognoserna svänger mot kallt och torrt. Utöver detta finns en viss osäkerhet kring EU Parlamentet och ministerrådets förhandlingar kring överskottet på utsläppsrätter vilket kommer att ge möjligheter för våra investerare i certifikat både på utsläppsrätter och el.
Energiunderskott tillsammans med osäkerhet kring kärnkraftsverken inför vintern talar för högre elpris. Vi tror på: LONG EL
Livsmedel
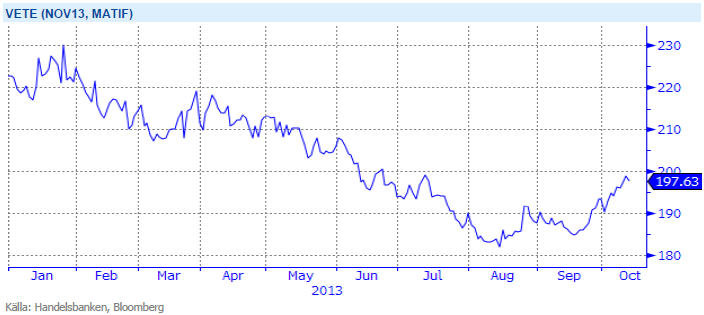
USDA är stängt – viktiga rapporter uteblir
Till följd av budgetbråket i USA är amerikanska jordbruksdepartementet, USDA, stängt och därmed får marknaden inte ta del av en mängd viktiga rapporter, däribland dagens WASDE-rapport. Utan de viktiga rapporterna famlar marknaden lite i blindo och det är därför svårt att sia om vilket håll prisutvecklingen ska gå. Priset på vete har under veckan stigit med dryga 2 %, delvis drivet av problemen i Ryssland där för mycket regn har drabbat både vår- och höstveteskörden. Situationen har dock förbättrats något under veckan. En fortsatt uppgång för vete är svårt att se då det finns gott om vete att tillgå i världen och med en förväntad stor skörd i det viktiga exportlandet Australien på ingående är det svårt att se att uppgången fortsätter. Men som sagt, läget är svårt att uppskatta utan de viktiga marknadsrapporterna från USDA.
Majspriset har till motsats fallit med 2 % under veckan. Skörden i USA fortsätter i bra takt utan regn med avkastning och kvalitet bättre än väntat. I september månads WASDE-rapport uppgavs avkastningsnivån för den amerikanska majsen till 155,3 bushels per acre – den skördedata som kommer in pekar på nivåer klart högre och nivåer strax över 158 bushels per acre verkar allt fler se som mer rimligt. Vi är för tillfället ganska neutrala i vår vy för majsen men en mindre nedgång, när/om en WASDE-rapport väl bekräftar en förväntad uppjustering av avkastningsnivå och lagernivå, bör kunna få priserna att backa ned något igen. Se dock upp med fortsatta utvecklingen av sådden i Argentina – för tillfället är det alldeles för torrt men än finns tid.
Missa inte vårt case på kakao som skickades ut i veckan. Läs caset här: Trading Case Kakao
Med torka vid Afrikas västkust som ett orosmoln över årets skörd och ett högt pris på kakaosmör ser vi en fortsatt uppgång av kakaopriset nu när vi går in i en period med flera chokladintensiva högtider. Vi tror på: BULL KAKAO
Handelsbankens Råvaruindex
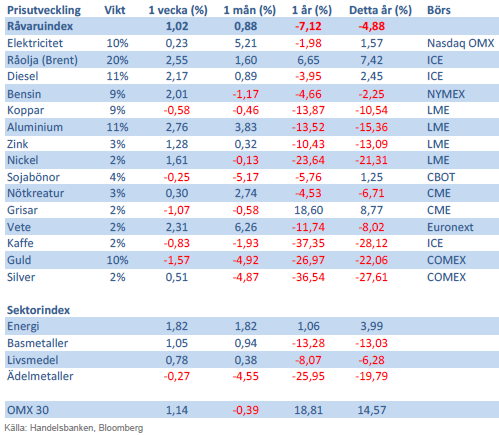
Handelsbankens råvaruindex består av de underliggande indexen för respektive råvara. Vikterna är bestämda till hälften från värdet av nordisk produktion (globala produktionen för sektorindex) och till hälften från likviditeten i terminskontrakten.
[box]SHB Råvarubrevet är producerat av Handelsbanken och publiceras i samarbete och med tillstånd på Råvarumarknaden.se[/box]
Ansvarsbegränsning
Detta material är producerat av Svenska Handelsbanken AB (publ) i fortsättningen kallad Handelsbanken. De som arbetar med innehållet är inte analytiker och materialet är inte oberoende investeringsanalys. Innehållet är uteslutande avsett för kunder i Sverige. Syftet är att ge en allmän information till Handelsbankens kunder och utgör inte ett personligt investeringsråd eller en personlig rekommendation. Informationen ska inte ensamt utgöra underlag för investeringsbeslut. Kunder bör inhämta råd från sina rådgivare och basera sina investeringsbeslut utifrån egen erfarenhet.
Informationen i materialet kan ändras och också avvika från de åsikter som uttrycks i oberoende investeringsanalyser från Handelsbanken. Informationen grundar sig på allmänt tillgänglig information och är hämtad från källor som bedöms som tillförlitliga, men riktigheten kan inte garanteras och informationen kan vara ofullständig eller nedkortad. Ingen del av förslaget får reproduceras eller distribueras till någon annan person utan att Handelsbanken dessförinnan lämnat sitt skriftliga medgivande. Handelsbanken ansvarar inte för att materialet används på ett sätt som strider mot förbudet mot vidarebefordran eller offentliggörs i strid med bankens regler.


Rebounding along with most markets. But concerns over solidity of Gaza peace may also contribute. Brent crude fell 0.8% yesterday to $61.91/b and its lowest close since May this year. This morning it is bouncing up 0.9% to $62.5/b along with a softer USD amid positive sentiment with both equities and industrial metals moving higher. Concerns that the peace in Gaza may be less solid than what one might hope for also yields some support to Brent. Bets on tech stocks are rebounding, defying fears of trade war. Money moving back into markets. Gold continues upwards its strong trend and a softer dollar helps it higher today as well.

US crude & products probably rose 5.6 mb last week (API) versus a normal seasonal decline of 2.4 mb. The US API last night partial and thus indicative data for US oil inventories. Their data indicates that US crude stocks rose 7.4 mb last week, gasoline stocks rose 3.0 mb while Distillate stocks fell 4.8 mb. Altogether an increase in commercial crude and product stocks of 5.6 mb. Commercial US crude and product stocks normally decline by 2.4 mb this time of year. So seasonally adjusted the US inventories rose 8 mb last week according to the indicative numbers by the API. That is a lot. Also, the counter seasonal trend of rising stocks versus normally declining stocks this time of year looks on a solid pace of continuation. If the API is correct then total US crude and product stocks would stand 41 mb higher than one year ago and 6 mb higher than the 2015-19 average. And if we combine this with our knowledge of a sharp increase in production and exports by OPEC(+) and a large increase in oil at sea, then the current trend in US oil inventories looks set to continue. So higher stocks and lower crude oil prices until OPEC(+) switch to cuts. Actual US oil inventory data today at 18:00 CET.
US commercial crude and product stocks rising to 1293 mb in week 41 if last nights indicative numbers from API are correct.

Crude oil soon coming to a port near you. OPEC has lifted production sharply higher this autumn. At the same time demand for oil in the Middle-East has fallen as we have moved out of summer heat and crude oil burn for power for air-conditioning. The Middle-East oil producers have thus been able to lift exports higher on both accounts. Crude oil and condensates on water has shot up by 177 mb since mid-August. This oil is now on its way to ports around the world. And when they arrive, it will likely help to lift stocks onshore higher. That is probably when we will lose the last bit of front-end backwardation the the crude oil curves. That will help to drive the front-month Brent crude oil price down to the $60/b line and revisit the high $50ies/b. Then the eyes will be all back on OPEC+ when they meet in early November and then again in early December.
Crude oil and condensates at sea have moved straight up by 177 mb since mid-August as OPEC(+) has produced more, consumed less and exported more.

When it starts to move lower it moves rather quickly. Gaza, China, IEA. Brent crude is down 2.1% today to $62/b after having traded as high as $66.58/b last Thursday and above $70/b in late September. The sell-off follows the truce/peace in Gaze, a flareup in US-China trade and yet another bearish oil outlook from the IEA.
A lasting peace in Gaze could drive crude oil at sea to onshore stocks. A lasting peace in Gaza would probably calm down the Houthis and thus allow more normal shipments of crude oil to sail through the Suez Canal, the Red Sea and out through the Bab-el-Mandeb Strait. Crude oil at sea has risen from 48 mb in April to now 91 mb versus a pre-Covid normal of about 50-60 mb. The rise to 91 mb is probably the result of crude sailing around Africa to be shot to pieces by the Houthis. If sailings were to normalize through the Suez Canal, then it could free up some 40 mb in transit at sea moving onshore into stocks.
The US-China trade conflict is of course bearish for demand if it continues.
Bearish IEA yet again. Getting closer to 2026. Credibility rises. We expect OPEC to cut end of 2025. The bearish monthly report from the IEA is what it is, but the closer we get to 2026, the more likely the IEA is of being ball-park right in its outlook. In its monthly report today the IEA estimates that the need for crude oil from OPEC in 2026 will be 25.4 mb/d versus production by the group in September of 29.1 mb/d. The group thus needs to do some serious cutting at the end of 2025 if it wants to keep the market balanced and avoid inventories from skyrocketing. Given that IEA is correct that is. We do however expect OPEC to implement cuts to avoid a large increase in inventories in Q1-26. The group will probably revert to cuts either at its early December meeting when they discuss production for January or in early January when they discuss production for February. The oil price will likely head yet lower until the group reverts to cuts.
Dubai: The Mid-East anchor dragging crude oil lower. Surplus emerging in Mid-East pricing. Crude oil prices held surprisingly strong all through the summer. A sign and a key source of that strength came from the strength in the front-end backwardation of the Dubai crude oil curve. It held out strong from mid-June and all until late September with an average 1-3mth time-spread premium of $1.8/b from mid-June to end of September. The 1-3mth time-spreads for Brent and WTI however were in steady deterioration from late June while their flat prices probably were held up by the strength coming from the Persian Gulf. Then in late September the strength in the Dubai curve suddenly collapsed. Since the start of October it has been weaker than both the Brent and the WTI curves. The Dubai 1-3mth time-spread now only stands at $0.25/b. The Middle East is now exporting more as it is producing more and also consuming less following elevated summer crude burn for power (Aircon) etc.
The only bear-element missing is a sudden and solid rise in OECD stocks. The only thing that is missing for the bear-case everyone have been waiting for is a solid, visible rise in OECD stocks in general and US oil stocks specifically. So watch out for US API indications tomorrow and official US oil inventories on Thursday.
No sign of any kind of fire-sale of oil from Saudi Arabia yet. To what we can see, Saudi Arabia is not at all struggling to sell its oil. It only lowered its Official Selling Prices (OSPs) to Asia marginally for November. A surplus market + Saudi determination to sell its oil to the market would normally lead to a sharp lowering of Saudi OSPs to Asia. Not yet at least and not for November.
The 5yr contract close to fixed at $68/b. Of importance with respect to how far down oil can/will go. When the oil market moves into a surplus then the spot price starts to trade in a large discount to the 5yr contract. Typically $10-15/b below the 5yr contract on average in bear-years (2009, 2015, 2016, 2020). But the 5yr contract is usually pulled lower as well thus making this approach a moving target. But the 5yr contract price has now been rock solidly been pegged to $68/b since 2022. And in the 2022 bull-year (Brent spot average $99/b), the 5yr contract only went to $72/b on average. If we assume that the same goes for the downside and that 2026 is a bear-year then the 5yr goes to $64/b while the spot is trading at a $10-15/b discount to that. That would imply an average spot price next year of $49-54/b. But that is if OPEC doesn’t revert to cuts and instead keeps production flowing. We think OPEC(+) will trim/cut production as needed into 2026 to prevent a huge build-up in global oil stocks and a crash in prices. But for now we are still heading lower. Into the $50ies/b.
Some rebound but not much. Brent crude rebounded 1.5% yesterday to $65.47/b. This morning it is inching 0.2% up to $65.6/b. The lowest close last week was on Thursday at $64.11/b.
The curve structure is almost as week as it was before the weekend. The rebound we now have gotten post the message from OPEC+ over the weekend is to a large degree a rebound along the curve rather than much strengthening at the front-end of the curve. That part of the curve structure is almost as weak as it was last Thursday.
We are still on a weakening path. The message from OPEC+ over the weekend was we are still on a weakening path with rising supply from the group. It is just not as rapidly weakening as was feared ahead of the weekend when a quota hike of 500 kb/d/mth for November was discussed.
The Brent curve is on its way to full contango with Brent dipping into the $50ies/b. Thus the ongoing weakening we have had in the crude curve since the start of the year, and especially since early June, will continue until the Brent crude oil forward curve is in full contango along with visibly rising US and OECD oil inventories. The front-month Brent contract will then flip down towards the $60/b-line and below into the $50ies/b.
At what point will OPEC+ turn to cuts? The big question then becomes: When will OPEC+ turn around to make some cuts? At what (price) point will they choose to stabilize the market? Because for sure they will. Higher oil inventories, some more shedding of drilling rigs in US shale and Brent into the 50ies somewhere is probably where the group will step in.
There is nothing we have seen from the group so far which indicates that they will close their eyes, let the world drown in oil and the oil price crash to $40/b or below.
The message from OPEC+ is also about balance and stability. The world won’t drown in oil in 2026. The message from the group as far as we manage to interpret it is twofold: 1) Taking back market share which requires a lower price for non-OPEC+ to back off a bit, and 2) Oil market stability and balance. It is not just about 1. Thus fretting about how we are all going to drown in oil in 2026 is totally off the mark by just focusing on point 1.
When to buy cal 2026? Before Christmas when Brent hits $55/b and before OPEC+ holds its last meeting of the year which is likely to be in early December.
Brent crude oil prices have rebounded a bit along the forward curve. Not much strengthening in the structure of the curve. The front-end backwardation is not much stronger today than on its weakest level so far this year which was on Thursday last week.

The front-end backwardation fell to its weakest level so far this year on Thursday last week. A slight pickup yesterday and today, but still very close to the weakest year to date. More oil from OPEC+ in the coming months and softer demand and rising inventories. We are heading for yet softer levels.


Vad guldets uppgång egentligen betyder för världen

Spotpriset på guld över 4300 USD och silver över 54 USD
Crude oil soon coming to a port near you

Guld och silver stiger hela tiden mot nya höjder
The Mid-East anchor dragging crude oil lower

OPEC+ missar produktionsmål, stöder oljepriserna

Ett samtal om guld, olja, fjärrvärme och förnybar energi
Guld nära 4000 USD och silver 50 USD, därför kan de fortsätta stiga

Goldman Sachs höjer prognosen för guld, tror priset når 4900 USD
Are Ukraine’s attacks on Russian energy infrastructure working?
-
 Nyheter3 veckor sedan
OPEC+ missar produktionsmål, stöder oljepriserna
-
 Nyheter3 veckor sedan
Ett samtal om guld, olja, fjärrvärme och förnybar energi
-
 Nyheter2 veckor sedan
Guld nära 4000 USD och silver 50 USD, därför kan de fortsätta stiga
-
 Nyheter1 vecka sedan
Goldman Sachs höjer prognosen för guld, tror priset når 4900 USD
-
Analys3 veckor sedan
Are Ukraine’s attacks on Russian energy infrastructure working?
-

 Nyheter2 veckor sedan
Blykalla och amerikanska Oklo inleder ett samarbete
-

 Nyheter4 veckor sedan
Guldpriset uppe på nya höjder, nu 3750 USD
-
Nyheter2 veckor sedan
Ett samtal om guld, olja, koppar och stål