

Analys
SEB Jordbruksprodukter, 14 oktober 2013

 Vete, raps, potatis och socker gick upp förra veckan, majs och sojabönor ner. Det var en lugn vecka förra veckan, främst på grund av European Exchange, som gick av stapeln i Paris under torsdagen och fredagen. Med nästan hela den Europeiska marknaden i Paris blev handeln tunn.
Vete
November månads terminskontrakt på Matif har gått upp mot 200 euro, ett tekniskt motstånd. Det har varit en god uppgång och många kommer att vilja sälja till 200 euro. Vi gissar en det kommer en rekyl nedåt den här veckan, vilket vi tror är ett köptillfälle.
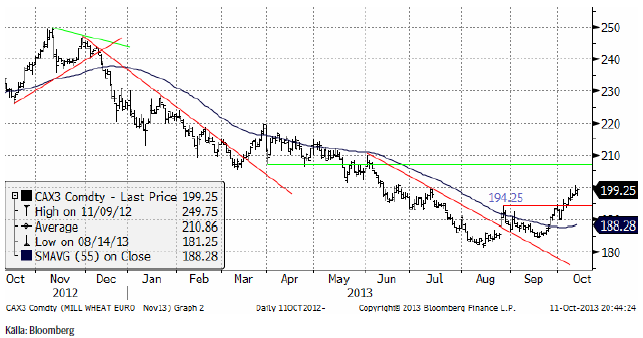
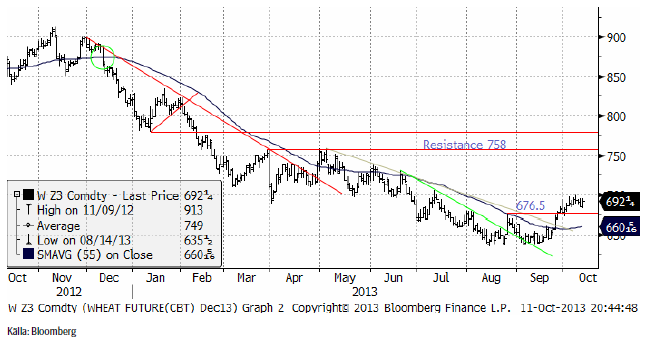
Decemberkontraktet på CBOT har haft svårt att ta sig över 700 cent, på samma sätt som Matif kämpar med 200 euro.
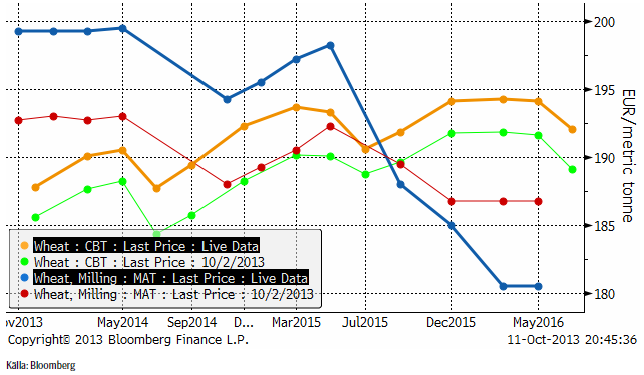
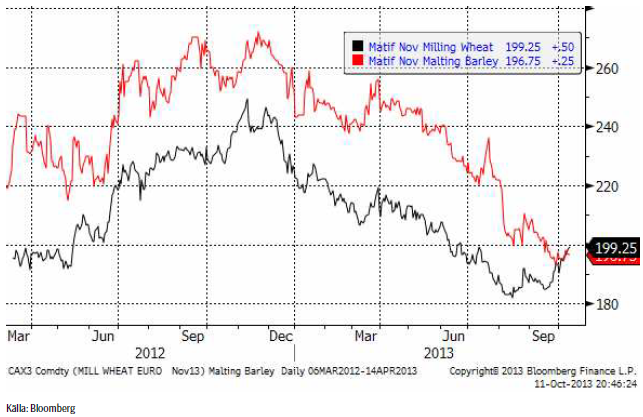
Nedan ser vi terminskurvorna för Chicagovete och Matif. Det är nästan backwardation i Matifmarknaden. Det är en återspegling av att så många lantbrukare håller på sitt vete för att de tror att priset ska stiga. Istället borde de sälja sin spannmål och ta sin position genom att köpa terminer. Det bytet innebär samma position i marknaden, samma antal ton, men pengar på banken (räntevinst), ingen risk för försämring av varan i lager och möjligheten att köpa på termin utan terminspåslag.
GASC ratade erbjudandena i veckan därför att man tyckte att priset var för högt.
Argentinas BAGE estimerade den kommande Argentinska veteskörden till drygt 10 mt. USDA:s senaste WASDE i september angav den till 12 mt.
 USA:s jordbruksdepartement är stängt pga budgetproblemen, vilket innebär att vi inte har några crop conditions, inga exportsiffror och ingen WASDE-rapport. Den skulle ha kommit den 11 september och analytikerna behöver ca 10 dagar på sig. Det innebär att den kan komma först den 24 oktober. Då är det nästan ingen idé att publicera den, vilket kan innebära att den helt kommer att utgå.
Även Europa var lugnt mot slutet av veckan på grund av European Exchange i Paris i torsdags och fredags. European Exchange är en mötesplats för alla i den europeiska spannmålsbranschen.
Den långsamma sådden i Ukraina är en faktor som påverkat prisutvecklingen positivt. Nu har vädret blivit bättre, vilket gör att höstarbetet underlättas.
Vi får en del frågor om optioner. Den som vill köpa en option via SEB kan göra det. Det behövs ett ramavtal, men däremot behöver banken inte göra en kreditprövning och man behöver inte heller ställa säkerhet, eftersom man som kund betalar priset (”premien”) i början och sedan erhåller eventuellt realvärde vid optionens lösen. Man behöver inte heller påkalla lösen själv, utan det sköts automatiskt till kontot i banken.
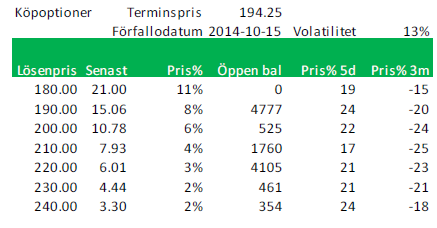
Det är så kort tid kvar till förfallet för novemberterminen 2013, så nedan ser vi priserna på köpoptioner på Matif på November-2014 (Matif vete). Notera att volatiliteten 13% är ganska låg. Volatiliteten brukar vara låg när priserna är låga.
Nedanstående optioner är köpoptioner. Terminen (Nov 2014) handlas i 194.25 euro per ton. En köpoption om ett ton vete, som ger rätt att köpa vete för 200 euro kostar 10.78 euro, eller 6% av 194.25 euro. När man köper optionen får man betala det beloppet (plus lite till för säljkurs, detta är senast betalt). Om priset i oktober (vid förfall) nästa år är 250 euro på terminen betalar banken 50 euro till optionsinnehavaren (omräknat till kronor om man vill och kommer överens om det). Om terminen står i 190 euro (under lösenpriset) förfaller optionen värdelös och inget belopp betalas ut.
Nedanstående är priser på säljoptioner. Om du köpt optionen med lösenpris 200 euro (för 16.51) och terminen i oktober nästa år står i 180 euro, betalar banken ut 20 euro. Om terminspriset är över 200 euro betalar banken inte ut någonting alls och optionen förfaller värdelös.
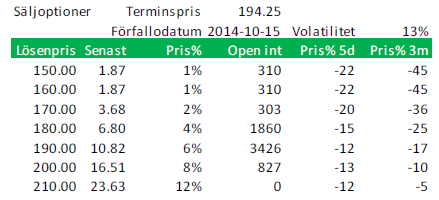
En del använder optioner för att spekulera kortsiktigt. Som du ser av kolumnen Pris% 5d, som visar den procentuella prisförändringen på respektive option, rör sig priser på optioner med en väsentlig utväxling i förhållande till förändringar i terminspriset.
Vi har alltså köprekommendation på vete, men tror att en rekyl nedåt kan komma. Vi betraktar en sådan rekyl nedåt som ett köptillfälle.
Maltkorn
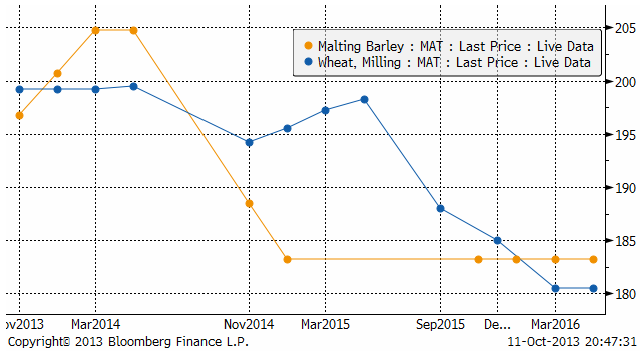
Terminspriset (november) ligger återigen under Matif:s kvarnvetekontrakt för november.
Som vi ser av diagrammet nedan, ligger novembers maltkornskontrakt under vetet, men januari, mars och maj ligger alla över. Det indikerar ett ”överutbud” av maltkorn just nu och / eller en brist på kvarnvete.
Majs
Majspriset (december 2013) har fortsatt att falla. Nyhetsflödet har gett bränsle åt nedgången: Dels har siffrorna på väntad skörd per acre i USA fortsatt att förbättras, dels har brasilianska CONAB estimerat landets skörd 2014 till 78 – 80 mt i veckan. Det ska jämföras med USDA:s senaste estimat på 72 mt. Tidigare rapporter indikerade också lägre sådd av majs och motsvarande mer av sojabönor. Även på efterfrågesidan har negativ information kommit. Amerikanska EPA väntas sänka inblandningsmandatet av etanol i bensin med 1.4 miljarder gallons, vilket leder till en minskad efterfrågan på majs med upp till 500 miljoner bushels. Efterfrågan till etanol har inte ökat alls de senaste åren, efter att man kommit upp i 10% (”blending wall”) etanol.
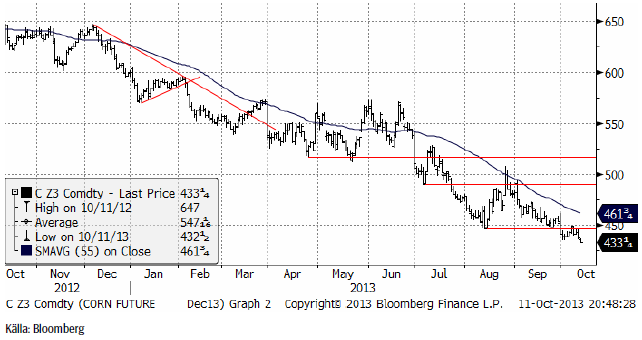
Det är oroväckande att majsen handlats så svagt, men vi tror ändå att priserna är nära botten och att förhållandet mellan sojabönor (oljeväxter) och majs (spannmål) leder till mindre produktion av majs – med högre pris i framtiden som konsekvens.
Vi väljer att hålla fast vid köprekommendationen.
Sojabönor
Novemberkontraktet på sojabönor slutade förra veckan med ett rejält prisfall. Priset närmar sig den nivå på 1250 som vi talade om för några veckor sedan. Bakom fredagens prisfall låg samma faktor som bakom prisfallet i majsmarknaden – en oro för att EPA ska komma att sänka inblandningskravet avseende biobränslen, i fallet för sojabönor gällde det biodiesel.
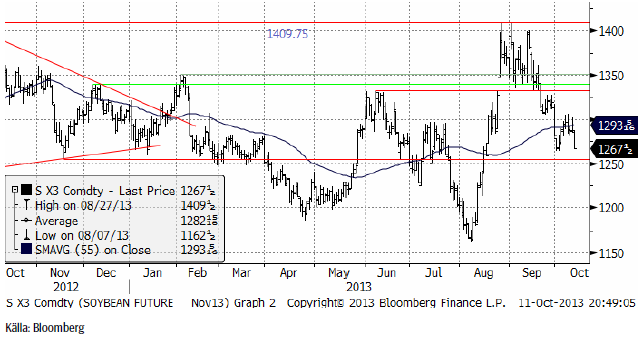
Brasilianska CONAB estimerar landets skörd 2014 till 87.6 – 89.7 mt. Det är något högre än USDA:s 88 mt.
I USA talar en del nu, något oväntat, om en skörd på 43 bushels per acre. Efter torkan i augusti har marknaden tagit emot en serie av estimat från privata firmor och analytiker som visar på bättre skörd än befarat.
Vi behåller säljrekommendation.
Raps
Rapspriset (november 2013) fortsatte att stiga i början av förra veckan efter beskedet om att en strafftull kommer att införas mot 90% av EU:s import av biodiesel. Den här frågan var ”snackisen” på European Exchange som gick av stapeln i Paris i torsdags och fredags. Samtalet rörde främst ”vem” som fått kännedom om beslutet innan det offentliggjordes.
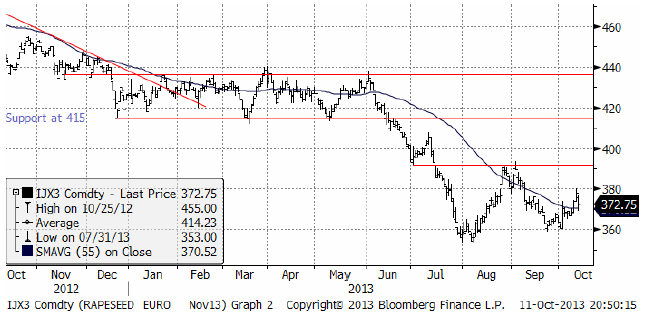
Vi behåller säljrekommendationen på raps.
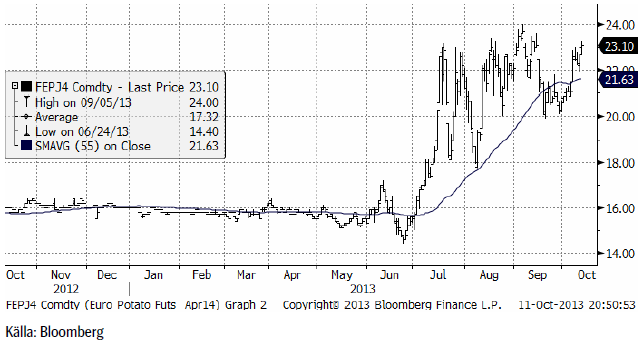
Potatis
Potatispriset av årets skörd, som handlas i april-kontraktet på Eurex, har vänt upp till den högsta nivån på en månad, en uppgång från början av oktober med 15%, till 23.10 euro per dt. 24 euro ser ut att vara inom räckhåll.
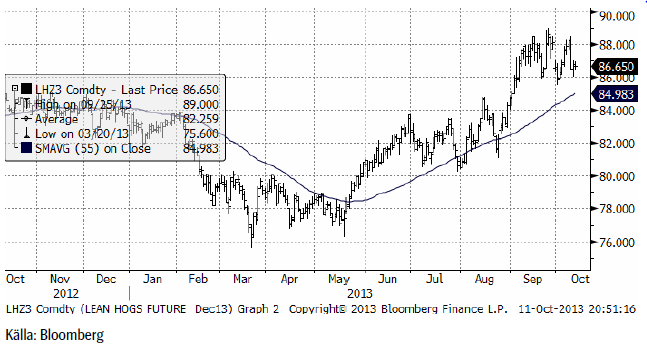
Gris
Prist på Lean Hogs fortsatta att röra sig ”sidledes” inom vad vi tolkar som en ”toppformation”, baserat på kända mönster inom den tekniska analys-skolan.
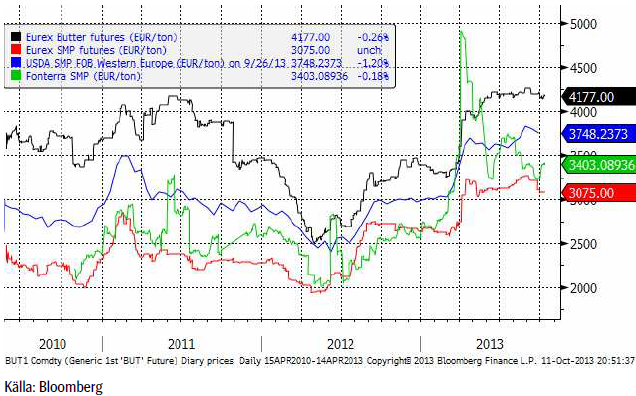
Mjölk
Terminerna på smör och skummjölkspulver vid Eurex-börsen var stabila och rörde sig inte mycket under veckan som gick. Fonterras pris steg något, efter det kraftiga prisfall från toppen som varit.
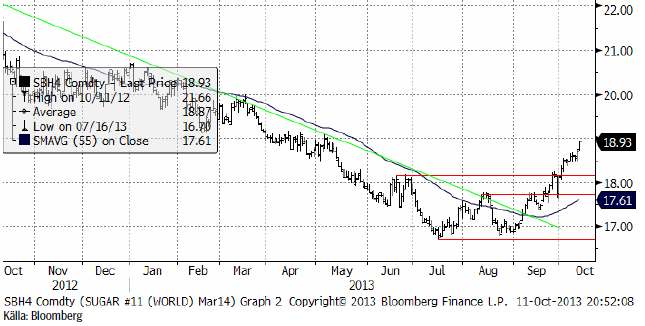
Socker
Marskontraktet på råsocker steg kraftigt upp till 18.93 cent på marskontraktet. Vid 19 cent finns ett starkt motstånd och det skulle inte förvåna om vinsthemtagningar sätter in, som kan ta ner priset till 18 cent. Vi tror att det, om det händer, är ett utmärkt köptillfälle.
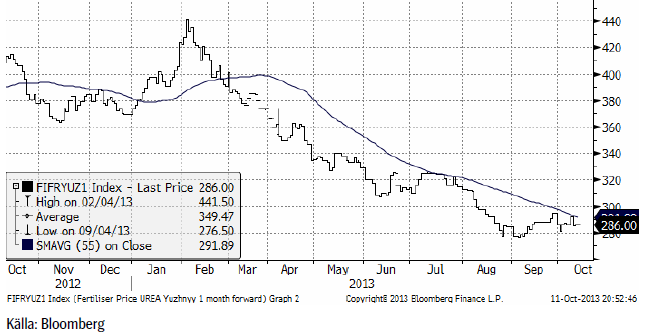
Gödsel
Priset på kväve / urea var stabilt i veckan som gick med endast små kursförändringar.
[box]SEB Veckobrev Jordbruksprodukter är producerat av SEB Commodities Sales desk och publiceras i samarbete och med tillstånd på Råvarumarknaden.se[/box]
Detta marknadsföringsmaterial, framtaget av SEB’s Commodities Sales desk, har upprättats enbart i informationssyfte.
Även om innehållet är baserat på källor som SEB bedömt som tillförlitliga ansvarar SEB inte för fel eller brister i informationen. Den utgör inte oberoende, objektiv investeringsanalys och skyddas därför inte av de bestämmelser som SEB har infört för att förebygga potentiella intressekonflikter. Yttranden från SEB’s Commodities Sales desk kan vara oförenliga med tidigare publicerat material från SEB, då den senare hänvisas uppmanas du att läsa den fullständiga rapporten innan någon åtgärd vidtas.
Dokumentationen utgör inte någon investeringsrådgivning och tillhandahålls till dig utan hänsyn till dina investeringsmål. Du uppmanas att självständigt bedöma och komplettera uppgifterna i denna dokumentation och att basera dina investeringsbeslut på material som bedöms erforderligt. Alla framåtblickande uttalanden, åsikter och förväntningar är föremål för risker, osäkerheter och andra faktorer och kan orsaka att det faktiska resultatet avviker väsentligt från det förväntade. Historisk avkastning är ingen garanti för framtida resultat. Detta dokument utgör inte ett erbjudande att teckna några värdepapper eller andra finansiella instrument. SEB svarar inte för förlust eller skada – direkt eller indirekt, eller av vad slag det vara må – som kan uppkomma till följd av användandet av detta material eller dess innehåll.
Observera att det kan förekomma att SEB, dess ledamöter, dess anställda eller dess moder- och/eller dotterbolag vid olika tillfällen innehar, har innehaft eller kommer att inneha aktier, positioner, rådgivningsuppdrag i samband med corporate finance-transaktioner, investment- eller merchantbankinguppdrag och/eller lån i de bolag/finansiella instrument som nämns i materialet.
Materialet är avsett för mottagaren, all spridning, distribuering mångfaldigande eller annan användning av detta meddelande får inte ske utan SEB:s medgivande. Oaktat detta får SEB tillåta omfördelning av materialet till utvald tredje part i enlighet med gällande avtal. Materialet får inte spridas till fysiska eller juridiska personer som är medborgare eller har hemvist i ett land där sådan spridning är otillåten enligt tillämplig lag eller annan bestämmelse.
Skandinaviska Enskilda Banken AB (publ) är ett [publikt] aktiebolag och står under tillsyn av Finansinspektionen samt de lokala finansiella tillsynsmyndigheter i varje jurisdiktionen där SEB har filial eller dotterbolag.

Wild moves yesterday. Brent crude traded to a high of $114.43/b and a low of $96.0/b and closed at $99.94/b yesterday.

US – Iran negotiations ongoing or not? What a day. Donald Trump announced that good talks were ongoing between Iran and the US and that the 48 hour deadline before bombing Iranian power plants and energy infrastructure was postponed by five days subject to success of ongoing meetings. Iranian media meanwhile stated that no meetings were ongoing at all.
Today we are scratching our heads trying to figure out what yesterday was all about.
Friends and family playing the market? Was it just Trump and his friends and family who were playing with oil and equity markets with $580m and $1.46bn in bets being placed by someone in oil and equity markets just 15 minutes before Trump’s announcement?
Was Trump pulling a TACO as he reached his political and economic pain point: Brent at $112/b, US Gas at $4/gal, SPX below 200dma and US 10yr above 4.4%?
Different Iranian factions with Trump talking with one of them? Are there real negotiations going on but with the US talking to one faction in Iran while another, the hardliners, are not involved and are denying any such negotiations going on?
Extending the ultimatum to attack and invade Kharg island next weekend? Or, is the five day delay of the deadline a tactical decision to allow US amphibious assault ships and marines to arrive in the Gulf in the upcoming weekend while US and Israeli continues to degrade Iranian military targets till then. And then next weekend a move by the US/Israel to attack and conquer for example the Kharg island?
We do not really know which it is or maybe a combination of these.
We did get some kind of TACO ydy. But markets have been waiting for some kind of TACO to happen and yesterday we got some kind of TACO. And Brent crude is now trading at $101.5/b as a result rather than at $112-114/b as it did no the high yesterday.
But what really matters in our view is the political situation on the ground in Iran. Will hardliners continue to hold power or will a more pragmatic faction gain power?
If the hardliners remain in power then oil pain should extend all the way to US midterm elections. The hardliners were apparently still in charge as of last week. Iran immediately retaliated and damaged LNG infrastructure in Qatar after Israel hit Iranian South Pars. The SoH was still closed and all messages coming out of Iran indicated defiance. Hardliners continues in power has a huge consequence for oil prices going forward. The regime has played its ’oil-weapon’ (closing or chocking the Strait of Hormuz). It is using it to achieve political goals. Deterrence: it needs to be so politically and economically expensive to attack Iran that it won’t happen again in the future. Or at least that the US/Israel thinks 10-times over before they attack again. The highest Brent crude oil closing price since the start of the war is $112.19/b last Friday. In comparison the 20-year inflation adjusted Brent price is $103/b. So Brent crude last Friday at $112.19/b isn’t a shockingly high price. And it is still far below the nominal high of $148/b from 2008 which is $220/b if inflation adjusted. So once in a lifetime Iran activates its most powerful weapon. The oil weapon. It needs to show the power of this weapon and it needs to reap political gains. Getting Brent to $112/b and intraday high of $119.5/b (9 March) isn’t a display of the power of that weapon. And it is not a deterrence against future attacks.
So if the hardliners remain in power in Iran, then the SoH will likely remain chocked all the way to US midterm elections and Brent crude will at a minimum go above the historical nominal high of $148/b from 2008.
Thus the outlook for the oil price for the rest of the year doesn’t depend all that much of whether Trump pulls a TACO or not. Stops bombing or not. It depends more on who is in charge in Iran. If it is the hardliners, then deterrence against future attacks via chocking of the SoH and high oil prices is the likely line of action. It is impacting the world but the Iranian ’oil-weapon’ is directed towards the US president and the the US midterm elections.
If a pragmatic faction gets to power in Iran, then a very prosperous future is possible. However, if power is shifting towards a more pragmatic faction in Iran then a completely different direction could evolve. Such a faction could possibly be open for cooperation with the US and the GCC and possibly put its issues versus Israel aside. Then the prosperity we have seen evolving in Dubai could be a possible future also for Iran.
So far it looks like the hardliners are fully in charge. As far as we can see, the hardliners are still fully in control in Iran. That points towards continued chocking of the SoH and oil prices ticking higher as global inventories (the oil market buffers) are drawn lower. And not just for a few more weeks, but possibly all the way to the US midterm elections.
A brief sigh of relief yesterday as oil infra at Kharg wasn’t damaged. But higher today. Brent crude dabbled around a bit yesterday in relief that oil infrastructure at Iran’s Kharg island wasn’t damaged. It traded briefly below the 100-line and in a range of $99.54 – 106.5/b. Its close was near the low at $100.21/b.
No easy victorious way out for Trump. So no end in sight yet. Brent is up 3.2% today to $103.4/b with no signs that the war will end anytime soon. Trump has no easy way to declare victory and mission accomplished as long as Iran is in full control of the Strait of Hormuz while also holding some 440 kg of uranium enriched to 60% and not far from weapons grade at 90%. As long as these two factors are unresolved it is difficult for Trump to pull out of the Middle East. Naturally he gets increasingly frustrated over the situation as the oil price and US retail gas prices keeps ticking higher while the US is tied into the mess in the Middle East. Trying to drag NATO members into his mess but not much luck there.
When commodity prices spike they spike 2x, 3x, 4x or 5x. Supply and demand for commodities are notoriously inflexible. When either of them shifts sharply, the the price can easily go to zero (April 2022) or multiply 2x, 3x, or even 5x of normal. Examples in case cobalt in 2025 where Kongo restricted supply and the price doubled. Global LNG in 2022 where the price went 5x normal for the full year average. Demand for tungsten in ammunition is up strongly along with full war in the middle east. And its price? Up 537%.
Why hasn’t the Brent crude oil price gone 2x, 3x, 4x or 5x versus its normal of $68/b given close to full stop in the flow of oil of the Strait of Hormuz? We are after all talking about close to 20% of global supply being disrupted. The reason is the buffers. It is fairly easy to store oil. Commercial operators only hold stocks for logistical variations. It is a lot of oil in commercial stocks, but that is predominantly because the whole oil system is so huge. In addition we have Strategic Petroleum Reserves (SPRs) of close to 2500 mb of crude and 1000 mb of oil products. The IEA last week decided to release 400 mb from global SPR. Equal to 20 days of full closure of the Strait of Hormuz. Thus oil in commercial stocks on land, commercial oil in transit at sea and release of oil from SPRs is currently buffering the situation.
But we are running the buffers down day by day. As a result we see gradually increasing stress here and there in the global oil market. Asia is feeling the pinch the most. It has very low self sufficiency of oil and most of the exports from the Gulf normally head to Asia. Availability of propane and butane many places in India (LPG) has dried up very quickly. Local prices have tripled as a result. Local availability of crude, bunker oil, fuel oil, jet fuel, naphtha and other oil products is quickly running down to critical levels many places in Asia with prices shooting up. Oman crude oil is marked at $153/b. Jet fuel in Singapore is marked at $191/b.
Oil at sea originating from Strait of Hormuz from before 28 Feb is rapidly emptied. Oil at sea is a large pool of commercial oil. An inventory of oil in constant move. If we assume that the average journey from the Persian Gulf to its destinations has a volume weighted average of 13.5 days then the amount of oil at sea originating from the Persian Gulf when the the US/Israel attacked on 28 Feb was 13.5 days * 20 mb/d = 269 mb. Since the strait closed, this oil has increasingly been delivered at its destinations. Those closest to the Strait, like Pakistan, felt the emptying of this supply chain the fastest. Propane prices shooting to 3x normal there already last week and restaurants serving cold food this week is a result of that. Some 50-60% of Asia’s imports of Naphtha normally originates from the Persian Gulf. So naphtha is a natural pain point for Asia. The Gulf also a large and important exporter of Jet fuel. That shut in has lifted jet prices above $200/b.
To simplify our calculations we assume that no oil has left the Strait since that date and that there is no increase in Saudi exports from Yanbu. Then the draining of this inventory at sea originated from the Persian Gulf will essentially look like this:
The supply chain of oil at sea originating from the Strait of Hormuz is soon empty. Except for oil allowed through the Strait of Hormuz by Iran and increased exports from Yanbu in the Red Sea. Not included here.

Oil at sea is falling fast as oil is delivered without any new refill in the Persian Gulf. Waivers for Russian crude is also shifting Russian crude to consumers. Brent crude will likely start to feel the pinch much more forcefully when oil at sea is drawn down another 200 mb to around 1000 mb. That is not much more than 10 days from here.

Oil and oil products are starting to become very pricy many places. Brent crude has still been shielded from spiking like the others.

Closing at highest since Aug 2022. Brent crude gained 9.2% yesterday. The trading range was limited to $95.2 – 101.85/b with a close at $100.46/b and higher than the Monday close of $98.96/b. Ydy close was the highest close since August 2022. This morning Brent is up 2% to $102.4/b and is trading at the highest intraday level since Monday when it high an intraday high of $119.5/b.
A military hit at Iran’s Kharg island would be a big, big bang for the oil price. The big, big risk for the weekend is that oil infrastructure could be damaged. For example Iran’s Kharg island which is Iran’s major oil export hub. If damaged we would have a longer lasting loss of supply stretching way beyond Trump’s announced ”two more weeks”. It will make the spot price spike higher and it will lift the curve. Brent crude 2027 swap would jump above $80/b immediately. An attack on Kharg island would naturally lead Iran to strike back at other oil infrastructures in the Gulf. Especially those belonging to countries who harbor US military bases. I.e. countries who essentially are supporting the attack by US and Israel towards Iran. Though if not in spirit, then in practical operational terms. An attack on Kharg island would not just lead to a lasting outage of supply from Iran until it would be repaired. It would immediately endanger other oil infrastructure in the region as well and additional lasting loss of supply.
No one in their right mind would dare to sit short oil over the coming weekend. Oil is thus set to close the week at a very strong note today.
Prepare for another 400 mb SPR release next week. This week’s announcement of a 400 mb release from Strategic Oil Reserves totally underwhelmed the market with the oil price going higher rather than lower following the announcement. For one it means that the market expects the war and the closure of the Strait of Hormuz to last longer than Trump’s recent announced ”two more weeks”. 400 mb only amounts to 20 days of lost supply to the world through Hormuz and we are already at day 14. So next week when we are getting close to the 20 day mark, we are likely to see another announcement of another 400 mb release of SPR stocks to the market. Preparing for the next 20 days of war.
Global oil logistics in total disarray. We have previously addressed the issue of the huge logistical web of the global oil market which is now in total disarray. The logistical disruption started to fry the oil market at the end of last week. Helped to spike the oil market on Monday. What we hear from our shipping clients is that the problems with supply of fuels locally in Korea, Singapore, India and Africa are getting worse with physical availability of fuels there drying up. It is getting increasingly difficult to find physical supply of bunker oil with local, physical prices shooting way higher than financial benchmarks. To the point that biofuels have become the cheap option many places. Availability of fuels in the US is still good. Not so surprising as the US is self-sufficient with crude and refineries.
The disruption in global oil logistics doesn’t seem to improve. Rather the opposite. If you cannot get fuel to run your ships, then how can you distribute fuels to where it is needed.
Buy Brent Dec-2026 calls with strike $150/b!! As the days goes by the oil price is ticking higher while Trump is getting one day closer to US midterm elections. Trump was betting that he could put this war to bead well before November. But that will probably not be up to him to decide. It will be up to Iran to decide when to reopen the Strait of Hormuz. It is very hard to imagine that Iran will let Trump easily off the hock after he has killed its Supreme Leader. This will likely go all the way to November. Buy Brent Dec-2026 calls with strike $150/b!!
Brent closed at highest since 2022 ydy. Will end this Friday at a very strong note! Consumers still dreaming of $60/b oil


Christian Kopfer om läget för oljan

Marknaden måste börja betrakta de höga kopparpriserna som det nya normala

Det fysiska spotpriset på brentolja har slagit nytt rekord

40 minuter med Javier Blas om hur världen verkligen påverkas av energikrisen

Efter tillväxten: Guldbrev satsar på expansion i Europa
40 minuter med Javier Blas om hur världen verkligen påverkas av energikrisen

Elpriserna fördubblas, stor osäkerhet inför sommaren

MP Materials, USA:s svar på Kinas dominans över sällsynta jordartsmetaller
Det fysiska spotpriset på brentolja har slagit nytt rekord

Studsvik har idag ansökt om att få bygga 1200-1600 MW kärnkraft i Valdemarsvik
-
 Nyheter2 veckor sedan
40 minuter med Javier Blas om hur världen verkligen påverkas av energikrisen
-
 Nyheter3 veckor sedan
Elpriserna fördubblas, stor osäkerhet inför sommaren
-
 Nyheter4 veckor sedan
MP Materials, USA:s svar på Kinas dominans över sällsynta jordartsmetaller
-
 Nyheter2 veckor sedan
Det fysiska spotpriset på brentolja har slagit nytt rekord
-
 Nyheter4 veckor sedan
Studsvik har idag ansökt om att få bygga 1200-1600 MW kärnkraft i Valdemarsvik
-
 Nyheter2 veckor sedan
Marknaden måste börja betrakta de höga kopparpriserna som det nya normala
-

 Nyheter4 veckor sedan
Matproduktion är beroende av gödsel, Gulfkriget skapar brist
-
Analys4 veckor sedan
TACO (or Whatever It Was) Sends Oil Lower — Iran Keeps Choking Hormuz