

Analys
SIP Nordic – Råvaruguiden – maj 2013

 Guld, olja och råvarubolag
Som författare av ett månatligt råvarubrev vore det närmast kriminellt att inte kommentera guldets ras och återhämtning(?) i april. Det har dock hänt andra spännande saker som bör nämnas.
Efter det kraftiga raset för två veckor sedan, det största nedstället på 30 år har säljarna lugnat ned sig. Guldet har de senaste 9 dagarna haft den största 9 dagarsuppgången på två år. Uppgången har återtagit nästan hälften av raset i april.
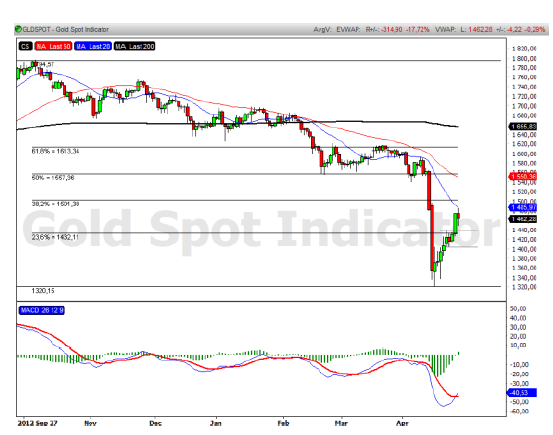
200 dagars medelvärde börjar nu peka nedåt och den stora frågan är nu om det 9 senaste dagarnas uppgång var en rekyl i en nedgång eller en början på en uppgång. Den senaste veckans uppgång är mer stabil än raset i mitten av april vilket är sunt för en fortsatt uppgång.
Brent och WTI nära varandra
Världspriset på olja har likt guldet också haft en spännande månad. Störst stryk har Brent tagit. Skillnaden i pris mellan de två mest handlade oljorna brent och WTI är nu det lägsta på 18 månader. Det kliar lite i fingrarna på att fortsatt spekulera i att prisskillnaden krymper ytterligare. Historiskt sett har WTI prissats dyrare än brent. Sedan 2008 är det dock den omvända relationen som gäller.
Nya råvarubolag
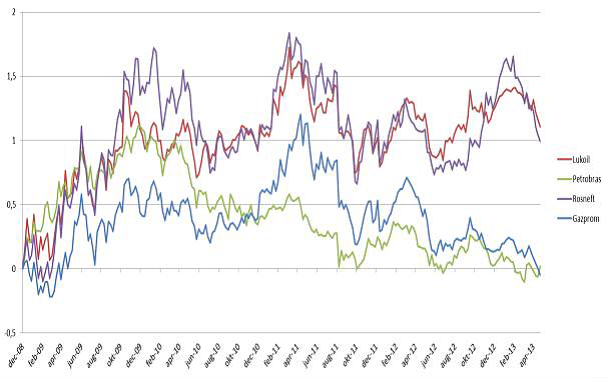
När oljepriset sjunker påverkar det priset på ett olje-relaterat bolag till viss del. Sedan tidigare är det möjligt att handla Africa Oil, BP och Lundin Petroleum med RBS Mini Futures. Nu breddar RBS utbudet och lanserar Mini Futures med Gazprom, Rosneft Oil, Petrobras och Lukoil som underliggande.
Alexander Frick
Råvaror – Energi
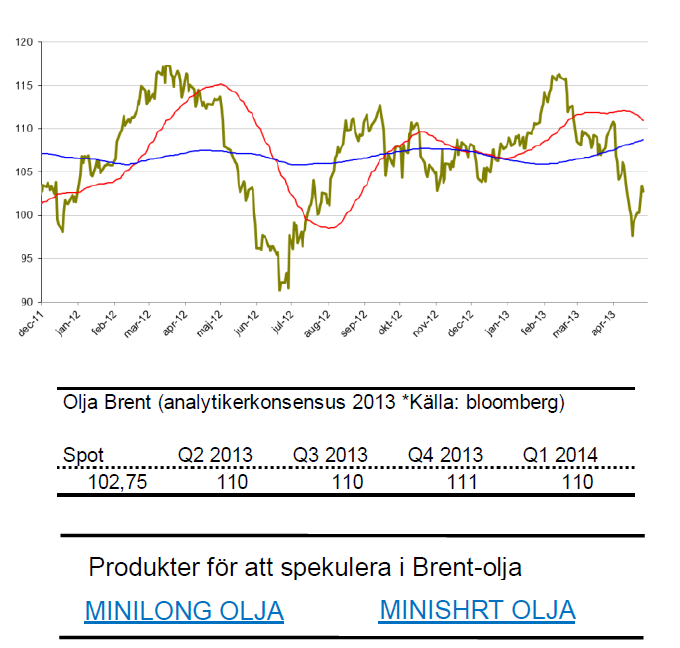
Brent olja
- Likt guld har olja svängt kraftigt under april. Efter ett stort ras har brent återhämtat sig något och handlas återigen över $100.
- Under april har brent tappat 6,5 % och är för året ned drygt 6,5 %.
- OPEC-nationerna har en agenda att hålla oljepriset över $100 och drar nu ned på produktionen. Sett utifrån den senaste veckans uppgång verkar detta vara en fungerande taktik.
- Oroligheter i mellanöstern kan fortsatt trycka priset uppåt.
- Prisskillnaden mellan brent och WTI är den lägsta på nästan 18 månader.
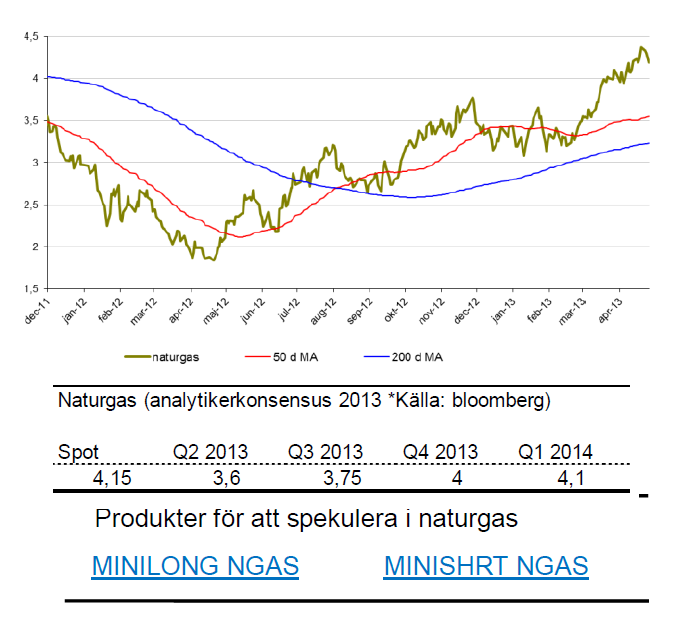
Naturgas
- Naturgas fortsätter att gå starkt. Under april är naturgas upp 6 % vilket gör att årets uppgång summeras till knappt 23 %.
- Naturgas har nu kämpat sig över den viktiga nivån kring $4 och den positiva trenden ser stark ut.
- Spekulanter ligger i övervikt i långa kontrakt och lagren ser låga ut vilket talar för en fortsatt uppgång.
Råvaror – Metaller
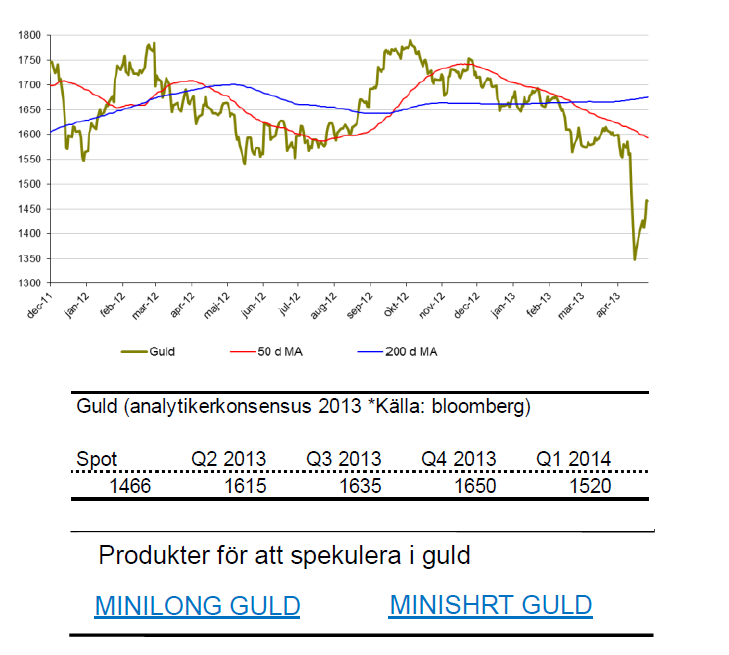
Guld
- Guld rasade kraftigt i april men har återhämtat hälften av fallet.
- Under april är guld ned 8 %. För året är guld ned 11 % vilket gör att chansen för ett trettonde positivt år ser svårt ut.
- Många spekulerar i vad som orsakade fallet. Inget tydligt svar verkar ges.
- Guld måste nog jobba sig upp mot $1550 innan en lång position är intressant. På nedsidan bevakas $1350-1400.
- Guld har under året påverkats av att riskaptiten ökar samtidigt som den amerikanska ekonomin ser starkare ut.
- Samtidigt fortsätter stimulanerna från FED och USD ser svag ut.
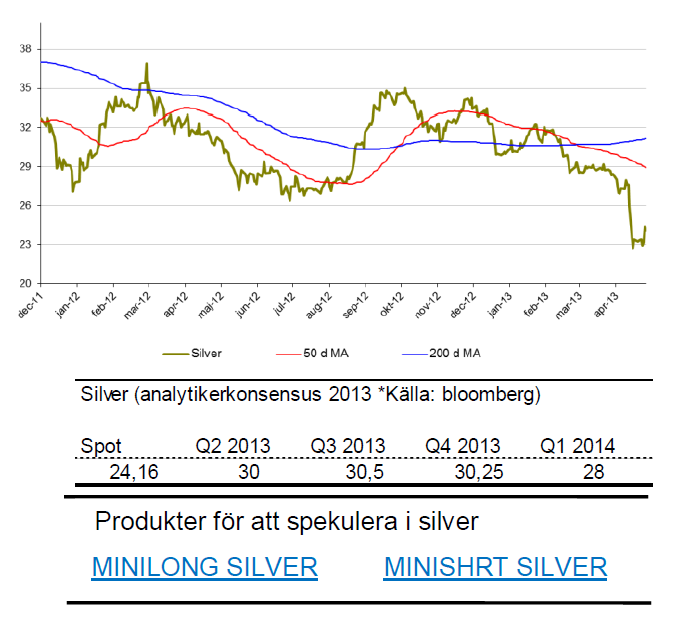
Silver
- Silver följer självklart med sin storbror guld. Återhämtningen har dock inte varit lika stark. Kanske finns en bra chans för att skala in sig för uppgång(?).
- Under april är silver ned 14 %. För året ned 19 %.
- Likt guld har silver straffats de fyra första månaderna av en större riskaptit och tecken på en starkare amerikansk ekonomi.
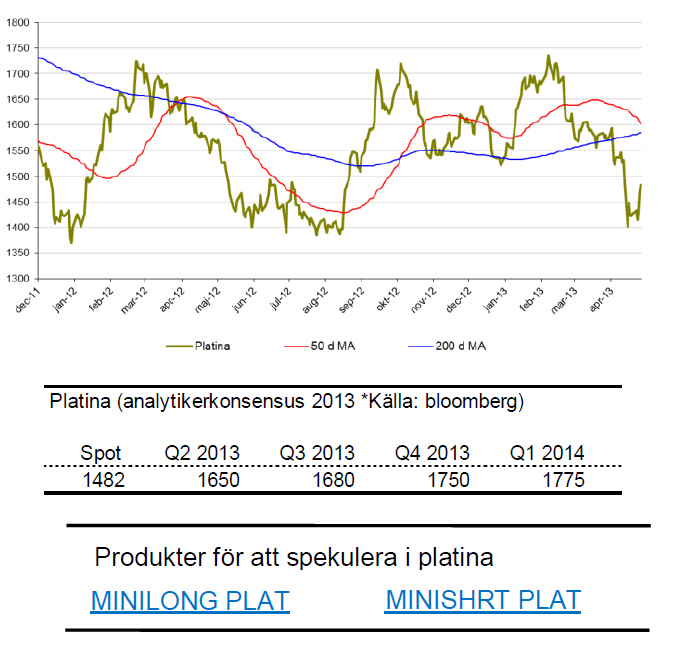
Platina
- Platina följer till stor del guld. Ned 5 % i april och 4,5 % för året.
- Platina, som är en mer använd ädelmetall handlas återigen till ett dyrare pris än guld.
- Motståndszon runt 1550$ är intressant att bevaka.
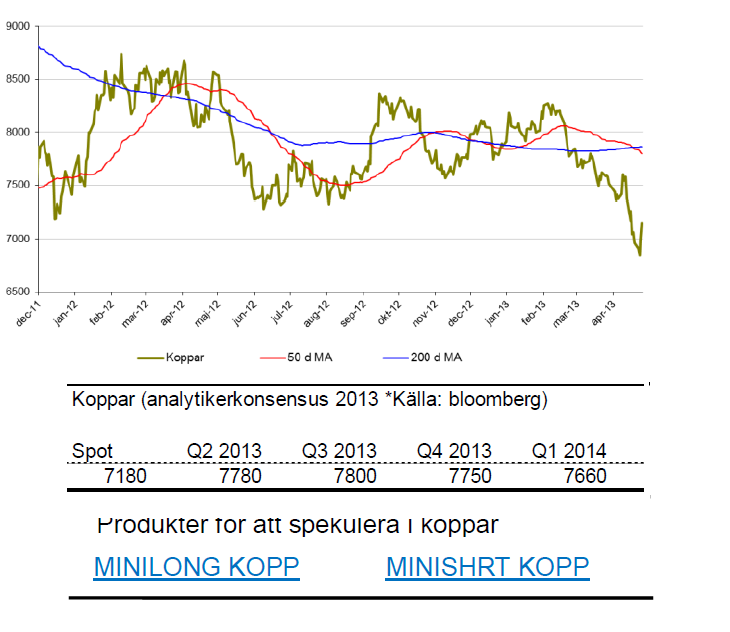
Koppar
- Trots en rekyl uppåt befinner sig koppar i en negativ trend. För året är koppar ned 11,5 % varav 6 % kom i april.
- Lagren av koppar är det största på nästan 10 år samtidigt som fler och fler spekulanter köper korta positioner.
- Positiv konsumtionsstatistik från Kina hjälper även föga eftersom lagren är så höga.
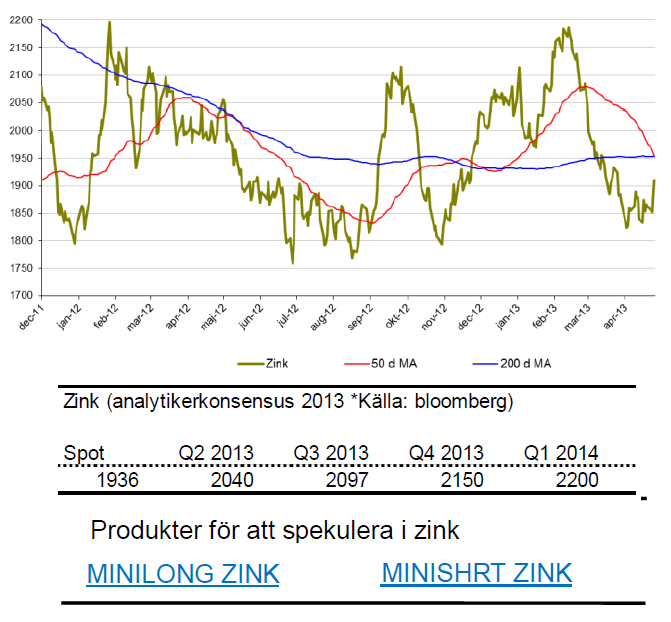
Zink
- Zinkpriset har kämpat på bra i april och är knappt förändrat i april. För året är dock zink ned knappa 10 %.
- Zink handlas snart i regionen kring en rad stöd (1820$). Rekyler där kan vara intressanta att bevaka.
- Ett s.k. dödskors, där 50 dagars medelvärde korsar 200 dagars medelvärde uppifrån sker snart vilket kan tyda på en fortsatt nedgång.
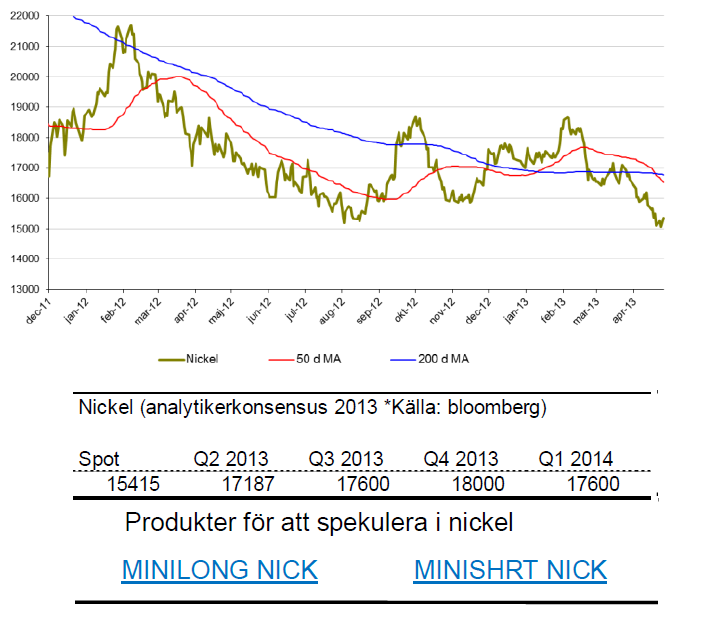
Nickel
- Nickel är för året ned drygt 10,5 %.
- Under april tappade nickel nästan 8 %.
- Nickel presterade sämst av alla basmetaller under 2012. Slutsiffran blev -8 % för 2012.
- Nickelmarknaden är fortsatt mättad med ökande lager.
- Många stora projekt inom nickelproduktion är redan finansierade och irreversibla vilket kommer att öka tillgången av nickel ytterligare.
Råvaror – Jordbruk
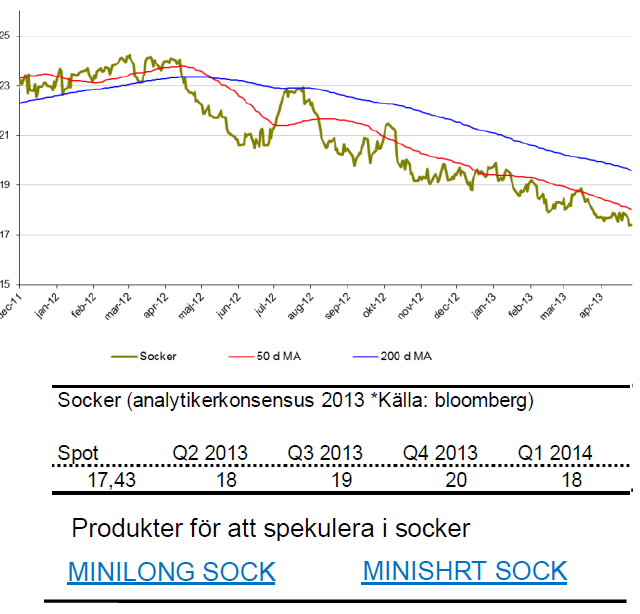
Socker
- Sockers kräftgång fortsätter. Sedan oktober förra året är sockerpriset ned 20 %.
- För året är sockerpriset ned drygt 10 % varav 2 % av nedgången kom i april.
- En anledning till det fortsatta prisfallet är att nuvarande nivåer inte motiverar sockerproduktion. Andra grödor eller etanol ses som mer attraktiva.
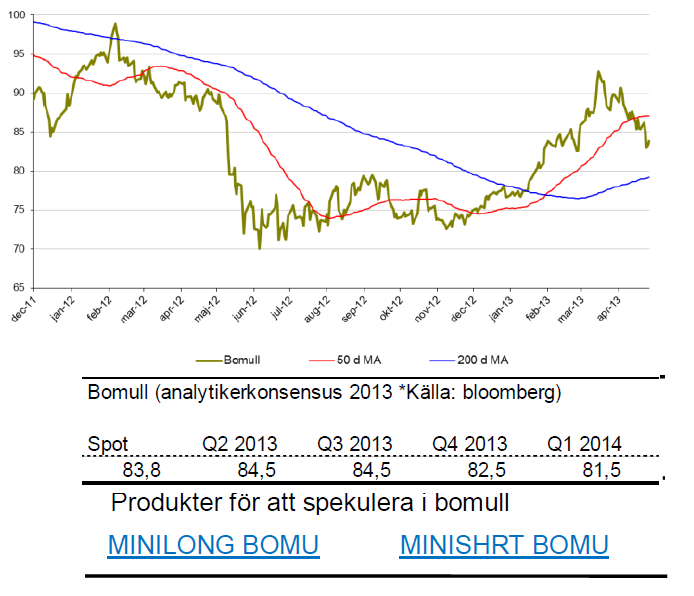
Bomull
- Efter en stark start på året backade bomull knappt 5 % under april.
- För året är priset på bomull upp 12 %.
- Sedan november 2012 är priset på bomull upp 21 %.
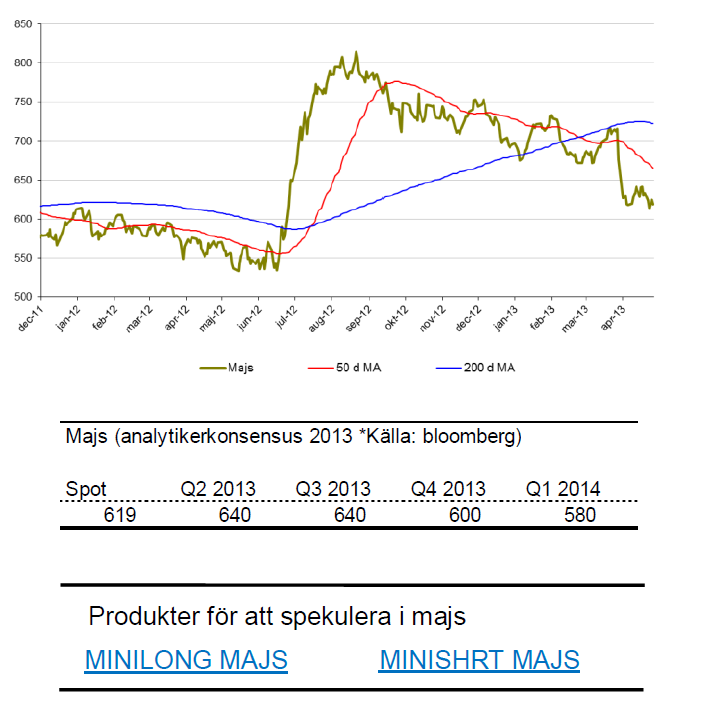
Majs
- I april föll priset på majs med 6 %.
- Sedan förra årets extremtorka har majs legat i en negativ trend.
- Det kalla och torra vädret har gjort att majssådden kommit igång senare än väntat.
- Stora skördar väntas dock och vädret ser ut att bli bättre.
- Följ således majs med försiktighet.
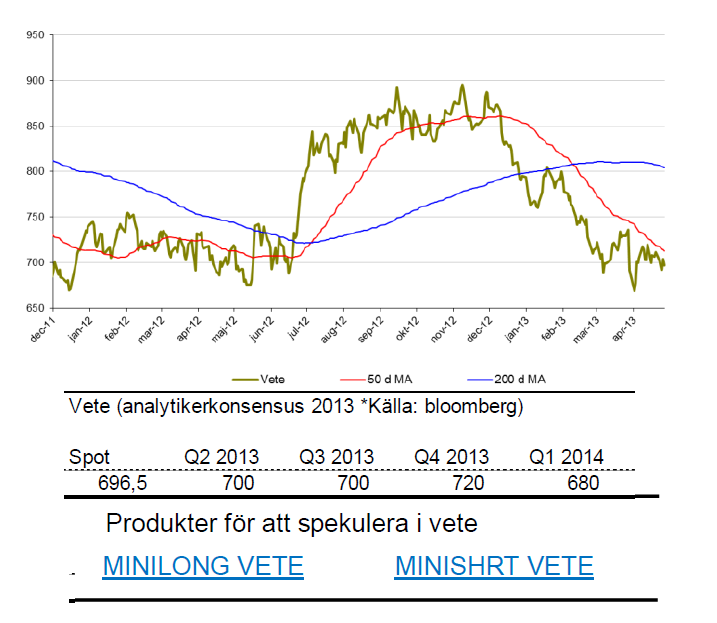
Vete
- Vete är i princip oförändrat i april
- Försiktighet gäller även här.
- För året är vete ned 5 %.
- Det kalla och torra vädret har gjort att vetesådden kommit igång senare än väntat.
- Stora skördar väntas dock och vädret ser ut att bli bättre.
Apelsinjuice
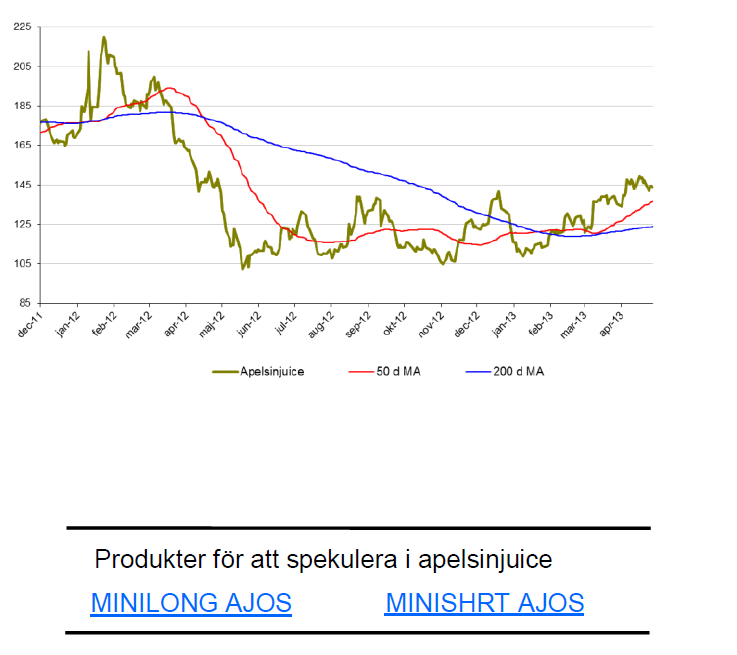
- Vi har länge bevakat apelsinjuice i Tradingklubben.
- Den viktiga nivån kring 143$ testades och bröts men nu handlas apelsinjuice återigen under denna nivå.
- För året är apelsinjuice upp 9,1 %.
- Priset på apelsinjuice är fortfarande 80 % högre än botten 2009. Fallhöjden är således hög. Mycket hög.
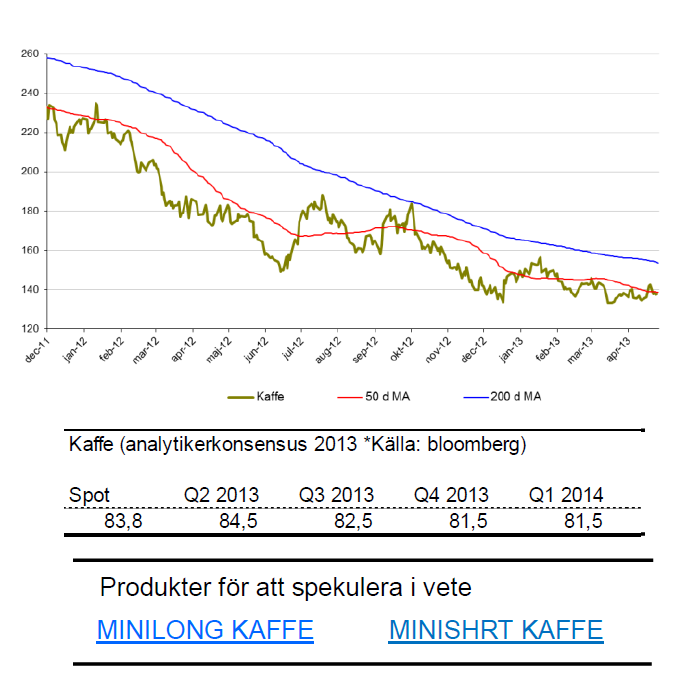
Kaffe
- Kaffe ligger fortfarande i en långsiktigt nedåtgående trend.
- För året är kaffe ned 9 % varav 2 % av nedgången kommit i april.
- Det är ökade lager som driver priset nedåt.
- Viktigt stödområde kring 135-138$.
[box]Denna uppdatering är producerat av SIP Nordic och publiceras i samarbete och med tillstånd på Råvarumarknaden.se[/box]
Ansvarsbegränsning
Detta produktblad utgör endast marknadsföring och har sammanställts av SIP Nordic Fondkommission AB.
Innehållet ger inte fullständig information avseende det finansiella instrumentet. Investerare uppmanas att del av prospekt och slutliga villkor, vilka finns tillgängliga på: www.rbsbank.se/markets, innan ett investeringsbeslut tas.
Förekommande exempel är simulerade och baseras på SIP Nordics egna beräkningar och antaganden, en person som använder andra data eller antaganden kan nå andra resultat. Administrativa avgifter och transaktionsavgifter påverkar den faktiska avkastningen.


The latest weekly report from the US DOE showed a substantial drawdown across key petroleum categories, adding more upside potential to the fundamental picture.

Commercial crude inventories (excl. SPR) fell by 5.8 million barrels, bringing total inventories down to 415.1 million barrels. Now sitting 11% below the five-year seasonal norm and placed in the lowest 2015-2022 range (see picture below).
Product inventories also tightened further last week. Gasoline inventories declined by 2.1 million barrels, with reductions seen in both finished gasoline and blending components. Current gasoline levels are about 3% below the five-year average for this time of year.
Among products, the most notable move came in diesel, where inventories dropped by almost 4.1 million barrels, deepening the deficit to around 20% below seasonal norms – continuing to underscore the persistent supply tightness in diesel markets.
The only area of inventory growth was in propane/propylene, which posted a significant 5.1-million-barrel build and now stands 9% above the five-year average.
Total commercial petroleum inventories (crude plus refined products) declined by 4.2 million barrels on the week, reinforcing the overall tightening of US crude and products.


A classic case of “buy the rumor, sell the news” played out in oil markets, as Brent crude has dropped sharply – down nearly USD 10 per barrel since yesterday evening – following Iran’s retaliatory strike on a U.S. air base in Qatar. The immediate reaction was: “That was it?” The strike followed a carefully calibrated, non-escalatory playbook, avoiding direct threats to energy infrastructure or disruption of shipping through the Strait of Hormuz – thus calming worst-case fears.
After Monday morning’s sharp spike to USD 81.4 per barrel, triggered by the U.S. bombing of Iranian nuclear facilities, oil prices drifted sideways in anticipation of a potential Iranian response. That response came with advance warning and caused limited physical damage. Early this morning, both the U.S. President and Iranian state media announced a ceasefire, effectively placing a lid on the immediate conflict risk – at least for now.
As a result, Brent crude has now fallen by a total of USD 12 from Monday’s peak, currently trading around USD 69 per barrel.
Looking beyond geopolitics, the market will now shift its focus to the upcoming OPEC+ meeting in early July. Saudi Arabia’s decision to increase output earlier this year – despite falling prices – has drawn renewed attention considering recent developments. Some suggest this was a response to U.S. pressure to offset potential Iranian supply losses.
However, consensus is that the move was driven more by internal OPEC+ dynamics. After years of curbing production to support prices, Riyadh had grown frustrated with quota-busting by several members (notably Kazakhstan). With Saudi Arabia cutting up to 2 million barrels per day – roughly 2% of global supply – returns were diminishing, and the risk of losing market share was rising. The production increase is widely seen as an effort to reassert leadership and restore discipline within the group.
That said, the FT recently stated that, the Saudis remain wary of past missteps. In 2018, Riyadh ramped up output at Trump’s request ahead of Iran sanctions, only to see prices collapse when the U.S. granted broad waivers – triggering oversupply. Officials have reportedly made it clear they don’t intend to repeat that mistake.
The recent visit by President Trump to Saudi Arabia, which included agreements on AI, defense, and nuclear cooperation, suggests a broader strategic alignment. This has fueled speculation about a quiet “pump-for-politics” deal behind recent production moves.
Looking ahead, oil prices have now retraced the entire rally sparked by the June 13 Israel–Iran escalation. This retreat provides more political and policy space for both the U.S. and Saudi Arabia. Specifically, it makes it easier for Riyadh to scale back its three recent production hikes of 411,000 barrels each, potentially returning to more moderate increases of 137,000 barrels for August and September.
In short: with no major loss of Iranian supply to the market, OPEC+ – led by Saudi Arabia – no longer needs to compensate for a disruption that hasn’t materialized, especially not to please the U.S. at the cost of its own market strategy. As the Saudis themselves have signaled, they are unlikely to repeat previous mistakes.
Conclusion: With Brent now in the high USD 60s, buying oil looks fundamentally justified. The geopolitical premium has deflated, but tensions between Israel and Iran remain unresolved – and the risk of missteps and renewed escalation still lingers. In fact, even this morning, reports have emerged of renewed missile fire despite the declared “truce.” The path forward may be calmer – but it is far from stable.
Analys
A muted price reaction. Market looks relaxed, but it is still on edge waiting for what Iran will do
Brent crossed the 80-line this morning but quickly fell back assigning limited probability for Iran choosing to close the Strait of Hormuz. Brent traded in a range of USD 70.56 – 79.04/b last week as the market fluctuated between ”Iran wants a deal” and ”US is about to attack Iran”. At the end of the week though, Donald Trump managed to convince markets (and probably also Iran) that he would make a decision within two weeks. I.e. no imminent attack. Previously when when he has talked about ”making a decision within two weeks” he has often ended up doing nothing in the end. The oil market relaxed as a result and the week ended at USD 77.01/b which is just USD 6/b above the year to date average of USD 71/b.

Brent jumped to USD 81.4/b this morning, the highest since mid-January, but then quickly fell back to a current price of USD 78.2/b which is only up 1.5% versus the close on Friday. As such the market is pricing a fairly low probability that Iran will actually close the Strait of Hormuz. Probably because it will hurt Iranian oil exports as well as the global oil market.
It was however all smoke and mirrors. Deception. The US attacked Iran on Saturday. The attack involved 125 warplanes, submarines and surface warships and 14 bunker buster bombs were dropped on Iranian nuclear sites including Fordow, Natanz and Isfahan. In response the Iranian Parliament voted in support of closing the Strait of Hormuz where some 17 mb of crude and products is transported to the global market every day plus significant volumes of LNG. This is however merely an advise to the Supreme leader Ayatollah Ali Khamenei and the Supreme National Security Council which sits with the final and actual decision.
No supply of oil is lost yet. It is about the risk of Iran closing the Strait of Hormuz or not. So far not a single drop of oil supply has been lost to the global market. The price at the moment is all about the assessed risk of loss of supply. Will Iran choose to choke of the Strait of Hormuz or not? That is the big question. It would be painful for US consumers, for Donald Trump’s voter base, for the global economy but also for Iran and its population which relies on oil exports and income from selling oil out of that Strait as well. As such it is not a no-brainer choice for Iran to close the Strait for oil exports. And looking at the il price this morning it is clear that the oil market doesn’t assign a very high probability of it happening. It is however probably well within the capability of Iran to close the Strait off with rockets, mines, air-drones and possibly sea-drones. Just look at how Ukraine has been able to control and damage the Russian Black Sea fleet.
What to do about the highly enriched uranium which has gone missing? While the US and Israel can celebrate their destruction of Iranian nuclear facilities they are also scratching their heads over what to do with the lost Iranian nuclear material. Iran had 408 kg of highly enriched uranium (IAEA). Almost weapons grade. Enough for some 10 nuclear warheads. It seems to have been transported out of Fordow before the attack this weekend.
The market is still on edge. USD 80-something/b seems sensible while we wait. The oil market reaction to this weekend’s events is very muted so far. The market is still on edge awaiting what Iran will do. Because Iran will do something. But what and when? An oil price of 80-something seems like a sensible level until something do happen.


Samtal om flera delar av råvarumarknaden
Tightening fundamentals – bullish inventories from DOE

Jonas Lindvall är tillbaka med ett nytt oljebolag, Perthro, som ska börsnoteras

Oljan, guldet och marknadens oroande tystnad

Domstolen ger klartecken till Lappland Guldprospektering

Stor uppsida i Lappland Guldprospekterings aktie enligt analys

Brookfield ska bygga ett AI-datacenter på hela 750 MW i Strängnäs

Sommaren inleds med sol och varierande elpriser

OPEC+ ökar oljeproduktionen trots fallande priser
Silverpriset släpar efter guldets utveckling, har mer uppsida
-
 Nyheter3 veckor sedan
Stor uppsida i Lappland Guldprospekterings aktie enligt analys
-
 Nyheter4 veckor sedan
Brookfield ska bygga ett AI-datacenter på hela 750 MW i Strängnäs
-
 Nyheter4 veckor sedan
Sommaren inleds med sol och varierande elpriser
-
 Nyheter3 veckor sedan
Silverpriset släpar efter guldets utveckling, har mer uppsida
-
 Nyheter4 veckor sedan
OPEC+ ökar oljeproduktionen trots fallande priser
-
Analys4 veckor sedan
Brent needs to fall to USD 58/b to make cheating unprofitable for Kazakhstan
-

 Nyheter4 veckor sedan
Tradingfirman XTX Markets bygger datacenter i finska Kajana för 1 miljard euro
-

 Nyheter2 veckor sedan
Uppgången i oljepriset planade ut under helgen