

Analys
SIP Nordic – Råvaruguiden – april 2013

 Kopparstyrd tågtidtabell
Jag tillhör skaran av de hundratusentals människor som varje dag sätter sig på ett tåg för att ta mig in till jobbet. Den senaste tiden har dessa irriterande tågförseningarna blivit fler och fler. Det är dock inte ”oväntat” snöoväder som varit orsaken de flesta gångerna utan kopparstölder.
Koppar är en mycket använd industrimetall som används lite varstans i vårt samhälle, däribland ledningar som används i tågtrafiken. Om en kopparledning rivs av kan det leda till timslånga förseningar och i många fall inställda tåg.
Högre kopparpris tenderar att attrahera personer vars respekt för lag och ordning inte är jättehögt. Med ett högre kopparpris kommer ökade stölder och fler tågförseningar.
Studier visar att det faktiskt finns ett samband mellan världspriset på koppar och kopparstölder. Under sensommaren 2011 då kopparpriset föll nästan 20 % minskade även antal kopparstölder dramatiskt, med upp till 40 % färre stölder under denna period. Sedan dess står kopparpriset högre och jag står allt oftare på perrongen och lyssnar på meddelanden om inställda tåg. Ett ytterst irriterande samband.
Jag ser dock lite ljusare på min framtida pendlartid. Lagren av koppar är de största på nästan tio år och spekulanter radar nu upp sig för att köpa kontrakt för nedgång. Någon som kan tala för en nedgång i kopparpriset.
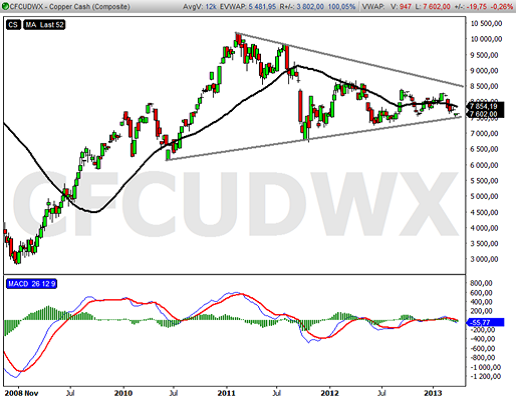
Jag frågade Tobbe Rosén om hans tekniska syn på koppar och han skrev
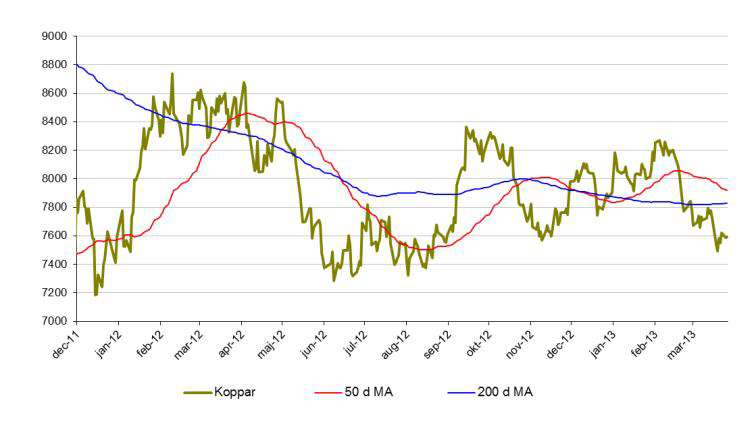
”Priset på koppar har fallit sedan toppen i början av 2011 och befinner sig i ett lågvollaläge som går mot sitt slut. Det mest troliga är att utbrottet sker på ovansidan men det avtagande momentumet indikerar en viss svaghet. Oavsett om utbrottet sker uppåt eller nedåt är det väl värt att följa.”
Fundamental analys talar alltså för att kopparpriset ska ned. Den tekniska analysen visar också på en viss svaghet.
För att jag ska slippa att bli stående på perrongen i framtiden så hoppas jag verkligen att analysen är rätt.
Alexander Frick
Råvaror – Energi
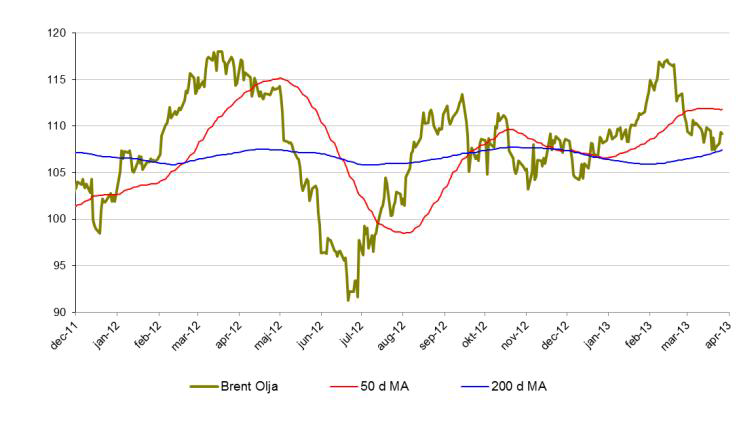
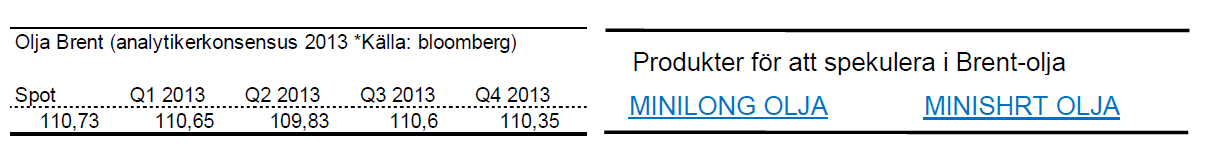
Brent olja
- Det har blivit dags att summera det första kvartalet för råvarorna och brent har åkt berg och dalbana.
- För året är brentoljan ned drygt 1 %.
- Sedan toppen i början av februari har brent tappat 8 %.
- Minskad import från USA samt ökade lager bidrar till brentoljans nedgång.
- Uttalande från Ben Bernanke (FED) om en paus i stimulanspaket påverkar även priset på olja negativt.
- Bland spekulanter (bland annat fonder) ökas de långa positionerna vilket kan indikera att en vändning uppåt är på väg.
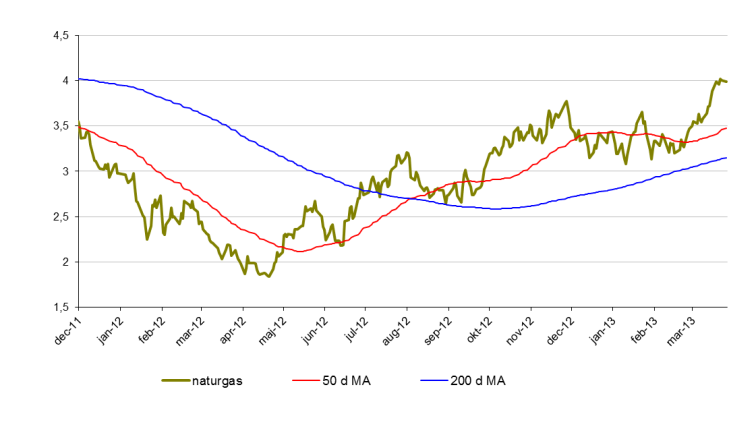
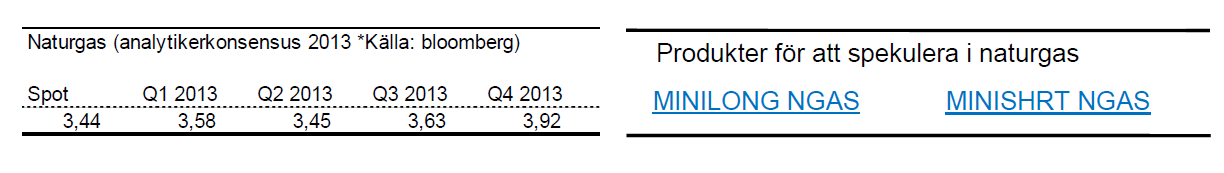
Naturgas
- Naturgas har startat året starkt. Upp nästan 17 % för året.
- I princip hela uppgången har skett under mars månad.
- Kallt väder i USA bidrar uppgången.
- Naturgas testar nu en viktig nivå kring 4$. Om Kursen etablerar sig över denna nivå kan vi mycket väl se högre kurser framöver.
Råvaror – Metaller
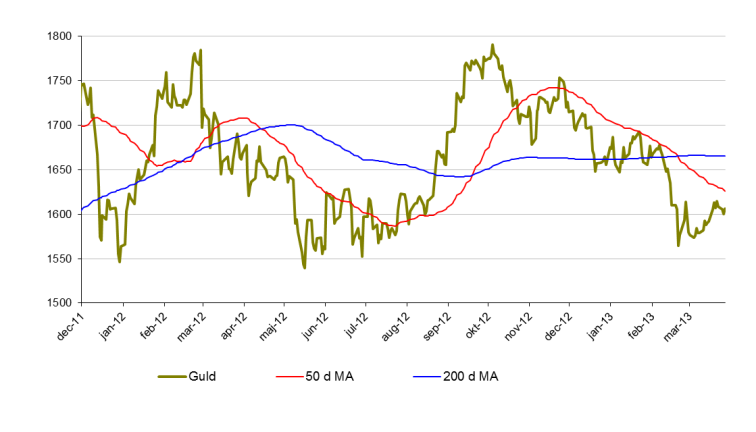
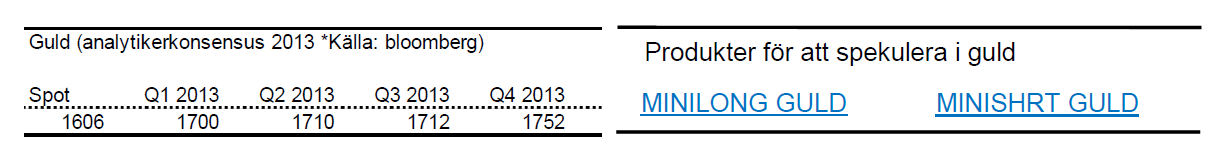
Guld
- Guld befinner sig i ett otroligt spännande läge. Sedan årets början är guld ned nära 3 %.
- Många väntade sig en större reaktion på krisen i Cypern.
- Under mars månad är guld dock endast upp 1,5 %.
- Riskaptiten är fortsatt hög varför guldet mycket väl kan fortsätta att falla.
- Vi såg även sett s.k. dödskors i guld i februari vilket betyder att 50 dagars medelvärde skär 200 dagars uppifrån. Detta brukar kunna tolkas som en signal om nedgång.
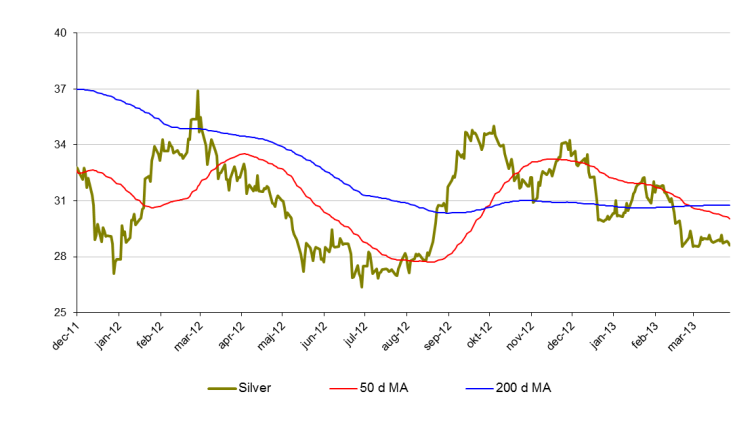
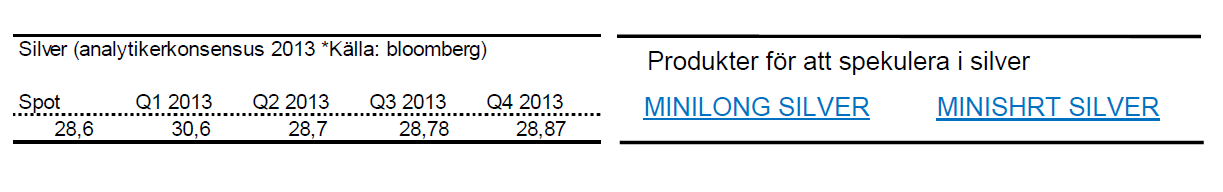
Silver
- Silver har den senaste månaden stabiliserats kring 28,5$ med mycket små rörelser.
- För året är silver ned 6,5 %.
- Likt guld tar silver stryk av att riskaptiten ökat och behovet av en ”säker hamn” är svalt.
- Tecken på framförallt en starkare amerikansk ekonomi driver priset på silver nedåt.
- Motståndsområde kring 29,5$ måste tas ut för att silver ska bli intressant för uppgång.
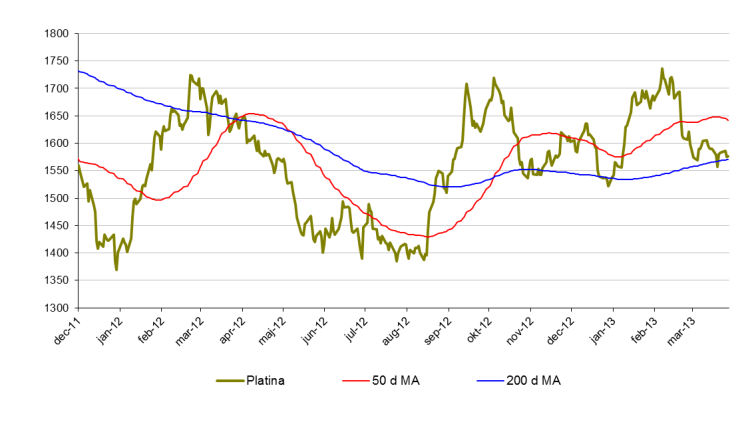
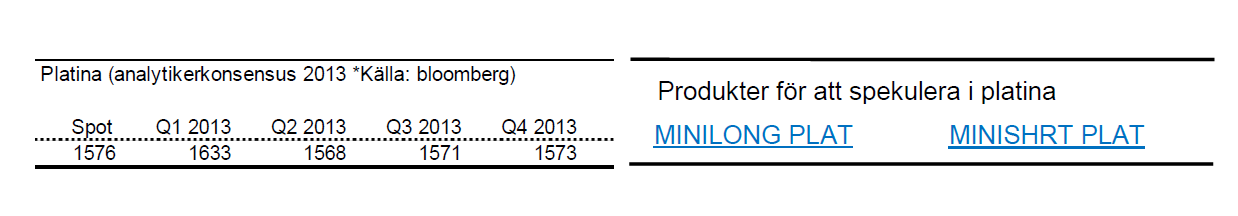
Platina
- Platina är fortsatt på plus för året. 3,5 % sedan sista december.
- Man bör dock komma ihåg att platina tappat nästan 10 % sedan i början av februari.
- Platina handlas återigen under guldet och en pairtrade likt den jag beskrev i februari kan åter vara intressant.
- Stödzon runt 1550$ är intressant att bevaka.
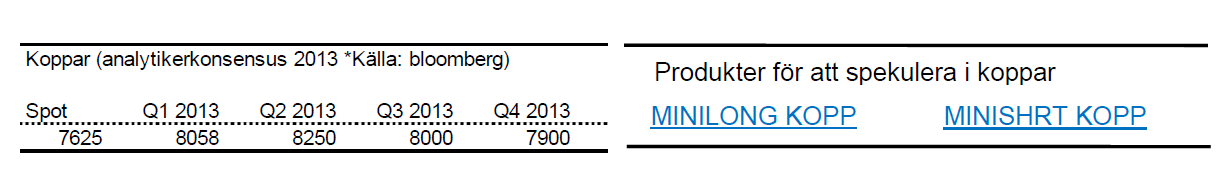
Koppar
- För året är koppar ned 4 % och det finns mycket som talar för att tappet ska fortsätta.
- Lagren av koppar är det största på nästan 10 år samtidigt som fler och fler spekulanter köper korta positioner.
- Debaclet i Cypern sätter även sina spår i kopparpriset.
- Positiv konsumtionsstatistik från Kina hjälper även föga eftersom lagren är så höga.
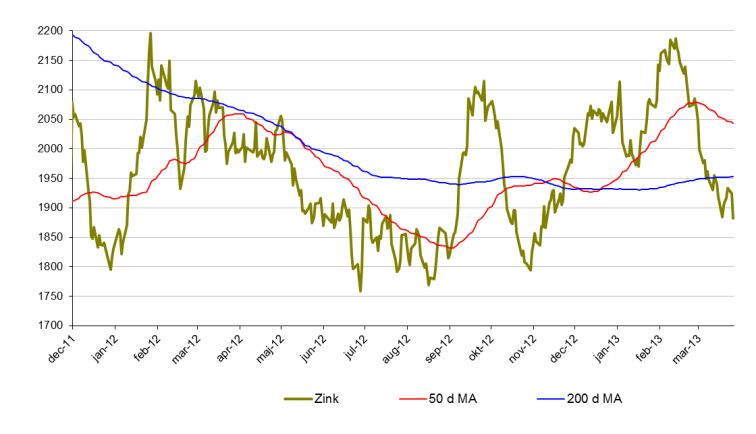
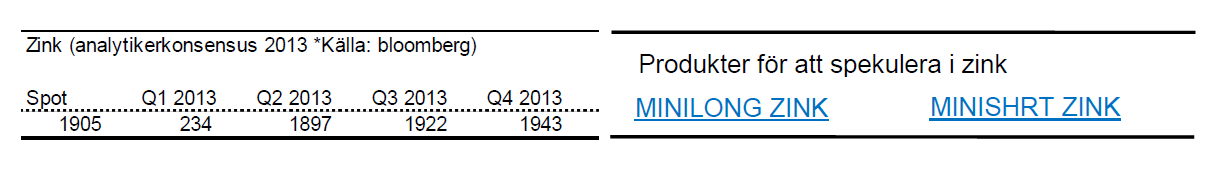
Zink
- Priset på zink dyker. För året är zinkpriset ned knappa 10 %.
- Likt koppar har Cypernkrisen satt sina spår.
- Zink handlas snart i regionen kring en rad stöd (1800$). Rekyler där kan vara intressanta att bevaka.
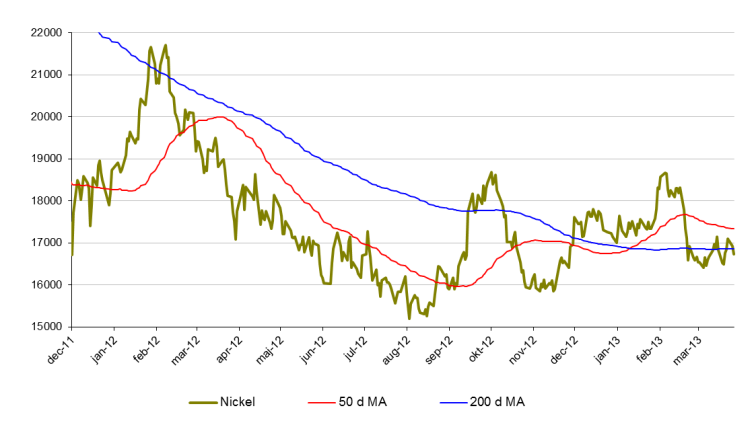
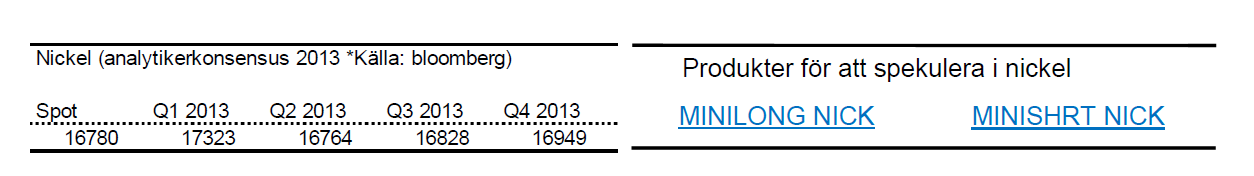
Nickel
- Nickel är för året ned drygt 2,5 %.
- Under februari tappade nickel nästan 11 %.
- Nickel presterade sämst av alla basmetaller under 2012. Slutsiffran blev -8 % för 2012.
- Nickelmarknaden är fortsatt mättad med ökande lager.
- Många stora projekt inom nickelproduktion är redan finansierade och irreversibla vilket kommer att öka tillgången av nickel ytterligare.
Råvaror – Jordbruk
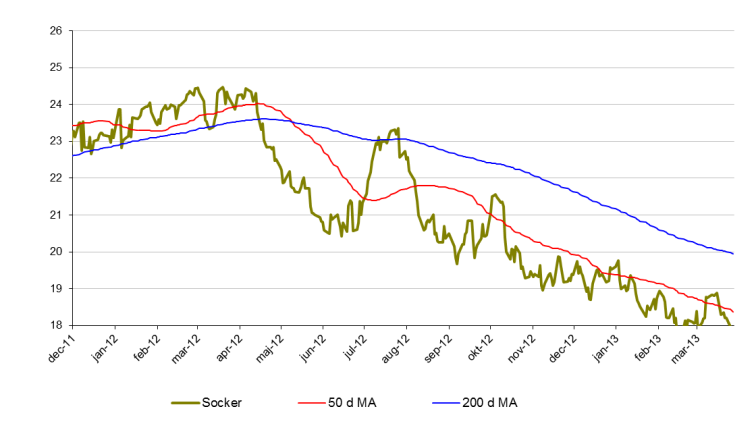
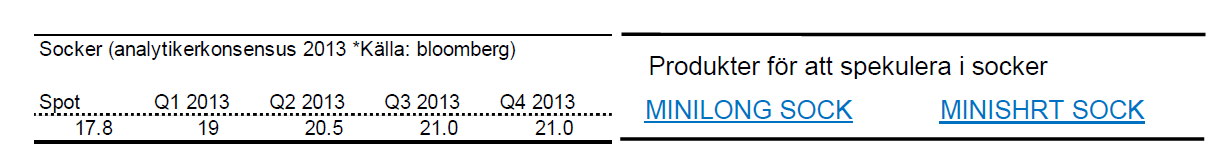
Socker
- Sockers kräftgång fortsätter. Sedan oktober förra året är sockerpriset ned 18 %.
- För året är sockerpriset ned drygt 8 %.
- En anledning till det fortsatta prisfallet är att nuvarande nivåer inte motiverar sockerproduktion. Andra grödor eller etanol ses som mer attraktiva.
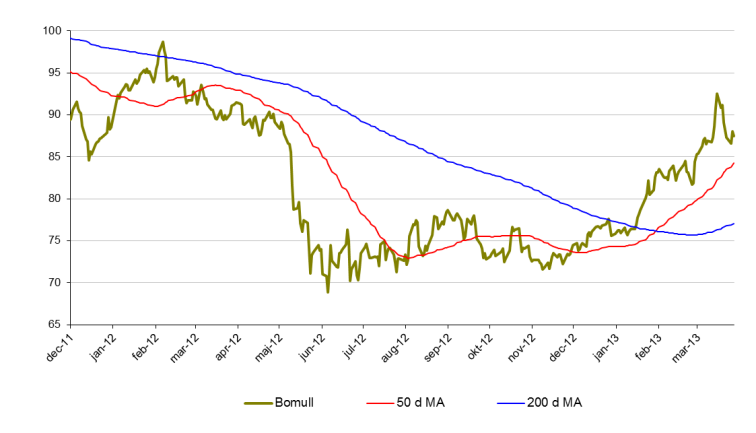
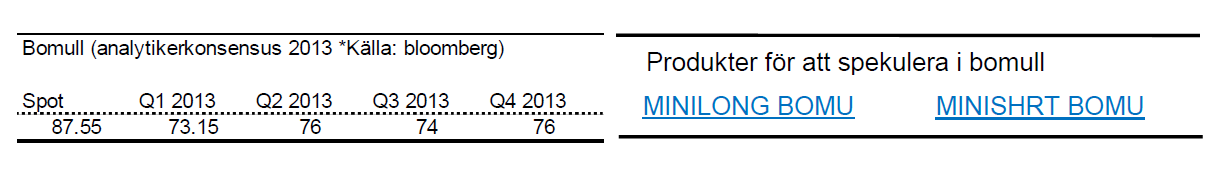
Bomull
- Bomullspriset utvecklas starkt under början av 2013.
- För året är priset på bomull upp 17,3 %.
- Under mars månad är bomull upp 5,2 %.
- Sedan november 2012 är priset på bomull upp 26 %.
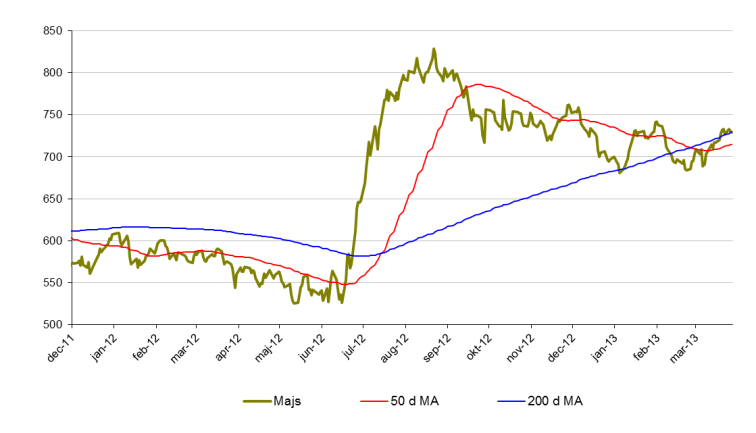
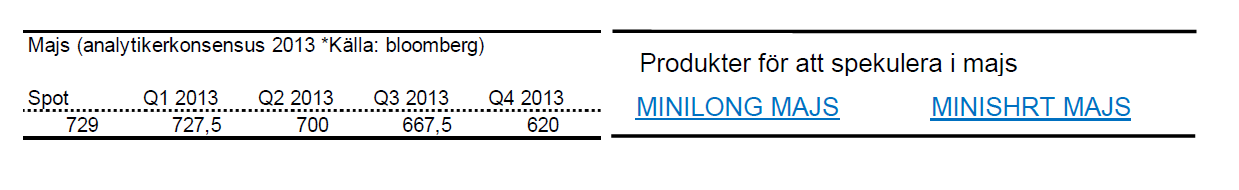
Majs
- Priset på majs har återigen vänt uppåt.
- För året är priset på majs upp nästan 6 %.
- Sedan förra årets extremtorka har majs legat i en negativ trend. Denna trend är nu bruten till följd av en period av torrare väder.
- Stora skördar väntas dock och vädret ser ut att bli bättre.
- Följ således majs med försiktighet.
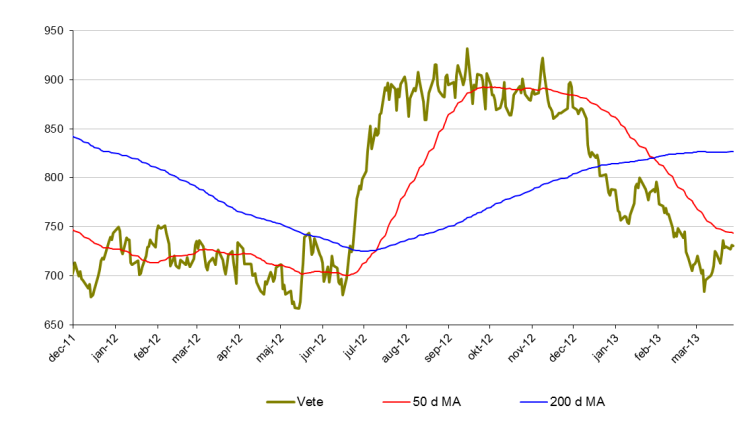
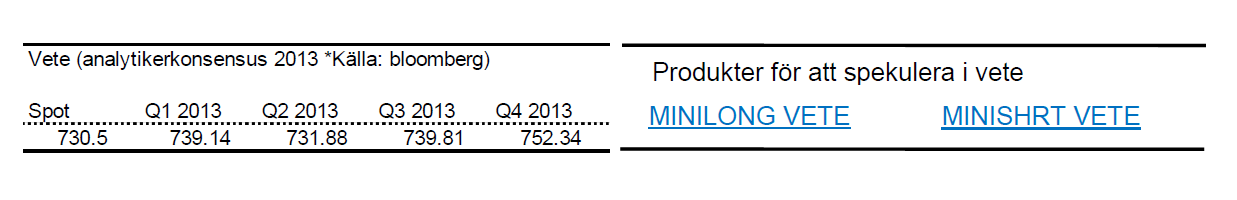
Vete
- Likt majs rekylerade vete upp över den negative trendlinje som funnits sedan förra sommaren.
- Försiktighet gäller även här.
- För året är vete ned 5 %.
- Under mars månad steg priset på vete med 3,5 %.
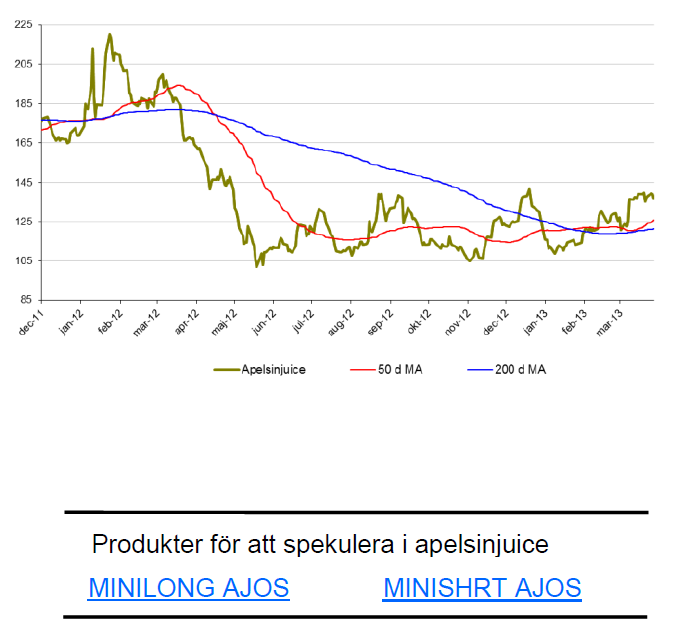
Apelsinjuice
- Vi har länge bevakat apelsinjuice i Tradingklubben.
- Apelsinjuice känns svårtippad och 143-nivån bör brytas innan vi intresserar oss för uppgång.
- För året är apelsinjuice upp 7 %.
- Priset på apelsinjuice är fortfarande 70-80 % högre än botten 2009. Fallhöjden är således hög. Mycket hög.
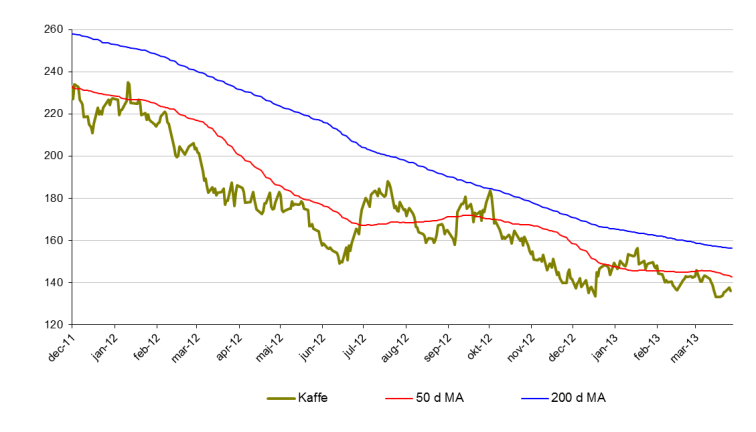
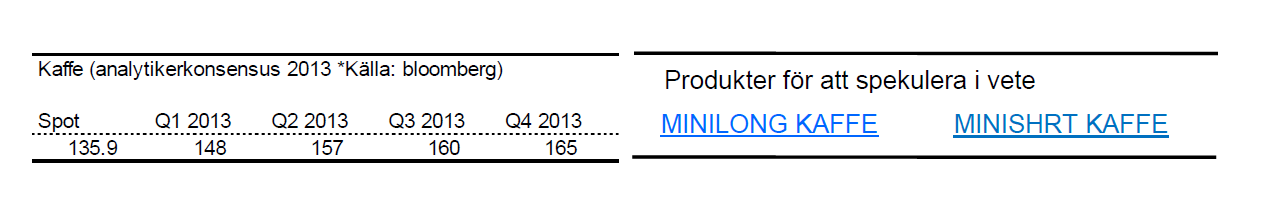
Kaffe
- Kaffe ligger fortfarande i en långsiktigt nedåtgående trend.
- För året är kaffe ned 7 %.
- Det är ökade lager som driver priset nedåt.
- Viktigt stödområde kring 135$.
[box]Denna uppdatering är producerat av SIP Nordic och publiceras i samarbete och med tillstånd på Råvarumarknaden.se[/box]
Ansvarsbegränsning
Detta produktblad utgör endast marknadsföring och har sammanställts av SIP Nordic Fondkommission AB.
Innehållet ger inte fullständig information avseende det finansiella instrumentet. Investerare uppmanas att del av prospekt och slutliga villkor, vilka finns tillgängliga på: www.rbsbank.se/markets, innan ett investeringsbeslut tas.
Förekommande exempel är simulerade och baseras på SIP Nordics egna beräkningar och antaganden, en person som använder andra data eller antaganden kan nå andra resultat. Administrativa avgifter och transaktionsavgifter påverkar den faktiska avkastningen.

Brent is climbing higher. Front-month is at USD 106.3/bl this morning, close to a weekly high and a USD 9/bl jump from Mondays open. This is the move we flagged as a risk earlier in the week: the market shifting from ”a deal is around the corner” to ”this is going to take longer than we thought”.

Analyst Commodities, SEB
During April, rest-of-year Brent remained remarkably stable around USD 90/bl. A stability which rested on one single assumption: the SoH reopens around 1 May. That assumption is now slowly falling apart.
As we highlighted yesterday: every week of delay beyond 1 May adds (theoretically) ish USD 5/bl to the rest-of-year average, as global inventories draw 100 million barrels per week. i.e., a mid-May reopening implies rest-of-year Brent closer to USD 100/bl, and anything pushing into June or July takes us meaningfully higher.
What’s changed in the last 48 hours:
#1: The US military has formally warned that clearing suspected sea mines from SoH could take up to six months. That is a completely different timescale from what the financial market is pricing. Even a political deal tomorrow does not immediately reopen the strait.
#2: Trump has shifted his tone from urgency to ”strategic patience”. In yesterday’s press conference: ”Don’t rush me… I want a great deal.” The market is reading this as a president no longer feeling pressured by timelines, with the naval blockade running in the background.
#3: So far, the military activity is escalating, not de-escalating. Axios reports Iran is laying more mines in SoH. The US 3rd carrier strike group (USS George H.W. Bush) is arriving with two countermine vessels. Trump yesterday ordered the US Navy to destroy any Iranian boats caught laying mines. While CNN reports that the Pentagon is actively drawing up plans to strike Iranian SoH capabilities and individual Iranian military leaders if the ceasefire collapses. i.e., NOT a attitude consistent with an imminent deal!
Spot crude and product prices eased off the early-April highs on a combination of system rerouting and deal optimism. Both now weakening. Goldman estimates April Gulf output is reduced by 14.5 mbl/d, or 57% of pre-war supply, a number that keeps getting worse the longer this drags on.
Demand-side adaptation is ongoing: S. Korea has cut its Middle East crude dependence from 69% to 56% by pulling more from the Americas and Africa, and Japan is kicking off a second round of SPR releases from 1 May. But SPRs are finite.
Ref. to the negotiations, we should not bet on speed. The current Iranian leadership is dominated by genuine hardliners willing to absorb economic pain and run the clock to extract concessions. That is not a setup for a rapid resolution. US/Israeli media briefings keep framing the delay as ”internal Iranian divisions”, the reality is more complicated and points toward weeks and months, not days.
Our point is that the complexity is large, and higher prices have only just started (given a scenario where the negotiations drag out in time). The market spent April leaning on the USD 90/bl rest-of-year assumption; that case is diminishing by the hour. If ”early May reopening” is replaced by ”June, July or later” over the next week or two, both crude and products have meaningful room to reprice higher from here. There is a high risk being short energy and betting on any immediate political resolution(!).
Down on Friday. Up on Monday. The Brent June crude oil contract traded down 5.1% last week to a close of $90.38/b. It reached a high of $103.87/b last Monday and a low of $86.09/b on Friday as Iran announced that the Strait of Hormuz was fully open for transit. That quickly changed over the weekend as the US upheld its blockade of Iranian oil exports while Iran naturally responded by closing the SoH again. The US blew a hole in the engine room of the Iranian ship TOUSKA and took custody of the ship on Sunday. Brent crude is up 5.6% this morning to $95.4/b.

The cease-fire is expiring tomorrow. The US has said it will send a delegation for a second round of negotiations in Islamabad in Pakistan. But Iran has for now rejected a second round of talks as it views US demands as unrealistic and excessive while the US is also blocking the Strait of Hormuz.
While Brent is up 5% this morning, the financial market is still very optimistic that progress will be made. That talks will continue and that the SoH will fully open by the start of May which is consistent with a rest-of-year average Brent crude oil price of around $90/b with the market now trading that balance at around $88/b.
Financial optimism vs. physical deterioration. We have a divergence where the financial market is trading negotiations, improvements and resolution while at the same time the physical market is deteriorating day by day. Physical oil flows remain constrained by disrupted flows, longer voyage times and elevated freight and insurance costs.
Financial markets are betting that a US/Iranian resolution will save us in time from violent shortages down the road. But every day that the SoH remains closed is bringing us closer to a potentially very painful point of shortages and much higher prices.
The US blockade is also a weapon of leverage against its European and Asian allies. When Iran closed the SoH it held the world economy as a hostage against the US. The US blockade of the SoH is of course blocking Iranian oil exports. But it is also an action of disruption directed towards Europe and Asia. The US has called for the rest of the world to engaged in the war with Iran: ”If you want oil from the Persian Gulf, then go and get it”. A risk is that the US plays brinkmanship with the global oil market directed towards its European and Asian allies and maybe even towards China to force them to engage and take part. Maybe unthinkable. But unthinkable has become the norm with Trump in the White House.
Wild moves yesterday. Brent crude traded to a high of $114.43/b and a low of $96.0/b and closed at $99.94/b yesterday.
US – Iran negotiations ongoing or not? What a day. Donald Trump announced that good talks were ongoing between Iran and the US and that the 48 hour deadline before bombing Iranian power plants and energy infrastructure was postponed by five days subject to success of ongoing meetings. Iranian media meanwhile stated that no meetings were ongoing at all.
Today we are scratching our heads trying to figure out what yesterday was all about.
Friends and family playing the market? Was it just Trump and his friends and family who were playing with oil and equity markets with $580m and $1.46bn in bets being placed by someone in oil and equity markets just 15 minutes before Trump’s announcement?
Was Trump pulling a TACO as he reached his political and economic pain point: Brent at $112/b, US Gas at $4/gal, SPX below 200dma and US 10yr above 4.4%?
Different Iranian factions with Trump talking with one of them? Are there real negotiations going on but with the US talking to one faction in Iran while another, the hardliners, are not involved and are denying any such negotiations going on?
Extending the ultimatum to attack and invade Kharg island next weekend? Or, is the five day delay of the deadline a tactical decision to allow US amphibious assault ships and marines to arrive in the Gulf in the upcoming weekend while US and Israeli continues to degrade Iranian military targets till then. And then next weekend a move by the US/Israel to attack and conquer for example the Kharg island?
We do not really know which it is or maybe a combination of these.
We did get some kind of TACO ydy. But markets have been waiting for some kind of TACO to happen and yesterday we got some kind of TACO. And Brent crude is now trading at $101.5/b as a result rather than at $112-114/b as it did no the high yesterday.
But what really matters in our view is the political situation on the ground in Iran. Will hardliners continue to hold power or will a more pragmatic faction gain power?
If the hardliners remain in power then oil pain should extend all the way to US midterm elections. The hardliners were apparently still in charge as of last week. Iran immediately retaliated and damaged LNG infrastructure in Qatar after Israel hit Iranian South Pars. The SoH was still closed and all messages coming out of Iran indicated defiance. Hardliners continues in power has a huge consequence for oil prices going forward. The regime has played its ’oil-weapon’ (closing or chocking the Strait of Hormuz). It is using it to achieve political goals. Deterrence: it needs to be so politically and economically expensive to attack Iran that it won’t happen again in the future. Or at least that the US/Israel thinks 10-times over before they attack again. The highest Brent crude oil closing price since the start of the war is $112.19/b last Friday. In comparison the 20-year inflation adjusted Brent price is $103/b. So Brent crude last Friday at $112.19/b isn’t a shockingly high price. And it is still far below the nominal high of $148/b from 2008 which is $220/b if inflation adjusted. So once in a lifetime Iran activates its most powerful weapon. The oil weapon. It needs to show the power of this weapon and it needs to reap political gains. Getting Brent to $112/b and intraday high of $119.5/b (9 March) isn’t a display of the power of that weapon. And it is not a deterrence against future attacks.
So if the hardliners remain in power in Iran, then the SoH will likely remain chocked all the way to US midterm elections and Brent crude will at a minimum go above the historical nominal high of $148/b from 2008.
Thus the outlook for the oil price for the rest of the year doesn’t depend all that much of whether Trump pulls a TACO or not. Stops bombing or not. It depends more on who is in charge in Iran. If it is the hardliners, then deterrence against future attacks via chocking of the SoH and high oil prices is the likely line of action. It is impacting the world but the Iranian ’oil-weapon’ is directed towards the US president and the the US midterm elections.
If a pragmatic faction gets to power in Iran, then a very prosperous future is possible. However, if power is shifting towards a more pragmatic faction in Iran then a completely different direction could evolve. Such a faction could possibly be open for cooperation with the US and the GCC and possibly put its issues versus Israel aside. Then the prosperity we have seen evolving in Dubai could be a possible future also for Iran.
So far it looks like the hardliners are fully in charge. As far as we can see, the hardliners are still fully in control in Iran. That points towards continued chocking of the SoH and oil prices ticking higher as global inventories (the oil market buffers) are drawn lower. And not just for a few more weeks, but possibly all the way to the US midterm elections.


Solkraften pressar elpriserna dagtid

Michel Gubel ger sin syn på oljemarknaden

Svag vårflod dubblar elpriserna
Brent crude up USD 9/bl on the week… ”deal around the corner” narrative fades
Market Still Betting on Timely Resolution, But Each Day Raises Shortage Risk

Christian Kopfer om läget för oljan
Market Still Betting on Timely Resolution, But Each Day Raises Shortage Risk
Brent crude up USD 9/bl on the week… ”deal around the corner” narrative fades
Michel Gubel ger sin syn på oljemarknaden
Solkraften pressar elpriserna dagtid
-
 Nyheter4 veckor sedan
Christian Kopfer om läget för oljan
-
Analys3 veckor sedan
Market Still Betting on Timely Resolution, But Each Day Raises Shortage Risk
-
Analys3 veckor sedan
Brent crude up USD 9/bl on the week… ”deal around the corner” narrative fades
-
 Nyheter2 veckor sedan
Michel Gubel ger sin syn på oljemarknaden
-
 Nyheter2 veckor sedan
Solkraften pressar elpriserna dagtid
-
Nyheter2 veckor sedan
Svag vårflod dubblar elpriserna