

Analys
No gold safety net?
![]() On 30th November Switzerland will hold a “Save our Swiss gold” referendum. Should the petition turn out to be successful the Swiss National Bank would have to buy large quantities of gold and would be limited in its monetary policy. The market (and we as well) considers it unlikely that the petition will be successful. As a result the market reaction would be considerable if the referendum passes.
On 30th November Switzerland will hold a “Save our Swiss gold” referendum. Should the petition turn out to be successful the Swiss National Bank would have to buy large quantities of gold and would be limited in its monetary policy. The market (and we as well) considers it unlikely that the petition will be successful. As a result the market reaction would be considerable if the referendum passes.
What is it all about?
The initiators of the petition “Save our Swiss gold” are of the view that only “gold can be the foundation of a stable franc”. So as to cement these foundations they demand a change of the constitution in the following points:
- The Swiss National Bank is going to be banned from selling gold in the future.
- The gold reserves have to be held in Switzerland.
- In the future the SNB will have to hold a minimum of 20% of its assets in gold.
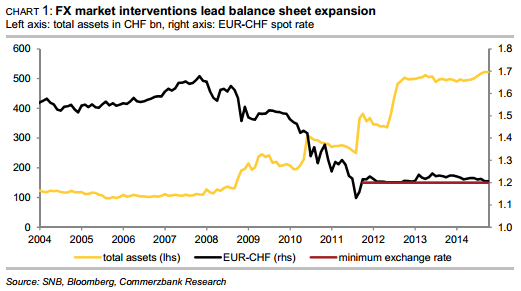
Within two years of the referendum being passed the Swiss National Bank (SNB) has to return its gold reserves to Switzerland and has five years to reach the minimum requirement of 20%. The organisers of the petition argue that this is the only way of ensuring the independence of the central bank and the long term stability of the Swiss franc. The reason they state is the strong rise of the SNB’s balance sheet. Since the beginning of the financial market crisis six years ago the balance sheet has risen more than fourfold to CHF 522 bn. (chart 1). An important factor in this context is the introduction of the franc’s minimum exchange rate against the euro on 6th September 2011. The latter ensures that the exchange rate cannot ease below 1.20 francs per euro. In order to defend the minimum exchange rate the SNB had been forced to buy considerable amounts of euros over the past years. Since the introduction of the minimum exchange rate the balance sheet has risen by 40%, with the majority of this rise taking place between September 2011 and September 2012. With the easing of the Euro crisis the appreciation pressure on the franc was reduced and therefore SNB’s interventions subsided notably. However, should the ECB begin buying government bonds on a large scale next year the appreciation pressure on the franc is likely to rise again. This would also increase the likelihood of renewed SNB interventions, which in turn would lead to a further expansion of the SNB balance sheet.
The petition demands damage the credibility of the SNB
The petition demand to hold all SNB gold reserves in Switzerland does not limit the SNB. The main advantage of geographically distributing the gold reserves, the possibility to sell the reserves quickly, would become redundant as a result of the ban on selling gold. And as the reserve can no longer be sold in the event of a crisis it no longer constitutes a reserve in the stricter sense and therefore it does not matter whether it is distributed around the globe or sunk in one of the Swiss lakes. If the gold reserves cannot be sold they are “lost” for the Swiss economy and for supporting the franc. However, what does the combination of the sales ban and the 20% minimum gold share in the reserves mean for the SNB’s monetary policy? These two demands limit the central bank’s monetary policy scope considerably and make it more difficult for the SNB to fulfil its mandate: price stability in the sense of a rise of consumer prices of less than 2% per annum.
- A balance sheet expansion to fight deflation would entail gold purchases at possibly higher prices so as to ensure that the minimum requirement of 20% is met. Gold is considered to constitute the ultimate safe haven and therefore gets more expensive if the desire for more security increases. As a result the threshold for an extension of the balance sheet that requires gold purchases might be increased.
- Under certain conditions the SNB’s ability to control inflation with the help of a balance sheet contraction might be limited, as the SNB would no longer be able to contract its balance sheet at will. It would only be possible to reduce assets by reducing non-gold holdings as it would not be allowed to sell gold. As a result the gold holdings determine the minimum size of the balance sheet. A balance sheet contraction over and above that is not possible.
The market would be aware of the SNB’s dilemma, so it would constitute the perfect invitation for the market to bet against the SNB. It would open the door to speculators. The difficulties can easily be illustrated by explaining the significance of the petition demands for the EUR-CHF minimum exchange rate of 1.20.
Under the gold initiative the minimum exchange rate in its current form would have been impossible
The SNB introduced the minimum exchange rate to prevent the additional deflationary pressures caused by the appreciation of the franc. The most important reason behind its success is the SNB’s credibility that it would sell unlimited amounts of francs should that be necessary. The SNB would lose this credibility under the conditions of the gold initiative. In this context two factors are important for speculators:
- (1) If there is a risk that EUR-CHF could ease below 1.20 the SNB is forced to extend its balance sheet with the help of franc sales so as to weaken the franc. The difficulties this would cause were discussed above. After the implementation of the 20% requirement the necessary gold purchases could cause the SNB to hesitate and cause the market to question the SNB’s determination.
- (2) A successive contraction of the balance sheet might be possible to a limited extend only, theoretically until the gold share reached 100%. If the extension of the balance sheet cannot be fully reversed inflation pressure increases after a while. Medium term the target of maintaining monetary stability might come under threat. In line with its mandate of price stability the SNB has to anticipate the long term effects of an expansion of the balance sheet. This might cause the SNB to hesitate before selling francs. As a result the SNB’s promise to do everything to defend the minimum exchange rate would become less credible.
However, short term a positive outcome of the referendum would have little effect on the EURCHF exchange rate. Following the vote the SNB would have five years to meet the minimum requirement of 20% gold holdings. So for the time being it would be able to sell unlimited amounts of francs to defend the 1.20 exchange rate – and it would no doubt do so. It would do so to send out the clear signal that it can and will act.
However, that will not be the case medium to long term. At present the SNB expects a rate of inflation of 0.3% yoy in 2015 – which would not yet allow an exit from the minimum exchange rate strategy. As the requirements of the gold initiative act as an invitation to the market to attack the minimum exchange rate, the SNB would probably be unable to defend the minimum exchange rate long term. Over the coming years the SNB would therefore find it increasingly difficult to maintain the minimum exchange rate in its current form.
As long as the SNB sticks to the minimum exchange rate it is clear though that it would not be able to achieve the requirement to hold 20% gold by contracting the balance sheet. So if the gold initiative was to be successful the SNB would therefore be required to buy substantial amounts of gold, in order to reach the required share of 20% of gold in its assets. This would clearly influence the gold price.
Gold initiative might constitute the turning point for the gold price
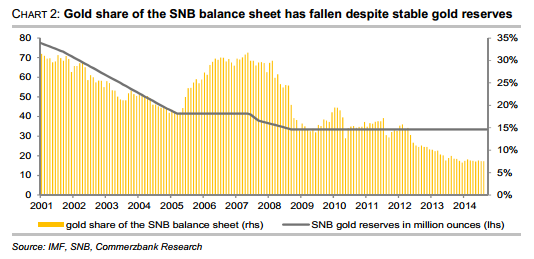
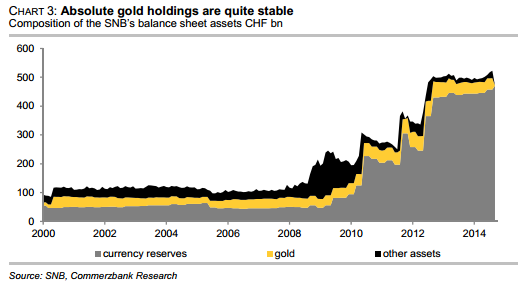
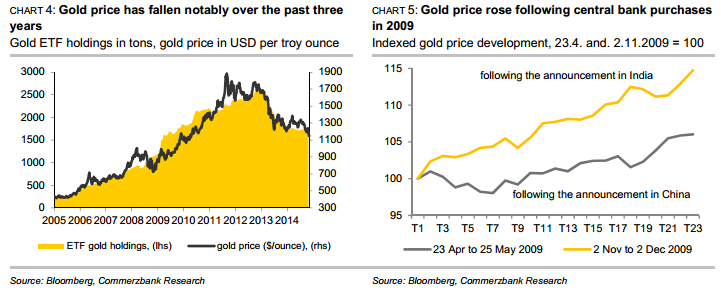
As a result of the SNB’s balance sheet expansion the share of the gold reserves in the total balance has fallen continuously over the past few years. Until mid-2008, i.e. before the start of the financial market crisis, it still accounted for more than 20% – the level that the gold initiative would like it to return to. At present the gold holdings account for less than 8% of the balance, sheet without the amount of gold being held having changed during this time (chart 2 and chart 3 below). Since 2008 the reserves have always amounted to 33.44 m ounces (1,040 tons). At current gold price levels this corresponds to CHF 39bn For the gold share to reach 20% again, as demanded by the gold initiative, it would have to rise to CHF 104.5 bn. as long as the total balance remains unchanged. Assuming an unchanged gold price the SNB would have to buy 56.3 m ounces (which corresponds to approx. 1,750 tons) of gold. That would exceed the holdings of all gold ETFs tracked by Bloomberg (chart 4) and would correspond to approx. 60% of the annual global mine production.
Due to the many parameters it is difficult to give the exact purchasing volume required. The SNB balance sheet is likely to increase further next year if the ECB starts its broad-based bond purchases. Under these circumstances the SNB would probably be forced to once again purchase euros so as to defend the minimum exchange rate. So if everything else remains unchanged even larger gold purchases would then be necessary. On the other hand it seems likely that should the referendum end in a win for the gold initiative the gold price would rise. A rise in the gold price on the other hand would lead to a value based increase of the gold reserves’ share of the balance sheet. So that would mean the SNB has to buy less gold. A fall in the gold price would increase the required gold purchases but this is unlikely in view of the market expectations of imminent massive SNB gold purchases.
At present the market considers it relatively unlikely that the initiative will be successful. Current polls put the opponents of the initiative into a clear lead now after first polls had still assumed a majority for the supporters of the initiative. The chances of the initiative’s success have been dampened quite considerably since the executive committee of the Swiss People’s Party (SVP) voted against the initiative with a tight majority. That means the initiative’s only supporter amongst the parties has been lost, as the other parties are opposing the initiative. The SNB itself is also opposing the initiative for the reasons explained above. As hardly anybody expects the initiative to be accepted the effects of a surprise acceptance on the gold price would be even more pronounced. An outcome of that nature would be in a position to form the turning point in the development of the gold price and constitute the end of the 3-year bear market.
How pronounced would the price reaction in case of a vote in favour of the gold initiative be? The reaction of the gold price following the announcement of gold purchases by the Chinese and Indian central banks in 2009 might provide an indication. When the Chinese central bank announced in late April 2009 that it had increased its gold holdings by 454 tons in the previous 6 years the gold price rose by 6% within one month (chart 5). When the Indian central bank purchased 200 tons of IMF gold, a transaction that became public in early November 2009, this caused a price rise of 15% within one month. The even larger amount of gold the SNB would have to buy suggests that the price would rise at least by a similar magnitude. On the other hand the clearly more negative market sentiment compared with 2009 points in the other direction. At the time the gold price had been in a 7-year uptrend whereas it has been in a downtrend for three years now (chart 4).

Rebounding along with most markets. But concerns over solidity of Gaza peace may also contribute. Brent crude fell 0.8% yesterday to $61.91/b and its lowest close since May this year. This morning it is bouncing up 0.9% to $62.5/b along with a softer USD amid positive sentiment with both equities and industrial metals moving higher. Concerns that the peace in Gaza may be less solid than what one might hope for also yields some support to Brent. Bets on tech stocks are rebounding, defying fears of trade war. Money moving back into markets. Gold continues upwards its strong trend and a softer dollar helps it higher today as well.

US crude & products probably rose 5.6 mb last week (API) versus a normal seasonal decline of 2.4 mb. The US API last night partial and thus indicative data for US oil inventories. Their data indicates that US crude stocks rose 7.4 mb last week, gasoline stocks rose 3.0 mb while Distillate stocks fell 4.8 mb. Altogether an increase in commercial crude and product stocks of 5.6 mb. Commercial US crude and product stocks normally decline by 2.4 mb this time of year. So seasonally adjusted the US inventories rose 8 mb last week according to the indicative numbers by the API. That is a lot. Also, the counter seasonal trend of rising stocks versus normally declining stocks this time of year looks on a solid pace of continuation. If the API is correct then total US crude and product stocks would stand 41 mb higher than one year ago and 6 mb higher than the 2015-19 average. And if we combine this with our knowledge of a sharp increase in production and exports by OPEC(+) and a large increase in oil at sea, then the current trend in US oil inventories looks set to continue. So higher stocks and lower crude oil prices until OPEC(+) switch to cuts. Actual US oil inventory data today at 18:00 CET.
US commercial crude and product stocks rising to 1293 mb in week 41 if last nights indicative numbers from API are correct.

Crude oil soon coming to a port near you. OPEC has lifted production sharply higher this autumn. At the same time demand for oil in the Middle-East has fallen as we have moved out of summer heat and crude oil burn for power for air-conditioning. The Middle-East oil producers have thus been able to lift exports higher on both accounts. Crude oil and condensates on water has shot up by 177 mb since mid-August. This oil is now on its way to ports around the world. And when they arrive, it will likely help to lift stocks onshore higher. That is probably when we will lose the last bit of front-end backwardation the the crude oil curves. That will help to drive the front-month Brent crude oil price down to the $60/b line and revisit the high $50ies/b. Then the eyes will be all back on OPEC+ when they meet in early November and then again in early December.
Crude oil and condensates at sea have moved straight up by 177 mb since mid-August as OPEC(+) has produced more, consumed less and exported more.

When it starts to move lower it moves rather quickly. Gaza, China, IEA. Brent crude is down 2.1% today to $62/b after having traded as high as $66.58/b last Thursday and above $70/b in late September. The sell-off follows the truce/peace in Gaze, a flareup in US-China trade and yet another bearish oil outlook from the IEA.
A lasting peace in Gaze could drive crude oil at sea to onshore stocks. A lasting peace in Gaza would probably calm down the Houthis and thus allow more normal shipments of crude oil to sail through the Suez Canal, the Red Sea and out through the Bab-el-Mandeb Strait. Crude oil at sea has risen from 48 mb in April to now 91 mb versus a pre-Covid normal of about 50-60 mb. The rise to 91 mb is probably the result of crude sailing around Africa to be shot to pieces by the Houthis. If sailings were to normalize through the Suez Canal, then it could free up some 40 mb in transit at sea moving onshore into stocks.
The US-China trade conflict is of course bearish for demand if it continues.
Bearish IEA yet again. Getting closer to 2026. Credibility rises. We expect OPEC to cut end of 2025. The bearish monthly report from the IEA is what it is, but the closer we get to 2026, the more likely the IEA is of being ball-park right in its outlook. In its monthly report today the IEA estimates that the need for crude oil from OPEC in 2026 will be 25.4 mb/d versus production by the group in September of 29.1 mb/d. The group thus needs to do some serious cutting at the end of 2025 if it wants to keep the market balanced and avoid inventories from skyrocketing. Given that IEA is correct that is. We do however expect OPEC to implement cuts to avoid a large increase in inventories in Q1-26. The group will probably revert to cuts either at its early December meeting when they discuss production for January or in early January when they discuss production for February. The oil price will likely head yet lower until the group reverts to cuts.
Dubai: The Mid-East anchor dragging crude oil lower. Surplus emerging in Mid-East pricing. Crude oil prices held surprisingly strong all through the summer. A sign and a key source of that strength came from the strength in the front-end backwardation of the Dubai crude oil curve. It held out strong from mid-June and all until late September with an average 1-3mth time-spread premium of $1.8/b from mid-June to end of September. The 1-3mth time-spreads for Brent and WTI however were in steady deterioration from late June while their flat prices probably were held up by the strength coming from the Persian Gulf. Then in late September the strength in the Dubai curve suddenly collapsed. Since the start of October it has been weaker than both the Brent and the WTI curves. The Dubai 1-3mth time-spread now only stands at $0.25/b. The Middle East is now exporting more as it is producing more and also consuming less following elevated summer crude burn for power (Aircon) etc.
The only bear-element missing is a sudden and solid rise in OECD stocks. The only thing that is missing for the bear-case everyone have been waiting for is a solid, visible rise in OECD stocks in general and US oil stocks specifically. So watch out for US API indications tomorrow and official US oil inventories on Thursday.
No sign of any kind of fire-sale of oil from Saudi Arabia yet. To what we can see, Saudi Arabia is not at all struggling to sell its oil. It only lowered its Official Selling Prices (OSPs) to Asia marginally for November. A surplus market + Saudi determination to sell its oil to the market would normally lead to a sharp lowering of Saudi OSPs to Asia. Not yet at least and not for November.
The 5yr contract close to fixed at $68/b. Of importance with respect to how far down oil can/will go. When the oil market moves into a surplus then the spot price starts to trade in a large discount to the 5yr contract. Typically $10-15/b below the 5yr contract on average in bear-years (2009, 2015, 2016, 2020). But the 5yr contract is usually pulled lower as well thus making this approach a moving target. But the 5yr contract price has now been rock solidly been pegged to $68/b since 2022. And in the 2022 bull-year (Brent spot average $99/b), the 5yr contract only went to $72/b on average. If we assume that the same goes for the downside and that 2026 is a bear-year then the 5yr goes to $64/b while the spot is trading at a $10-15/b discount to that. That would imply an average spot price next year of $49-54/b. But that is if OPEC doesn’t revert to cuts and instead keeps production flowing. We think OPEC(+) will trim/cut production as needed into 2026 to prevent a huge build-up in global oil stocks and a crash in prices. But for now we are still heading lower. Into the $50ies/b.
Some rebound but not much. Brent crude rebounded 1.5% yesterday to $65.47/b. This morning it is inching 0.2% up to $65.6/b. The lowest close last week was on Thursday at $64.11/b.
The curve structure is almost as week as it was before the weekend. The rebound we now have gotten post the message from OPEC+ over the weekend is to a large degree a rebound along the curve rather than much strengthening at the front-end of the curve. That part of the curve structure is almost as weak as it was last Thursday.
We are still on a weakening path. The message from OPEC+ over the weekend was we are still on a weakening path with rising supply from the group. It is just not as rapidly weakening as was feared ahead of the weekend when a quota hike of 500 kb/d/mth for November was discussed.
The Brent curve is on its way to full contango with Brent dipping into the $50ies/b. Thus the ongoing weakening we have had in the crude curve since the start of the year, and especially since early June, will continue until the Brent crude oil forward curve is in full contango along with visibly rising US and OECD oil inventories. The front-month Brent contract will then flip down towards the $60/b-line and below into the $50ies/b.
At what point will OPEC+ turn to cuts? The big question then becomes: When will OPEC+ turn around to make some cuts? At what (price) point will they choose to stabilize the market? Because for sure they will. Higher oil inventories, some more shedding of drilling rigs in US shale and Brent into the 50ies somewhere is probably where the group will step in.
There is nothing we have seen from the group so far which indicates that they will close their eyes, let the world drown in oil and the oil price crash to $40/b or below.
The message from OPEC+ is also about balance and stability. The world won’t drown in oil in 2026. The message from the group as far as we manage to interpret it is twofold: 1) Taking back market share which requires a lower price for non-OPEC+ to back off a bit, and 2) Oil market stability and balance. It is not just about 1. Thus fretting about how we are all going to drown in oil in 2026 is totally off the mark by just focusing on point 1.
When to buy cal 2026? Before Christmas when Brent hits $55/b and before OPEC+ holds its last meeting of the year which is likely to be in early December.
Brent crude oil prices have rebounded a bit along the forward curve. Not much strengthening in the structure of the curve. The front-end backwardation is not much stronger today than on its weakest level so far this year which was on Thursday last week.

The front-end backwardation fell to its weakest level so far this year on Thursday last week. A slight pickup yesterday and today, but still very close to the weakest year to date. More oil from OPEC+ in the coming months and softer demand and rising inventories. We are heading for yet softer levels.


Vad guldets uppgång egentligen betyder för världen

Spotpriset på guld över 4300 USD och silver över 54 USD
Crude oil soon coming to a port near you

Guld och silver stiger hela tiden mot nya höjder
The Mid-East anchor dragging crude oil lower

OPEC+ missar produktionsmål, stöder oljepriserna

Ett samtal om guld, olja, fjärrvärme och förnybar energi

Goldman Sachs höjer prognosen för guld, tror priset når 4900 USD
Guld nära 4000 USD och silver 50 USD, därför kan de fortsätta stiga

Blykalla och amerikanska Oklo inleder ett samarbete
-
 Nyheter3 veckor sedan
OPEC+ missar produktionsmål, stöder oljepriserna
-
 Nyheter4 veckor sedan
Ett samtal om guld, olja, fjärrvärme och förnybar energi
-
 Nyheter2 veckor sedan
Goldman Sachs höjer prognosen för guld, tror priset når 4900 USD
-
 Nyheter2 veckor sedan
Guld nära 4000 USD och silver 50 USD, därför kan de fortsätta stiga
-
 Nyheter3 veckor sedan
Blykalla och amerikanska Oklo inleder ett samarbete
-
Analys4 veckor sedan
Are Ukraine’s attacks on Russian energy infrastructure working?
-

 Nyheter4 veckor sedan
Guldpriset uppe på nya höjder, nu 3750 USD
-
Nyheter3 veckor sedan
Ett samtal om guld, olja, koppar och stål