Analys
SIP Nordic – Råvaruguiden – oktober 2012
 Volatilitet kan bli 100 gram guld
Råvaror kan på kort sikt svänga kraftigt. Det är inte ovanligt att silver och guld vid vissa tillfällen kan både öka och tappa 5 % på en dag. I oktober går Investerar SM av stapeln och utnyttjande av råvarors svängningar kan mycket väl vara ett framgångsrecept i tävlingen.
Under oktober arrangeras Investerar SM där förstapriset är 100 gram rent guld. Med dagens guldpris värderas det idag till drygt 37 000 kr.
Under tävlingen ska du investera 100 000 kr i fiktiva pengar. Bäst utveckling i slutet av oktober står som vinnare. Det är möjligt att handla allt från index och aktier till valutor och råvaror. Jag tror att sannolikheten att en råvara är bidragande till vinsten är ganska stor.
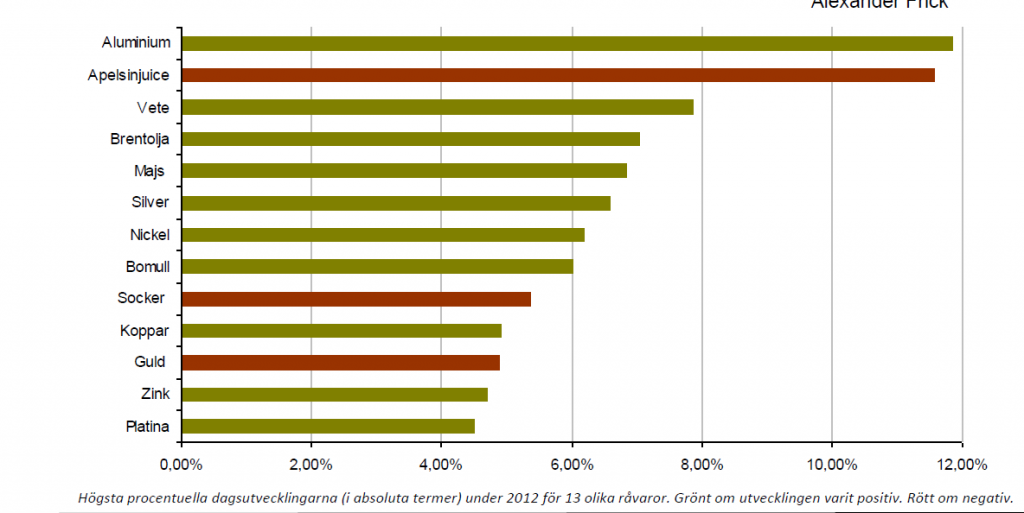
Råvaror kan svänga kraftigt på kort sikt. Här kan investerare med fingertoppkänsla skörda stora framgångar. Grafen nedan visar den största procentuella utvecklingen för 13 enskilda råvaror (grönt för positiv och rött för negativ dagsutveckling) under en dag 2012.
Av de 13 råvarorna tror jag att silver är mest intressant då den på senaste tiden pendlat mycket från dag till dag. En annan intressant tanke är att ta en lång position i guld med hävstång 20. Tänk er då att guld klättrar till $2100. Inte nog med att det innebär en utveckling på nästan +360% (i portföljen) vilket kan räcka till seger. Värdet på första-priset stiger även till drygt 44 000 kr. Win win.
Lycka till!
Råvaror – Energi
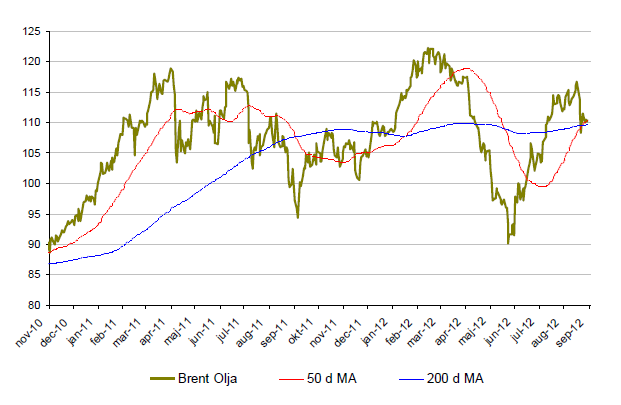
Brent olja
- Brentoljan har under 2012 åkt berg och dalbana. För året är brent upp dryga 3 %.
- Brent har haft en stark period sedan mitten av juni. Brent har sedan mitten av juni stigit med nästan 25 %. I september är dock brentoljan ned 3 %.
- Trots ekonomisk motvind handlas olja på relativt höga nivåer. Monetära stimulanser sätter dollarn under press vilket hjälper oljan att stanna på höga nivåer.
- Ökande lagerstatistik balanseras av politisk oro i mellanöstern.
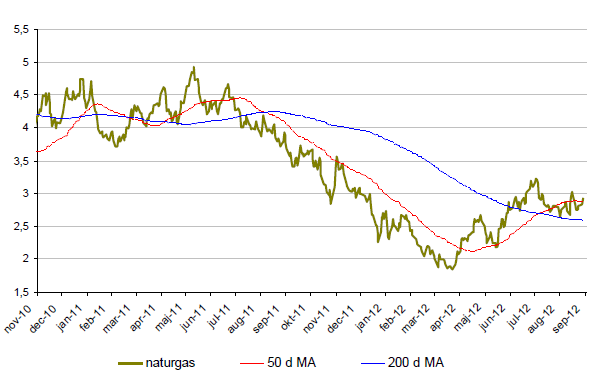
Naturgas
- Naturgas positiva trend fortsätter. Sedan i mitten av april är naturgas upp 73 %.
- För året är naturgas upp 8 %.
- Under september är naturgas upp knappa 20 %.
- De höga lagren av naturgas sjunker till följd av ökad efterfrågan på naturgas för uppvärmning i USA.
Råvaror – Metaller
Guld
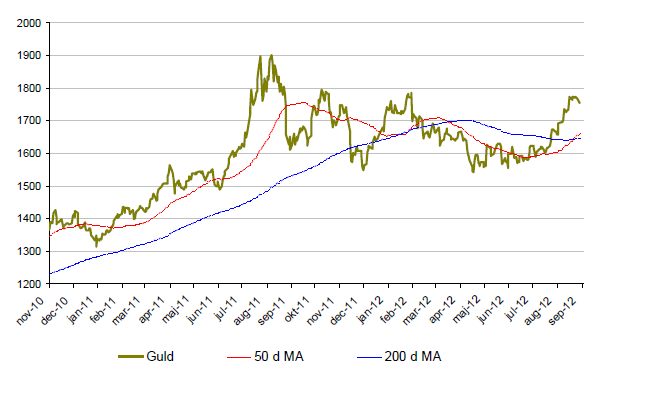
- Guld har under sensommaren och hösten rusat till följd av stimulanspaket från FED.
- För året är guld upp drygt 11 %.
- Under september är guld upp över 6 %.
- Guld går nu mot sitt 11:e raka år med positiv utveckling.
- Viktig nivå att hålla koll på är $1800. Lyckas guld klättra över denna nivå siktar vi istället på toppen från september 2011 på $1920.
- Efterfrågan från den officiella sektorn (riskbanker) och Kina fortsätter att vara hög.
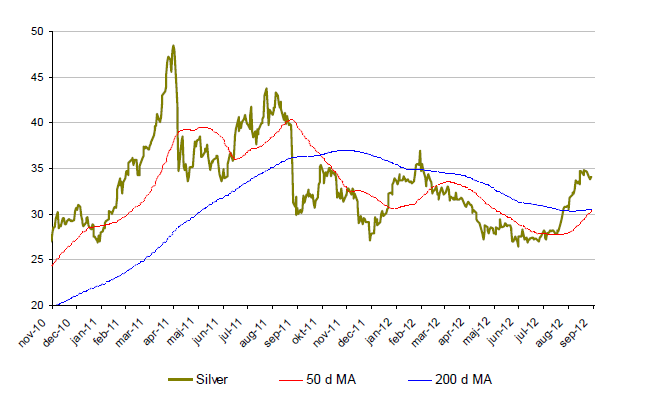
Silver
- Likt guld hjälps silver av FEDs stimulanspaket.
- För året är silver upp 25 %.
- Under september är silver upp ca 11 %.
- Trots en hög tillgång av silver (industrianvändning) ökar priset till följd av högre riskaptit och ökad spekulation.
- Det är fortfarande långt kvar till nivåerna på runt $50 under våren 2011.
- Viktig nivå att hålla koll på är $27 där vi hittar en stark motståndzon.
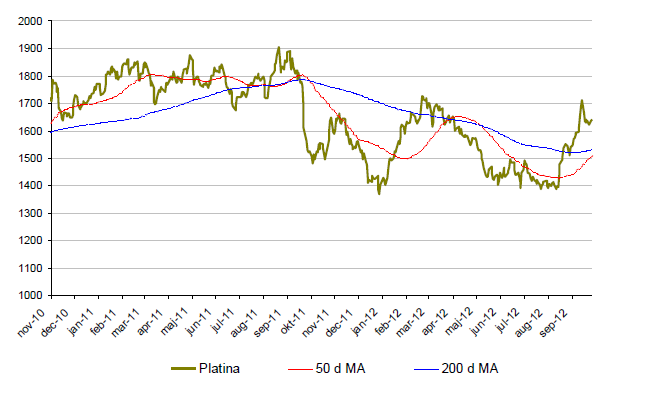
Platina
- Platinapriset gör inget undantag utan följer silver och guld i den positiva trenden.
- För året är Platina upp 17 %.
- Under september månad är platina upp drygt 11 %.
- Svåra leveransstörningar från gruvor i Sydafrika pressar upp platinapriset.
- Fortsatt positiv kursutveckling kan dock resultera i produktionsnedtrappningar vilket kan kyla av priset.
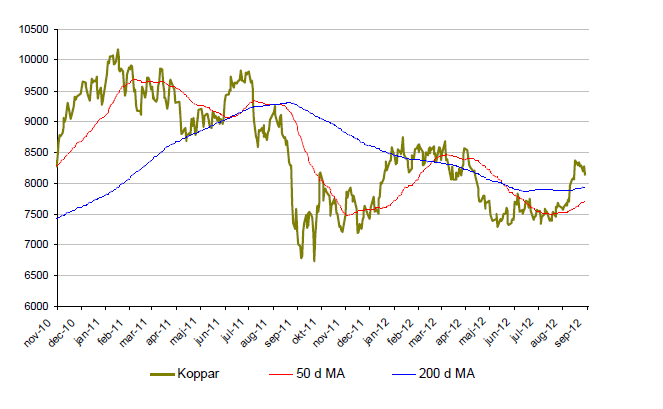
Koppar
- För året är koppar upp ca 9 %.
- Under september är koppar upp drygt 8 %.
- Efterfrågan ser ut att fortsätta att växa trots svaga utsikter i utvecklingsländerna.
- Rapporter om minskade kinesiska kopparlager kan pressa upp koppar ytterligare.
- Antalet spekulanter som tror på uppgång i koppar är nu också i övervikt vilket talar för att investerare positionerar sig för uppgång.
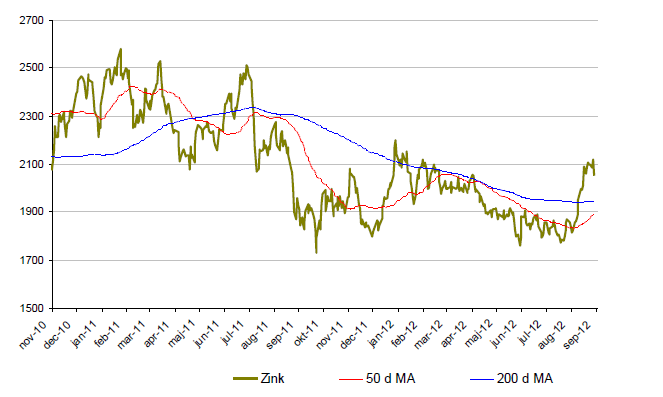
Zink
- Zinkpriset har fått ett ordentligt uppsving under september månad.
- För året är zink upp 13 % vilket är samma siffra som zink är upp under september.
- Trots den positiva utvecklingen kommer rapporter om ökade lager. Dessutom är nya gruvor på ingång till följd av det höga priset i relation till aluminium och nickel.
- Viktig botten kring 1750$.
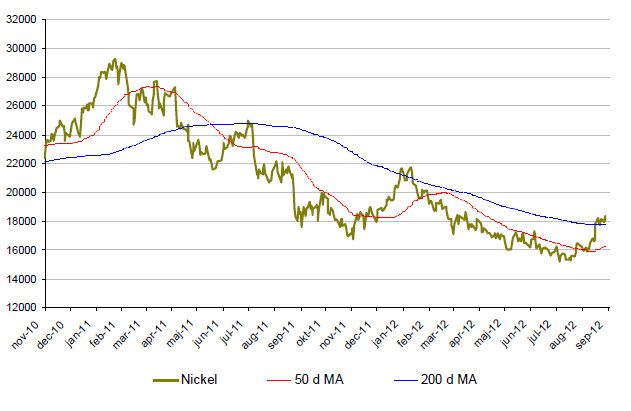
Nickel
- Nickel presterade sämst av alla basmetaller under 2011.
- Efter en stark septembermånad är nu nickel på plus igen. 15,7 % upp i september.
- Trots uppgången är nickelmarknaden är mättad med ökande lager.
- Många stora projekt inom nickelproduktion är redan finansierade och irreversibla vilket kommer att öka tillgången av nickel ytterligare.
Råvaror – Jordbruk
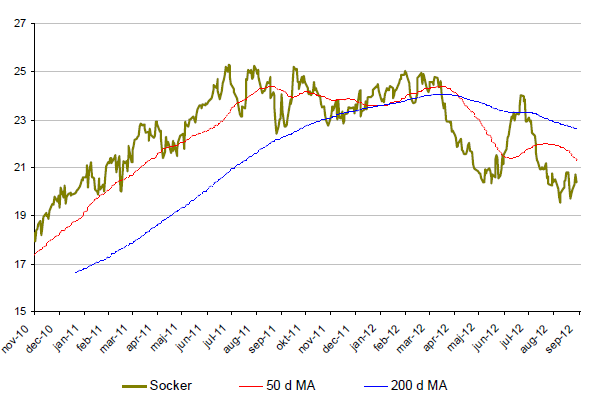
Socker
- Socker befinner sig i en negativ trend med viktig stödnivå kring 19 cents.
- För året är silver ned ca 16 %.
- Den låga nivån av sötningsmedel i kombination med ökad konsumtion kan vända trenden.
- Väderförhållanden i Brasilien och Indien har förbättrats avsevärt.
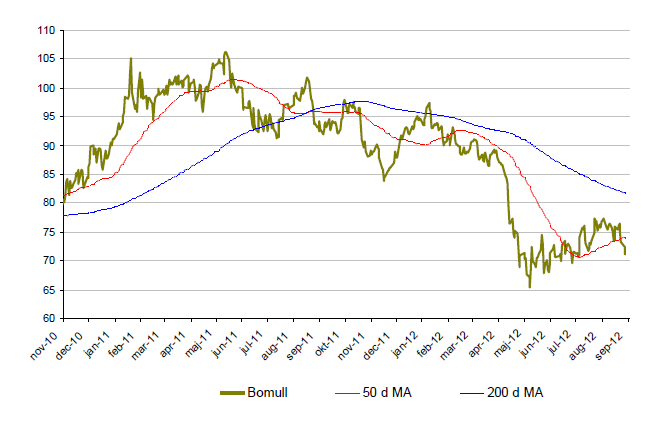
Bomull
- Bomull är för året ned ca 23 % där merparten av nedgången kom i maj. I maj föll bomullspriset med närmare 20 %.
- Under september månad är priset på bomull upp nära 8 %.
- Svag kinesisk och indisk efterfrågan samt lägre ekonomisk tillväxt i Europa har lett till ökade lager. Monetära stimulanspaket kan ge en uppsving för konjunkturen och därmed öka bomullskonsumtionen.
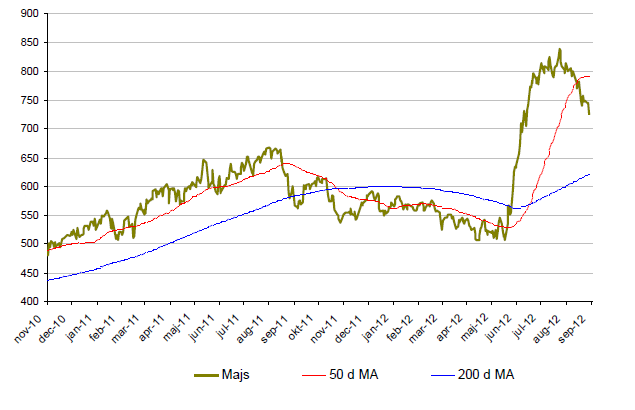
Majs
- Efter den kraftiga uppgången under sommaren har priset på majs nu tappat.
- För året är majs upp 10 %.
- Under sommaren rådde extrem torka i USA vilket fick priset på majs att skjuta i höjden. Endast 40 % av skörden spåddes vara av god kvalitet. Att jämföra med 70 % i normala fall.
- Lägre etanolefterfrågan, skifte från majs till vete vid utfodring av djur samt minskad amerikansk export kyler av priset på majs.
Vete
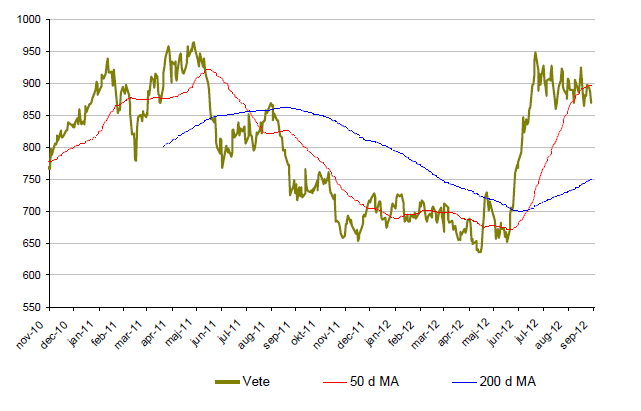
- Vete har efter sommarens uppgång nu stabiliserats och handlas i ett spann mellan 850 och 940 cents.
- Bryter vete igenom någon av dessa nivåer kan det gå fort.
- För året är priset på vete upp 31 %.
Apelsinjuice
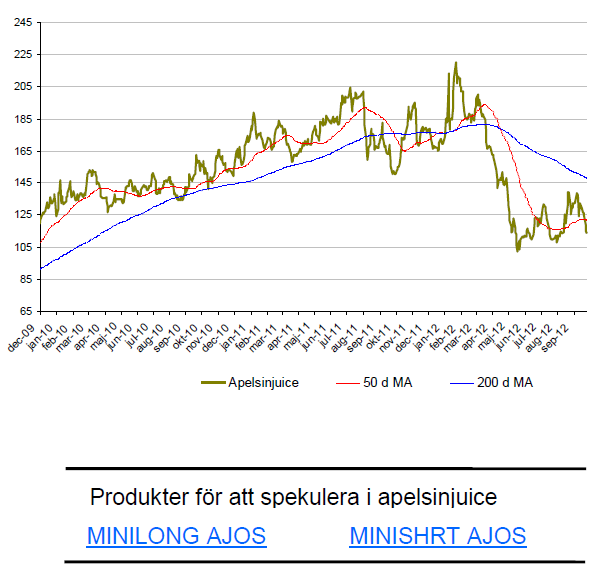
- Apelsinjuice är ned ca 3 % under september.
- För året är priset på apelsinjuice kraftigt ned. Ned ca 33 % för året.
- Priset på apelsinjuice är fortfarande 75 % högre än botten 2009. Fallhöjden är således hög.
[box]Denna uppdatering är producerat av SIP Nordic och publiceras i samarbete och med tillstånd på Råvarumarknaden.se[/box]
Ansvarsbegränsning
Detta produktblad utgör endast marknadsföring och har sammanställts av SIP Nordic Fondkommission AB.
Innehållet ger inte fullständig information avseende det finansiella instrumentet. Investerare uppmanas att del av prospekt och slutliga villkor, vilka finns tillgängliga på: www.rbsbank.se/markets, innan ett investeringsbeslut tas.
Förekommande exempel är simulerade och baseras på SIP Nordics egna beräkningar och antaganden, en person som använder andra data eller antaganden kan nå andra resultat. Administrativa avgifter och transaktionsavgifter påverkar den faktiska avkastningen.
Analys
Brent crude set to dip its feet into the high $50ies/b this week

Parts of the Brent crude curve dipping into the high $50ies/b. Brent crude fell 2.3% over the week to Friday. It closed the week at $61.29/b, a slight gain on the day, but also traded to a low of $60.14/b that same day and just barely avoided trading into the $50ies/b. This morning it is risk-on in equities which seems to help industrial metals a little higher. But no such luck for oil. It is down 0.8% at $60.8/b. This week looks set for Brent crude to dip its feet in the $50ies/b. The Brent 3mth contract actually traded into the high $50ies/b on Friday.

The front-end backwardation has been on a weakening foot and is now about to fully disappear. The lowest point of the crude oil curve has also moved steadily lower and lower and its discount to the 5yr contract is now $6.8/b. A solid contango. The Brent 3mth contract did actually dip into the $50ies/b intraday on Friday when it traded to a low point of $59.93/b.
More weakness to come as lots of oil at sea comes to ports. Mid-East OPEC countries have boosted exports along with lower post summer consumption and higher production. The result is highly visibly in oil at sea which increased by 17 mb to 1,311 mb over the week to Sunday. Up 185 mb since mid-August. On its way to discharge at a port somewhere over the coming month or two.
Don’t forget that the oil market path ahead is all down to OPEC+. Remember that what is playing out in the oil market now is all by design by OPEC+. The group has decided that the unwind of the voluntary cuts is what it wants to do. In a combination of meeting demand from consumers as well as taking back market share. But we need to remember that how this plays out going forward is all at the mercy of what OPEC+ decides to do. It will halt the unwinding at some point. It will revert to cuts instead of unwind at some point.
A few months with Brent at $55/b and 40-50 US shale oil rigs kicked out may be what is needed. We think OPEC+ needs to see the exit of another 40-50 drilling rigs in the US shale oil patches to set US shale oil production on a path to of a 1 mb/d year on year decline Dec-25 to Dec-26. We are not there yet. But a 2-3 months period with Brent crude averaging $55/b would probably do it.
Oil on water increased 17 mb over the week to Sunday while oil in transit increased by 23 mb. So less oil was standing still. More was moving.

Crude oil floating storage (stationary more than 7 days). Down 11 mb over week to Sunday

The lowest point of the Brent crude oil curve versus the 5yr contract. Weakest so far this year.

Crude oil 1mth to 3mth time-spreads. Dubai held out strongly through summer, but then that center of strength fell apart in late September and has been leading weakness in crude curves lower since then.

Analys
Crude oil soon coming to a port near you

Rebounding along with most markets. But concerns over solidity of Gaza peace may also contribute. Brent crude fell 0.8% yesterday to $61.91/b and its lowest close since May this year. This morning it is bouncing up 0.9% to $62.5/b along with a softer USD amid positive sentiment with both equities and industrial metals moving higher. Concerns that the peace in Gaza may be less solid than what one might hope for also yields some support to Brent. Bets on tech stocks are rebounding, defying fears of trade war. Money moving back into markets. Gold continues upwards its strong trend and a softer dollar helps it higher today as well.

US crude & products probably rose 5.6 mb last week (API) versus a normal seasonal decline of 2.4 mb. The US API last night partial and thus indicative data for US oil inventories. Their data indicates that US crude stocks rose 7.4 mb last week, gasoline stocks rose 3.0 mb while Distillate stocks fell 4.8 mb. Altogether an increase in commercial crude and product stocks of 5.6 mb. Commercial US crude and product stocks normally decline by 2.4 mb this time of year. So seasonally adjusted the US inventories rose 8 mb last week according to the indicative numbers by the API. That is a lot. Also, the counter seasonal trend of rising stocks versus normally declining stocks this time of year looks on a solid pace of continuation. If the API is correct then total US crude and product stocks would stand 41 mb higher than one year ago and 6 mb higher than the 2015-19 average. And if we combine this with our knowledge of a sharp increase in production and exports by OPEC(+) and a large increase in oil at sea, then the current trend in US oil inventories looks set to continue. So higher stocks and lower crude oil prices until OPEC(+) switch to cuts. Actual US oil inventory data today at 18:00 CET.
US commercial crude and product stocks rising to 1293 mb in week 41 if last nights indicative numbers from API are correct.

Crude oil soon coming to a port near you. OPEC has lifted production sharply higher this autumn. At the same time demand for oil in the Middle-East has fallen as we have moved out of summer heat and crude oil burn for power for air-conditioning. The Middle-East oil producers have thus been able to lift exports higher on both accounts. Crude oil and condensates on water has shot up by 177 mb since mid-August. This oil is now on its way to ports around the world. And when they arrive, it will likely help to lift stocks onshore higher. That is probably when we will lose the last bit of front-end backwardation the the crude oil curves. That will help to drive the front-month Brent crude oil price down to the $60/b line and revisit the high $50ies/b. Then the eyes will be all back on OPEC+ when they meet in early November and then again in early December.
Crude oil and condensates at sea have moved straight up by 177 mb since mid-August as OPEC(+) has produced more, consumed less and exported more.

Analys
The Mid-East anchor dragging crude oil lower

When it starts to move lower it moves rather quickly. Gaza, China, IEA. Brent crude is down 2.1% today to $62/b after having traded as high as $66.58/b last Thursday and above $70/b in late September. The sell-off follows the truce/peace in Gaze, a flareup in US-China trade and yet another bearish oil outlook from the IEA.

A lasting peace in Gaze could drive crude oil at sea to onshore stocks. A lasting peace in Gaza would probably calm down the Houthis and thus allow more normal shipments of crude oil to sail through the Suez Canal, the Red Sea and out through the Bab-el-Mandeb Strait. Crude oil at sea has risen from 48 mb in April to now 91 mb versus a pre-Covid normal of about 50-60 mb. The rise to 91 mb is probably the result of crude sailing around Africa to be shot to pieces by the Houthis. If sailings were to normalize through the Suez Canal, then it could free up some 40 mb in transit at sea moving onshore into stocks.
The US-China trade conflict is of course bearish for demand if it continues.
Bearish IEA yet again. Getting closer to 2026. Credibility rises. We expect OPEC to cut end of 2025. The bearish monthly report from the IEA is what it is, but the closer we get to 2026, the more likely the IEA is of being ball-park right in its outlook. In its monthly report today the IEA estimates that the need for crude oil from OPEC in 2026 will be 25.4 mb/d versus production by the group in September of 29.1 mb/d. The group thus needs to do some serious cutting at the end of 2025 if it wants to keep the market balanced and avoid inventories from skyrocketing. Given that IEA is correct that is. We do however expect OPEC to implement cuts to avoid a large increase in inventories in Q1-26. The group will probably revert to cuts either at its early December meeting when they discuss production for January or in early January when they discuss production for February. The oil price will likely head yet lower until the group reverts to cuts.
Dubai: The Mid-East anchor dragging crude oil lower. Surplus emerging in Mid-East pricing. Crude oil prices held surprisingly strong all through the summer. A sign and a key source of that strength came from the strength in the front-end backwardation of the Dubai crude oil curve. It held out strong from mid-June and all until late September with an average 1-3mth time-spread premium of $1.8/b from mid-June to end of September. The 1-3mth time-spreads for Brent and WTI however were in steady deterioration from late June while their flat prices probably were held up by the strength coming from the Persian Gulf. Then in late September the strength in the Dubai curve suddenly collapsed. Since the start of October it has been weaker than both the Brent and the WTI curves. The Dubai 1-3mth time-spread now only stands at $0.25/b. The Middle East is now exporting more as it is producing more and also consuming less following elevated summer crude burn for power (Aircon) etc.
The only bear-element missing is a sudden and solid rise in OECD stocks. The only thing that is missing for the bear-case everyone have been waiting for is a solid, visible rise in OECD stocks in general and US oil stocks specifically. So watch out for US API indications tomorrow and official US oil inventories on Thursday.
No sign of any kind of fire-sale of oil from Saudi Arabia yet. To what we can see, Saudi Arabia is not at all struggling to sell its oil. It only lowered its Official Selling Prices (OSPs) to Asia marginally for November. A surplus market + Saudi determination to sell its oil to the market would normally lead to a sharp lowering of Saudi OSPs to Asia. Not yet at least and not for November.
The 5yr contract close to fixed at $68/b. Of importance with respect to how far down oil can/will go. When the oil market moves into a surplus then the spot price starts to trade in a large discount to the 5yr contract. Typically $10-15/b below the 5yr contract on average in bear-years (2009, 2015, 2016, 2020). But the 5yr contract is usually pulled lower as well thus making this approach a moving target. But the 5yr contract price has now been rock solidly been pegged to $68/b since 2022. And in the 2022 bull-year (Brent spot average $99/b), the 5yr contract only went to $72/b on average. If we assume that the same goes for the downside and that 2026 is a bear-year then the 5yr goes to $64/b while the spot is trading at a $10-15/b discount to that. That would imply an average spot price next year of $49-54/b. But that is if OPEC doesn’t revert to cuts and instead keeps production flowing. We think OPEC(+) will trim/cut production as needed into 2026 to prevent a huge build-up in global oil stocks and a crash in prices. But for now we are still heading lower. Into the $50ies/b.
-

 Nyheter4 veckor sedan
OPEC+ missar produktionsmål, stöder oljepriserna
-

 Nyheter2 veckor sedan
Goldman Sachs höjer prognosen för guld, tror priset når 4900 USD
-

 Nyheter4 veckor sedan
Ett samtal om guld, olja, fjärrvärme och förnybar energi
-

 Nyheter3 veckor sedan
Blykalla och amerikanska Oklo inleder ett samarbete
-

 Nyheter3 veckor sedan
Guld nära 4000 USD och silver 50 USD, därför kan de fortsätta stiga
-

 Analys4 veckor sedan
Are Ukraine’s attacks on Russian energy infrastructure working?
-

 Nyheter3 veckor sedan
Ett samtal om guld, olja, koppar och stål
-

 Nyheter2 veckor sedan
Nytt prisrekord, guld stiger över 4000 USD


