

Analys
The show must go on in Vienna

![]() Along with the market, we expect an extension of oil production cuts from OPEC and Russia at the upcoming OPEC meeting in Vienna on November 30. OPEC is sailing with a strong tailwind, as a draw on global stocks has started, and compliance reached more than 100% in both OPEC and non-OPEC in October for the first time. For H1 2018, we see compliance with proposed cuts as less of a problem; instead, market focus will move to global stocks, which will likely start to flatten as the seasonal tailwind has swept through and there is higher activity in US shale after oil traded above USD 60.
Along with the market, we expect an extension of oil production cuts from OPEC and Russia at the upcoming OPEC meeting in Vienna on November 30. OPEC is sailing with a strong tailwind, as a draw on global stocks has started, and compliance reached more than 100% in both OPEC and non-OPEC in October for the first time. For H1 2018, we see compliance with proposed cuts as less of a problem; instead, market focus will move to global stocks, which will likely start to flatten as the seasonal tailwind has swept through and there is higher activity in US shale after oil traded above USD 60.
High expectations
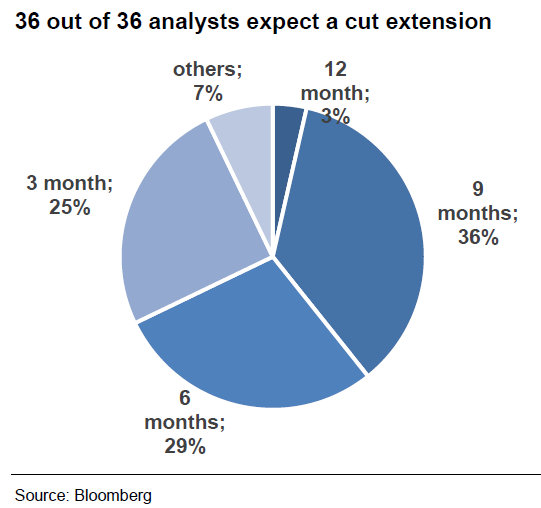 According to a Bloomberg survey, oil traders and analysts unanimously expect OPEC and Russia to prolong their production cuts on Thursday. Behind the scenes, however, it seems as though Saudi Arabia and Russia are still debating what course to follow, particularly regarding the duration of the extension.
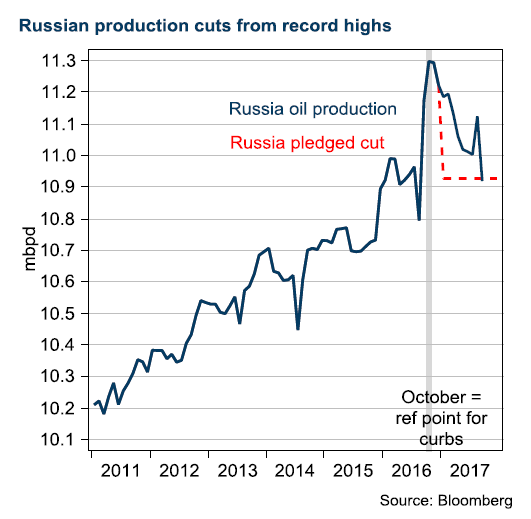
Russia’s economy minister said last week that the OPEC/non-OPEC production cuts hurt Russia’s economic growth on October, through lower oil production, and indirectly, through lower investment activity. That was the first negative comment about the pact from a high-ranking Russian official. Despite the signs that Russian policy makers may be having second thoughts, they will agree to an extension in the end, in our view. Anything but an extension supported by Russia would have a significant negative impact on prices.
Putin crowns himself OPEC king
OPEC gatherings still influence oil prices, but Saudi Arabia’s voice no longer matters most in the media. Since he engineered Russia’s pact with OPEC 12 month ago, President Vladimir Putin has emerged as the group’s most influential player, in our view. Putin is now calling all the shots.
 Cuts implemented successfully
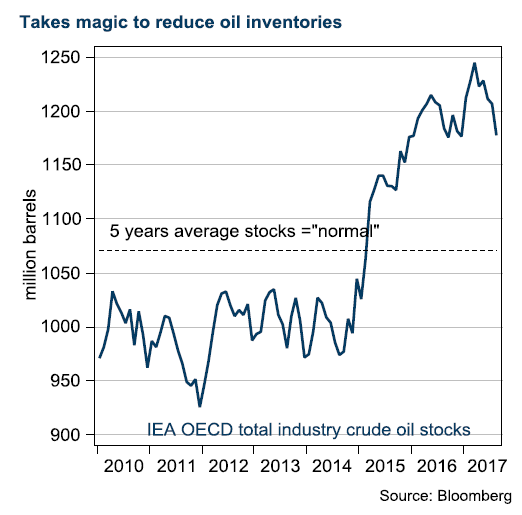
Over the past year, OPEC and several other key producers, including Russia, have agreed to cut production by 1.8 million bbl/d to reduce a global glut, formally defined as returning global stocks to normal levels, i.e. their five-year average. The group reached more than 100% compliance for the first time in October. That’s a striking and surprising fact, in our view, and the market has reacted to OPEC’s success by trading oil at higher prices.
Will not reach target
Given the impressive compliance, it is striking, in our view, that OPEC is so far from its target of draining global stocks. Inventories are lower, but we believe the strong seasonal effect of the US driving season this year is the key factor behind that. The target should have been reached in May, but will not be reached by the November meeting, and it would be surprising if normal stock levels were reached before OPEC’s spring meeting in May/June 2018.
 Saudi Arabia supports an extension
It has become obvious that Crown Prince Mohammed bin Salman, who has emerged as Saudi Arabia’s leading economic force, was the architect of the Saudi policy U-turn in Doha in 2016, leading up to the cut at the meeting in Vienna in November 2016. In our view, this was confirmed by the replacement of Ali al-Naimi, after two decades as oil minister, with the more politically-oriented Khalid al-Falih.
Prince Mohammed has put the divestment of Aramco at the top of his agenda, and that is the basis of Saudi policy and its willingness to cut production in return for a short-term rise in the oil price. The Aramco IPO should top the board’s agenda and will take place during the second half of 2018, according to al-Falih during a state visit to Russia earlier this autumn.
Costly mistake
The savvy players recognise the danger of cutting production. History is repeating itself. Higher prices have triggered a reverse in the US production drop, extending the time it takes for the market to balance, and pushing the volume share away from OPEC and toward two non-cut participants, the US and recently also Libya.
 US shale flattening
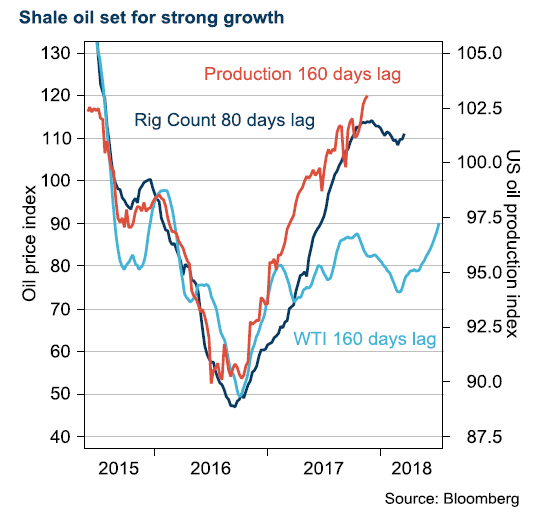
In our model, which has served us well since the cycle collapse in 2014, we see around an 80-day lag from peak to trough in prices, before a new activity direction in rig count, and we see around 80 more days before an impact on production. In other words, a 160-day lag in production from a new price direction. After the recent oil price rally, rig counts will start to increase in our model, and early data are already confirming this new trend, which will have a negative impact on oil prices.
Research disclaimer
Risk warning
All investments involve risks and investors are encouraged to make their own decision as to the appropriateness of an investment in any securities referred to in this report, based on their specific investment objectives, financial status and risk tolerance. The historical return of a financial instrument is not a guarantee of future return. The value of financial instruments can rise or fall, and it is not certain that you will get back all the capital you have invested.
Research disclaimers
Handelsbanken Capital Markets, a division of Svenska Handelsbanken AB (publ) (collectively referred to herein as ‘SHB’), is responsible for the preparation of research reports. SHB is regulated in Sweden by the Swedish Financial Supervisory Authority, in Norway by the Financial Supervisory Authority of Norway, in Finland by the Financial Supervisory Authority and in Denmark by the Danish Financial Supervisory Authority. All research reports are prepared from trade and statistical services and other information that SHB considers to be reliable. SHB has not independently verified such information and does not represent that such information is true, accurate or complete. Accordingly, to the extent permitted by law, neither SHB, nor any of its directors, officers or employees, nor any other person, accept any liability whatsoever for any loss, however it arises, from any use of such research reports or its contents or otherwise arising in connection therewith.
In no event will SHB or any of its affiliates, their officers, directors or employees be liable to any person for any direct, indirect, special or consequential damages arising out of any use of the information contained in the research reports, including without limitation any lost profits even if SHB is expressly advised of the possibility or likelihood of such damages.
The views contained in SHB research reports are the opinions of employees of SHB and its affiliates and accurately reflect the personal views of the respective analysts at this date and are subject to change. There can be no assurance that future events will be consistent with any such opinions. Each analyst identified in this research report also certifies that the opinions expressed herein and attributed to such analyst accurately reflect his or her individual views about the companies or securities discussed in the research report.
Research reports are prepared by SHB for information purposes only. The information in the research reports does not constitute a personal recommendation or personalised investment advice and such reports or opinions should not be the basis for making investment or strategic decisions. This document does not constitute or form part of any offer for sale or subscription of or solicitation of any offer to buy or subscribe for any securities nor shall it or any part of it form the basis of or be relied on in connection with any contract or commitment whatsoever. Past performance may not be repeated and should not be seen as an indication of future performance. The value of investments and the income from them may go down as well as up and investors may forfeit all principal originally invested. Investors are not guaranteed to make profits on investments and may lose money. Exchange rates may cause the value of overseas investments and the income arising from them to rise or fall. This research product will be updated on a regular basis.
No part of SHB research reports may be reproduced or distributed to any other person without the prior written consent of SHB. The distribution of this document in certain jurisdictions may be restricted by law and persons into whose possession this document comes should inform themselves about, and observe, any such restrictions.
The report does not cover any legal or tax-related aspects pertaining to any of the issuer’s planned or existing debt issuances.


Down to the lowest since early May. Brent crude has fallen sharply the latest four days. It closed at USD 64.11/b yesterday which is the lowest since early May. It is staging a 1.3% rebound this morning along with gains in both equities and industrial metals with an added touch of support from a softer USD on top.

What stands out the most to us this week is the collapse in the Dubai one to three months time-spread.
Dubai is medium sour crude. OPEC+ is in general medium sour crude production. Asian refineries are predominantly designed to process medium sour crude. So Dubai is the real measure of the balance between OPEC+ holding back or not versus Asian oil demand for consumption and stock building.
A sharp weakening of the front-end of the Dubai curve. The front-end of the Dubai crude curve has been holding out very solidly throughout this summer while the front-end of the Brent and WTI curves have been steadily softening. But the strength in the Dubai curve in our view was carrying the crude oil market in general. A source of strength in the crude oil market. The core of the strength.
The now finally sharp decline of the front-end of the Dubai crude curve is thus a strong shift. Weakness in the Dubai crude marker is weakness in the core of the oil market. The core which has helped to hold the oil market elevated.
Facts supports the weakening. Add in facts of Iraq lifting production from Kurdistan through Turkey. Saudi Arabia lifting production to 10 mb/d in September (normal production level) and lifting exports as well as domestic demand for oil for power for air con is fading along with summer heat. Add also in counter seasonal rise in US crude and product stocks last week. US oil stocks usually decline by 1.3 mb/week this time of year. Last week they instead rose 6.4 mb/week (+7.2 mb if including SPR). Total US commercial oil stocks are now only 2.1 mb below the 2015-19 seasonal average. US oil stocks normally decline from now to Christmas. If they instead continue to rise, then it will be strongly counter seasonal rise and will create a very strong bearish pressure on oil prices.
Will OPEC+ lift its voluntary quotas by zero, 137 kb/d, 500 kb/d or 1.5 mb/d? On Sunday of course OPEC+ will decide on how much to unwind of the remaining 1.5 mb/d of voluntary quotas for November. Will it be 137 kb/d yet again as for October? Will it be 500 kb/d as was talked about earlier this week? Or will it be a full unwind in one go of 1.5 mb/d? We think most likely now it will be at least 500 kb/d and possibly a full unwind. We discussed this in a not earlier this week: ”500 kb/d of voluntary quotas in October. But a full unwind of 1.5 mb/d”
The strength in the front-end of the Dubai curve held out through summer while Brent and WTI curve structures weakened steadily. That core strength helped to keep flat crude oil prices elevated close to the 70-line. Now also the Dubai curve has given in.

Brent crude oil forward curves

Total US commercial stocks now close to normal. Counter seasonal rise last week. Rest of year?

Total US crude and product stocks on a steady trend higher.

Analys
OPEC+ will likely unwind 500 kb/d of voluntary quotas in October. But a full unwind of 1.5 mb/d in one go could be in the cards
Down to mid-60ies as Iraq lifts production while Saudi may be tired of voluntary cut frugality. The Brent December contract dropped 1.6% yesterday to USD 66.03/b. This morning it is down another 0.3% to USD 65.8/b. The drop in the price came on the back of the combined news that Iraq has resumed 190 kb/d of production in Kurdistan with exports through Turkey while OPEC+ delegates send signals that the group will unwind the remaining 1.65 mb/d (less the 137 kb/d in October) of voluntary cuts at a pace of 500 kb/d per month pace.
Signals of accelerated unwind and Iraqi increase may be connected. Russia, Kazakhstan and Iraq were main offenders versus the voluntary quotas they had agreed to follow. Russia had a production ’debt’ (cumulative overproduction versus quota) of close to 90 mb in March this year while Kazakhstan had a ’debt’ of about 60 mb and the same for Iraq. This apparently made Saudi Arabia angry this spring. Why should Saudi Arabia hold back if the other voluntary cutters were just freeriding? Thus the sudden rapid unwinding of voluntary cuts. That is at least one angle of explanations for the accelerated unwinding.
If the offenders with production debts then refrained from lifting production as the voluntary cuts were rapidly unwinded, then they could ’pay back’ their ’debts’ as they would under-produce versus the new and steadily higher quotas.
Forget about Kazakhstan. Its production was just too far above the quotas with no hope that the country would hold back production due to cross-ownership of oil assets by international oil companies. But Russia and Iraq should be able to do it.
Iraqi cumulative overproduction versus quotas could reach 85-90 mb in October. Iraq has however steadily continued to overproduce by 3-5 mb per month. In July its new and gradually higher quota came close to equal with a cumulative overproduction of only 0.6 mb that month. In August again however its production had an overshoot of 100 kb/d or 3.1 mb for the month. Its cumulative production debt had then risen to close to 80 mb. We don’t know for September yet. But looking at October we now know that its production will likely average close to 4.5 mb/d due to the revival of 190 kb/d of production in Kurdistan. Its quota however will only be 4.24 mb/d. Its overproduction in October will thus likely be around 250 kb/d above its quota with its production debt rising another 7-8 mb to a total of close to 90 mb.
Again, why should Saudi Arabia be frugal while Iraq is freeriding. Better to get rid of the voluntary quotas as quickly as possible and then start all over with clean sheets.
Unwinding the remaining 1.513 mb/d in one go in October? If OPEC+ unwinds the remaining 1.513 mb/d of voluntary cuts in one big go in October, then Iraq’s quota will be around 4.4 mb/d for October versus its likely production of close to 4.5 mb/d for the coming month..
OPEC+ should thus unwind the remaining 1.513 mb/d (1.65 – 0.137 mb/d) in one go for October in order for the quota of Iraq to be able to keep track with Iraq’s actual production increase.
October 5 will show how it plays out. But a quota unwind of at least 500 kb/d for Oct seems likely. An overall increase of at least 500 kb/d in the voluntary quota for October looks likely. But it could be the whole 1.513 mb/d in one go. If the increase in the quota is ’only’ 500 kb/d then Iraqi cumulative production will still rise by 5.7 mb to a total of 85 mb in October.
Iraqi production debt versus quotas will likely rise by 5.7 mb in October if OPEC+ only lifts the overall quota by 500 kb/d in October. Here assuming historical production debt did not rise in September. That Iraq lifts its production by 190 kb/d in October to 4.47 mb/d (August level + 190 kb/d) and that OPEC+ unwinds 500 kb/d of the remining quotas in October when they decide on this on 5 October.

U.S. commercial crude inventories posted a marginal draw last week, falling by 0.6 million barrels to 414.8 million barrels. Inventories remain 4% below the five-year seasonal average, but the draw is far smaller than last week’s massive 9.3-million-barrel decline. Higher crude imports (+803,000 bl d WoW) and steady refinery runs (93% utilization) helped keep the crude balance relatively neutral.

Yet another drawdown indicates commercial crude inventories continue to trend below the 2015–2022 seasonal norm (~440 million barrels), though at 414.8 million barrels, levels are now almost exactly in line with both the 2023 and 2024 trajectory, suggesting stable YoY conditions (see page 3 attached).
Gasoline inventories dropped by 1.1 million barrels and are now 2% below the five-year average. The decline was broad-based, with both finished gasoline and blending components falling, indicating lower output and resilient end-user demand as we enter the shoulder season post-summer (see page 6 attached).
On the diesel side, distillate inventories declined by 1.7 million barrels, snapping a two-week streak of strong builds. At 125 million barrels, diesel inventories are once again 8% below the five-year average and trending near the low end of the historical range.
In total, commercial petroleum inventories (excl. SPR) slipped by 0.5 million barrels on the week to ish 1,281.5 million barrels. While essentially flat, this ends a two-week streak of meaningful builds, reflecting a return to a slightly tighter situation.
On the demand side, the DOE’s ‘products supplied’ metric (see page 6 attached), a proxy for implied consumption, softened slightly. Total demand for crude oil over the past four weeks averaged 20.5 million barrels per day, up just 0.9% YoY.
Summing up: This week’s report shows a re-tightening in diesel supply and modest draws across the board, while demand growth is beginning to flatten. Inventories remain structurally low, but the tone is less bullish than in recent weeks.


A sharp weakening at the core of the oil market: The Dubai curve

Guld nära 4000 USD och silver 50 USD, därför kan de fortsätta stiga
OPEC+ will likely unwind 500 kb/d of voluntary quotas in October. But a full unwind of 1.5 mb/d in one go could be in the cards

Blykalla och amerikanska Oklo inleder ett samarbete

Fortsatt stabilt elpris – men dubbelt så dyrt som i fjol

Eurobattery Minerals satsar på kritiska metaller för Europas självförsörjning

Mahvie Minerals i en guldtrend

Guldpriset kan närma sig 5000 USD om centralbankens oberoende skadas

OPEC signalerar att de inte bryr sig om oljepriset faller kommande månader
Volatile but going nowhere. Brent crude circles USD 66 as market weighs surplus vs risk
-
 Nyheter4 veckor sedan
Eurobattery Minerals satsar på kritiska metaller för Europas självförsörjning
-
 Nyheter3 veckor sedan
Mahvie Minerals i en guldtrend
-
 Nyheter4 veckor sedan
Guldpriset kan närma sig 5000 USD om centralbankens oberoende skadas
-
 Nyheter4 veckor sedan
OPEC signalerar att de inte bryr sig om oljepriset faller kommande månader
-
Analys3 veckor sedan
Volatile but going nowhere. Brent crude circles USD 66 as market weighs surplus vs risk
-

 Nyheter3 veckor sedan
Aktier i guldbolag laggar priset på guld
-

 Nyheter3 veckor sedan
Kinas elproduktion slog nytt rekord i augusti, vilket även kolkraft gjorde
-
 Nyheter2 veckor sedan
Tyskland har så höga elpriser att företag inte har råd att använda elektricitet