

Analys
Risk for OPEC dissapointment and a short term sell-off as all bets are on the long side

 Marked has placed all chips on the long side betting on an extension of OPEC/non-OPEC production cuts which officially ends in Q1-18. In general we do think that OPEC/non-OPEC will manage the market and hold back production if needed through 2018 in order to secure further gradual draw down of OECD inventories. However we also think that it would be better for OPEC/non-OPEC to make hard decissions on this in Feb/Mar getting as much data as possible before making that decission. That is also what the group has mostly consistengly communicated through the autumn. The market seems to expect and demand a firm decission right now this week. As such the market is rigged for dissapointment with a possible short term sell-off as all chips are on the long side.
On Thursday 30th OPEC and some non-OPEC producers will meet in Vienna to discuss whether to extend current production cuts or not.
The communication all through the autumn has been that they want to make this decission in February/March 2018 in order to have as much data on the table as possible before making the decission.
That makes a lot of sense since there is substantial dissagreement with respect to how much oil is needed from OPEC in 2018.
Somehow the market has geared it self up to an expectation that OPEC/non-OPEC needs to make a firm decission on this right now on Thursday. And further that the decission will be an extension of current cuts maintained all to the end of 2018.
As such it seems to us that there is a substantial risk that the market is setting it self up for a dissapointment this week. For us it makes much more sense for the group to make this call in Feb/Mar which is also what they mostly have been communicating all through the autumn.
The challenge for the group this is week may thus be all about managing the market’s expectations. How not to let the market down when it communicates that the decission will be taken in Feb/March.
And if there is a decission this week it is likely going to be a sign of intention: “If needed we’ll maintain cuts to the end of 2018”, or “We’ll maintain cuts to June 2018 and then make a new assessment”, or “We are all in agreement that we’ll extend cuts as long as needed in order to drive OECD inventories down to the 5 year average”.
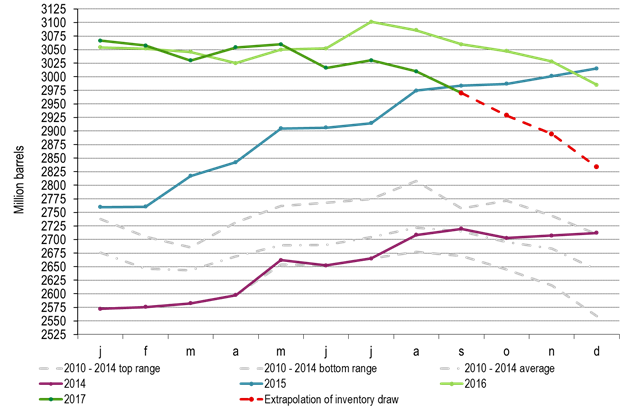
That is indeed a trickey reference. This is because for every month we move forward the 5 year average reference is rising. Since March 2017 the OECD inventories have declined some 0.7 mb/d when adjusting for seasonal trends (given by the 2010-2014 seasonal average profile). If we extend this decline rate on top of the seasonal trend (2010-2014) we actually almost get all the way down the 2013-2017 average profile.
As such one can say that in February when we get the OECD inventory data for December 2017 the goal of getting inventories down to the 5 year average (2013-2017) will have been achieved. The goal of getting OECD inventories down to the 5 year average is thus a trickey goal and a moving target.
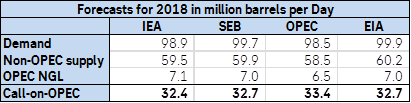
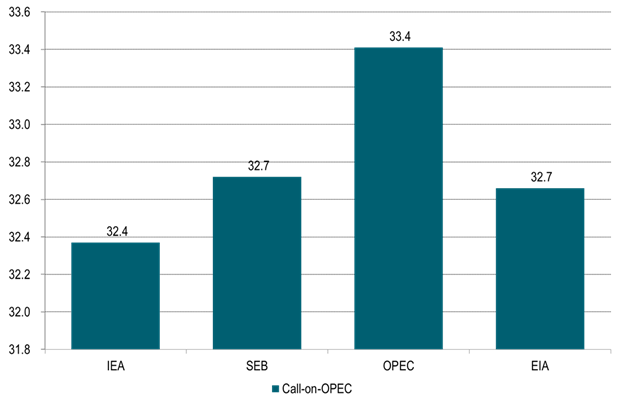
The big question though is what is really needed in order to secure a balanced oil market in 2018? There is a significant dissagreement on this. The IEA says that call-on-OPEC will be 32.4 mb/d in 2018. SEB’s estimate is 32.7 mb/d, the US EIA’s is 32.7 mb/d while OPEC’s own estimate is 33.4 mb/d. Variations on this comes down to projections for demand, US shale oil production and the level of OPEC’s NGL production in 2018.
The OECD draw down since March this year of 0.7 mb/d (adjusted for seasonallity) indicates an implied oil market deficit of 0.7 mb/d thrugh Q2 and Q3 this year during which OPEC produced 32.55 mb/d. However, if we assume that the OECD inventories only cover half or a third of global inventories then what we see of deficit implied by the draw down in the OECD inventories could actually be two or three times as much if there have been comparable draw downs in non-OECD inventories.
Thus beeing carefule about committing to further cuts now on Thursday seems kind of sensible with the aim of instead making that decission in Feb/Mar.
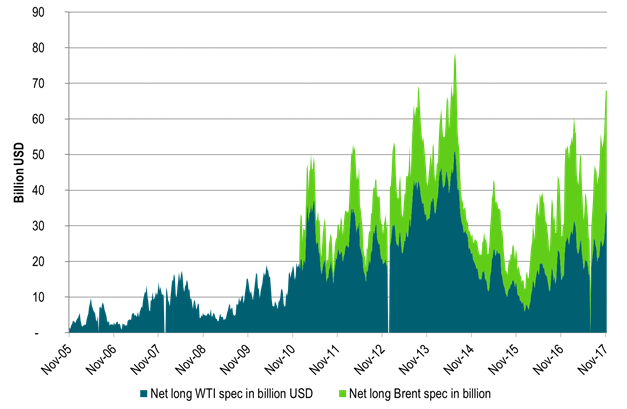
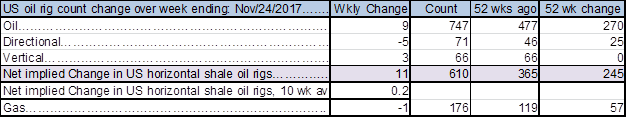
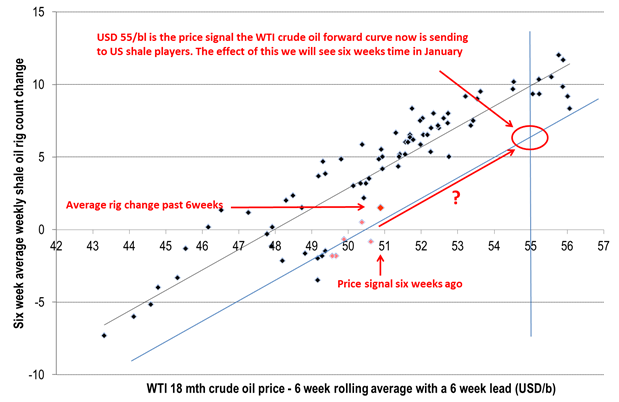
Market participants are seemingly all expecting OPEC/non-OPEC to make a firm and clear decission this Thursday for extending current cuts to Dec-2018. Net long speculative positions for Brent and WTI together are now very close to all time high. US oil rig count has started to rise again (+9 rigs last week). The decission to add these 9 rigs was probably taken some 6-8 weeks ago when the WTI forward price only stood at $51-52/b. Now that reference WTI price stands at $55/bl with a clear risk for a rise in rig count in the weeks to come. The outage of the 590 kbl/d Keystone pipeline due to an oil spill has reduced supply into Cushing Oklahoma by some 4 mbl/week. It has helped to reduce Chushing inventories and to drive also the WTI crude curve into backwardation. However, the Keystone pipline is likely to back in operation within a week or so.
Thus overall there is a fair chance that the market will be dissapointed on Thursday. That there will be no firm decission even though there will be firm support for further cuts if needed. And if OPEC/non-OPEC actually do make a firm decission to maintain cuts all to the end of 2018 then there may not be much upside price action since that decission is already so highly priced in already.
Thus buying a put option on the front month WTI contract with short time to expiry may be a good strattegy in the run-up to this week’s digital OPEC/non-OPEC decission risk on Thursday.
Our general stand on OPEC/non-OPEC cuts for 2018 is that further cuts are likely needed but also that if needed we expect OPEC/non-OPEC to manage the market in order to prevent inventories from rising back up.
Needed cuts will likely be of a magnitude which are perfectly manageable for the group. Why through away all they have acchieved in 2017 with inventory draw downs when they can hold back a little supply.
Ch1: OECD inventories with extrapolation to end of 2017 of the 0.7 mb/d draw down in Q2 and Q3 2017
Getting closer to the 2010-2014 average in December 2017
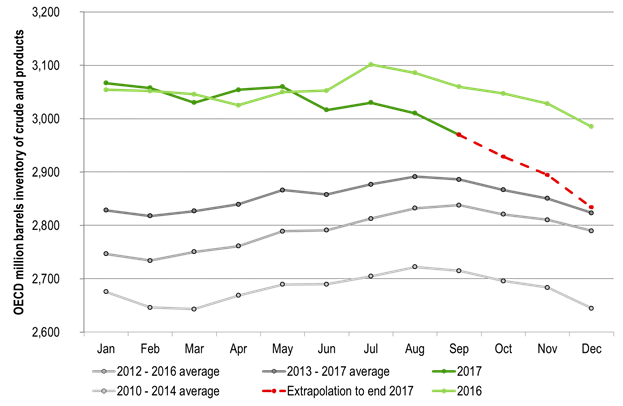
Ch2: OECD inventories. Which 5 year normal should you use? The 2013-2017?
If the latter then mission acomplished in December 2017, but we won’t know before February
Ch3: Call-on-OPEC 2018? – Big dissagreement!
Who knows OPEC NGL the best? Account for 0.6 mb/d difference to the IEA!
Ch4: Close to record USD allocation in net long speculative Brent crude oil positions
Makes it vulnerable to downside corrections and OPEC/non-OPEC dissapointments
Net long Brent crude oil speculative positions are now at the 3rd highest over the past 52 weeks
Ch5: US oil rig count has started to rise again
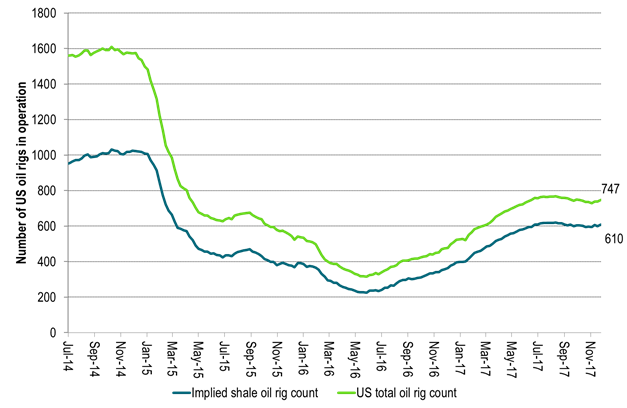
Ch6 The increas in rig count we see now came from price signals some 6-8 weeks ago
Since then the WTI curve price has moved from $51/bl to $55/bl.
The effect of the price rise over the past 6-8 weeks will be visible in terms of rig count over the coming 6-8 weeks
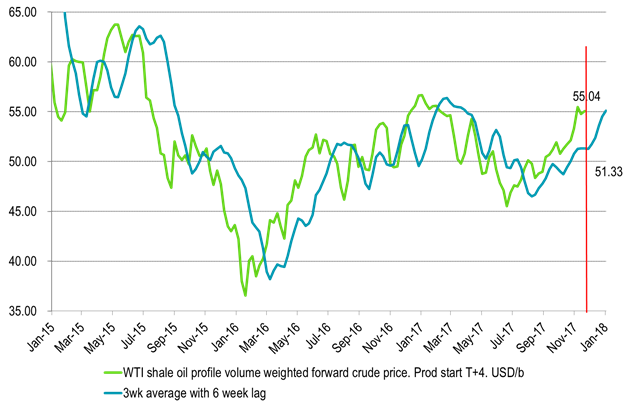
Ch7: Risk of rising rig count in the weeks to come
Could weight bearishly on the WTI crude oil price
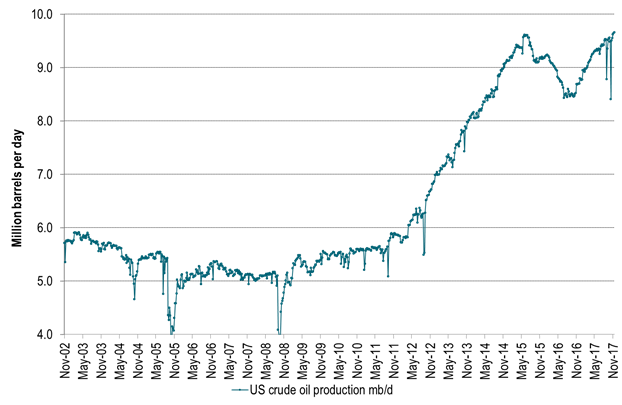
Ch8: While US crude oil production continues to rise
Will it rise 0.7 mb/d or 1.5 mb/d next year?
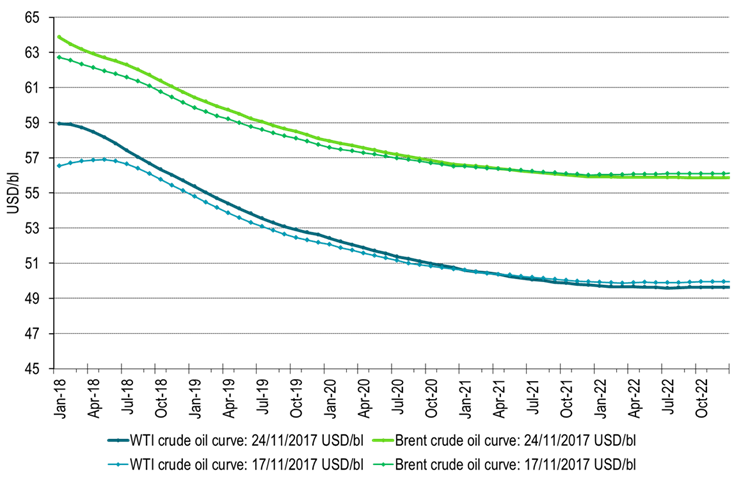
Ch9: WTI crude oil curve shifted into backwardation following the outage of the Keystone pipeline which feeds 590 kbl/d of Canadian oil into Chushing Oklahoma
The Keystone pipeline is likely going to be back on line within a week or so which could push the WTI curve back into contango again
Kind regards
Bjarne Schieldrop
Chief analyst, Commodities
SEB Markets
Merchant Banking
Market is starting to take US/Iran headlines with a pinch of salt. Brent crude rose $2.8/b yesterday to an official close of $112.1/b. But after that it traded as low as $108.05/b before ending late night at around $109.7/b. Through the day it traded in a range of $106.87 – 112.72/b amid a flurry of news or rumors from Iran and the US. ”US temporary sanctions during negotiations” (falls alarm). ”We will bomb Iran” (not anyhow),… etc. While the market is still fluctuating to this kind of news flow, it is starting to take such headlines with a pinch of salt.

We’ll see. Maybe, maybe not. The Brent M1 contract is trading at $110.2/b this morning which very close to the average ticks through yesterday of $110.4/b.
Trump with bearish, verbal intervention whenever Brent trades above $110/b it seems. What seems to be a pattern is that Trump states something like ”very good negotiations going on with Iran”, ”New leaders in Iran are great,..”, ”Great progress in negotiations,…”, ”Deal in sight,..” etc whenever the Brent M1 contract trades above $110/b. An effort to cool the market. These hot air verbal interventions from Trump used to have a heavy bearish impact on prices, but they now seems to have less and less effect unless they are backed by reality.
As far as we can see there has been no real progress in the negotiations between the US and Iran with both sides still standing by their previous demands.
Iran is getting stronger while the cease fire lasts making a return to war for Trump yet harder. Iran is naturally in constant preparation for a return to war given Trump’s steady threats of bombing Iran again. Iran is naturally doing what ever is possible to prepare for a return to war. And every day the cease fire lasts it is better prepared. This naturally makes it more and more difficult and dangerous for the US to return to warring activity versus Iran as the consequences for energy infrastructure in the Persian Gulf will be more and more severe the longer the cease fire lasts. Israel seems to see it this way as well. That the war is not won and that current frozen state of a cease fire gives Iran opportunity to rebuild military and politically.
Global inventories are drawing down day by day. How much? In the meantime the Strait of Hormuz stays closed. There is varying measures and estimates of how much global inventories are drawing down. Our rough estimate, back of the envelope, is that global inventories are drawing down by at least some 10 mb/d or about 300 mb/d in a balance between loss of supply versus demand destruction. Other estimates we see are a monthly draw of 250-270 mb/d. The IEA only ’measured’ a draw in global observable stocks of 117 mb in April with oil on water rising 53 mb while on shore stocks fell 170 mb. But global stocks are hard to measure with large invisible, unmeasured stocks. As such a back of the envelope approach may be better.
Oil products is what the world is consuming. Oil product prices likely to rise while product stocks fall. Strategic Petroleum Reserves (SPR) are predominantly crude oil. Discharging oil from OECD SPR stocks, a sharp reduction in Chinese crude imports and a reduction in global refinery throughput of 6-7 mb/d has helped to keep crude oil markets satisfactorily supplied. But global inventories are drawing down none the less. And oil products is really what the world is consuming. So if global refinery throughput stays subdued, then demand will eventually have to match the supply of oil products. The likely path forward this summer is a steady draw down in jet fuel, diesel and gasoline. Higher prices for these. Then, if possible, higher refinery throughput and higher usage of crude in response to very profitable refinery margins. And lastly sharper draw in crude stocks and higher prices for these. But some 6 mb/d of oil products used to be exported through the Strait of Hormuz. And it may not be so easy to ramp up refinery activity across the world to compensate. Especially as Ukraine continues to damage Russian refineries as well as Russian crude production and export facilities.
Watch oil product stocks and prices as well as Brent calendar 2027. What to watch for this summer is thus oil product inventories falling and oil product premiums to crude rising. Another measure to watch is the Brent crude 2027 contract as it rises steadily day by day as the Strait of Hormuz stays closed and global oil inventories decline. The latter is close to the highest level since the start of the war and keeps rising.
The Brent M1 contract and the Brent 2027 prices and current price of jet fuel in Europe (ARA). All in USD/b

Our back of the envelope calculation of the global shortage created by the closure of the Strait of Hormuz. Note that 3.5 mb/d of discharge from SPR is also a draw. Note also that ’Forced demand loss’ of 2.5 mb/d is probably temporary and will fall back towards zero as logistics are sorted out leaving ’Price demand loss’ to do the job of balancing the market. Thus a shortfall of at least 9 mb/d created by the closure. More if SPR discharge is included and more if Forced demand loss recedes.

Brent is climbing higher. Front-month is at USD 106.3/bl this morning, close to a weekly high and a USD 9/bl jump from Mondays open. This is the move we flagged as a risk earlier in the week: the market shifting from ”a deal is around the corner” to ”this is going to take longer than we thought”.

Analyst Commodities, SEB
During April, rest-of-year Brent remained remarkably stable around USD 90/bl. A stability which rested on one single assumption: the SoH reopens around 1 May. That assumption is now slowly falling apart.
As we highlighted yesterday: every week of delay beyond 1 May adds (theoretically) ish USD 5/bl to the rest-of-year average, as global inventories draw 100 million barrels per week. i.e., a mid-May reopening implies rest-of-year Brent closer to USD 100/bl, and anything pushing into June or July takes us meaningfully higher.
What’s changed in the last 48 hours:
#1: The US military has formally warned that clearing suspected sea mines from SoH could take up to six months. That is a completely different timescale from what the financial market is pricing. Even a political deal tomorrow does not immediately reopen the strait.
#2: Trump has shifted his tone from urgency to ”strategic patience”. In yesterday’s press conference: ”Don’t rush me… I want a great deal.” The market is reading this as a president no longer feeling pressured by timelines, with the naval blockade running in the background.
#3: So far, the military activity is escalating, not de-escalating. Axios reports Iran is laying more mines in SoH. The US 3rd carrier strike group (USS George H.W. Bush) is arriving with two countermine vessels. Trump yesterday ordered the US Navy to destroy any Iranian boats caught laying mines. While CNN reports that the Pentagon is actively drawing up plans to strike Iranian SoH capabilities and individual Iranian military leaders if the ceasefire collapses. i.e., NOT a attitude consistent with an imminent deal!
Spot crude and product prices eased off the early-April highs on a combination of system rerouting and deal optimism. Both now weakening. Goldman estimates April Gulf output is reduced by 14.5 mbl/d, or 57% of pre-war supply, a number that keeps getting worse the longer this drags on.
Demand-side adaptation is ongoing: S. Korea has cut its Middle East crude dependence from 69% to 56% by pulling more from the Americas and Africa, and Japan is kicking off a second round of SPR releases from 1 May. But SPRs are finite.
Ref. to the negotiations, we should not bet on speed. The current Iranian leadership is dominated by genuine hardliners willing to absorb economic pain and run the clock to extract concessions. That is not a setup for a rapid resolution. US/Israeli media briefings keep framing the delay as ”internal Iranian divisions”, the reality is more complicated and points toward weeks and months, not days.
Our point is that the complexity is large, and higher prices have only just started (given a scenario where the negotiations drag out in time). The market spent April leaning on the USD 90/bl rest-of-year assumption; that case is diminishing by the hour. If ”early May reopening” is replaced by ”June, July or later” over the next week or two, both crude and products have meaningful room to reprice higher from here. There is a high risk being short energy and betting on any immediate political resolution(!).
Down on Friday. Up on Monday. The Brent June crude oil contract traded down 5.1% last week to a close of $90.38/b. It reached a high of $103.87/b last Monday and a low of $86.09/b on Friday as Iran announced that the Strait of Hormuz was fully open for transit. That quickly changed over the weekend as the US upheld its blockade of Iranian oil exports while Iran naturally responded by closing the SoH again. The US blew a hole in the engine room of the Iranian ship TOUSKA and took custody of the ship on Sunday. Brent crude is up 5.6% this morning to $95.4/b.
The cease-fire is expiring tomorrow. The US has said it will send a delegation for a second round of negotiations in Islamabad in Pakistan. But Iran has for now rejected a second round of talks as it views US demands as unrealistic and excessive while the US is also blocking the Strait of Hormuz.
While Brent is up 5% this morning, the financial market is still very optimistic that progress will be made. That talks will continue and that the SoH will fully open by the start of May which is consistent with a rest-of-year average Brent crude oil price of around $90/b with the market now trading that balance at around $88/b.
Financial optimism vs. physical deterioration. We have a divergence where the financial market is trading negotiations, improvements and resolution while at the same time the physical market is deteriorating day by day. Physical oil flows remain constrained by disrupted flows, longer voyage times and elevated freight and insurance costs.
Financial markets are betting that a US/Iranian resolution will save us in time from violent shortages down the road. But every day that the SoH remains closed is bringing us closer to a potentially very painful point of shortages and much higher prices.
The US blockade is also a weapon of leverage against its European and Asian allies. When Iran closed the SoH it held the world economy as a hostage against the US. The US blockade of the SoH is of course blocking Iranian oil exports. But it is also an action of disruption directed towards Europe and Asia. The US has called for the rest of the world to engaged in the war with Iran: ”If you want oil from the Persian Gulf, then go and get it”. A risk is that the US plays brinkmanship with the global oil market directed towards its European and Asian allies and maybe even towards China to force them to engage and take part. Maybe unthinkable. But unthinkable has become the norm with Trump in the White House.


Sommarväder skapar prisrally på elbörsen
Oil product price pain is set to rise as the Strait of Hormuz stays closed into summer

Solkraften pressar elpriserna dagtid

Michel Gubel ger sin syn på oljemarknaden