

Analys
SHB Råvarukommentar 19 februari 2016

 OLJA
OLJA
Brentoljan ser ut att sluta veckan i princip oförändrad, vilket dock döljer stor volatilitet i spåren av avtalet om att frysa produktionen. En uppgörelse mellan Saudiarabien, Ryssland, Venezuela och Qatar fick priset att stiga med 7% i onsdags. Vi bedömer att den prisuppgång som skett är en riskpremie för att Iran eller Irak ansluter sig. Saudiarabien fryser sin produktion på rekordnivåer men kungadömet konsumerar säsongsmässigt mer olja för kylbehov under sommaren och därmed finns det en risk att exporten blir något mindre under sommarmånaderna med avtalet på plats. Det kan dock komma att kompenseras av lägre konsumtion i spåren av budgetunderskott och senaste nedskärningarna på subventioner i el, vatten och petroleum.
Även Ryssland fryser på rekordnivåer men Ryssland har inte förutsättningar att öka produktionen under sanktionerna. Bibehållen produktion vore en positiv överraskning. Med budgetunderskott tror vi att fallande produktion ändå kan leda till stigande export, till priset av minskad inhemsk konsumtion.Qatar har relativt liten oljeproduktion, men är världens största exportör av naturgas som prisas mot olja. Qatar vill därför alltid medverka i prisstärkande aktiviteter på olja då inkomstbortfallet kompenseras flerfaldigat i högre pris på naturgasexporten. För Iran är det otänkbart att frysa produktionen då landet har ambitioner att återta sin förlorade marknad under sanktionerna men självklart kommer landet uttala sig positivt till att andra fryser.
Irak har relativt stora planer på att expandera produktionen i år. Projekten är redan upphandlade och under utbyggnad vilket gör att de inte går att avbryta. Att minska befintlig produktion samtidigt som man bygger ut ny verkar inte rimligt. Irak har också varit undantaget OPEC:s produktionskvot, när den fanns, för att kunna återuppbygga produktionen efter USA invasionen 2003.
Sammantaget tycker vi inte att avtalet har någon större innebörd och ser en risk att riskpremien från att Iran eller Irak ska ansluta sig till avtalet pyser ut nästa vecka. En viss riskpremie ser vi dock som motiverad av att Ryssland faktiskt slutit avtal med OPEC.
EL
Elpriset som fallit kraftigt under inledningen av året, -17 procent för Q216, vände denna vecka upp med närmare 2 euro till 16.50. Kallare väderutsikter framöver i kombination med stigande pris på tysk baskraft samt fossila bränslen är det som främst drivit uppgången. Även om de fossila bränslena fått stöd av den lite bredare uppgången befinner sig dock både kolet och gasen i en stark nedåtgående trend, kol har fallit 68% sedan toppen 2011 och gaspriset har nästan halverats. Svårt att se att någon av dessa faktorer kan generera någon större uppgång och inte heller från den hydrologiska balansen som visar på närmare 10 TWh överskott, men med stöd från en del ”bargain hunting” kan elpriset stiga ytterligare någon från dessa förhållandevis låga nivåer.
Guld
Guldpriset har fallit något under veckan när börsen rusat men har fortfarande stigit över 15% under 2016. Amerikanska centralbanken har tagit notis om senaste marknadsoron och marknaden har nu helt tappat tron på fler räntehöjningar det här året. Ytterligare räntehöjningar från Fed kan bromsa en uppgång för guldpriset, så en mindre hökaktig amerikansk centralbank är positivt.
Vi är fortsatt positiva på guld i den finansiellt oroliga miljö vi har, och guldet har i år stigit på egna meriter, inte enbart på en dollarförsvagning.
Basmetaller
Basmetaller har stigit över veckan, främst nickel som är upp med 7%. Huvudsakligen drivit av en omvändning i sentimentet kring råvaror men också förhoppningar om mer stimulanser i Kina efter svag makrodata.
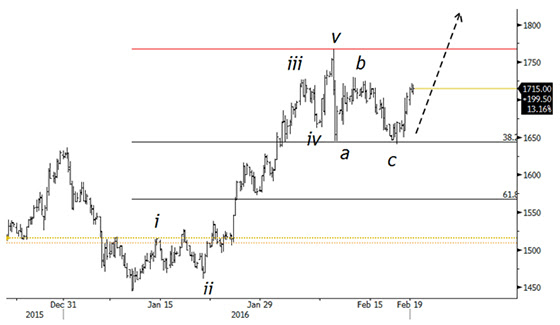
Teknisk analys: Zink
Zink började året med en större uppgång från 1450-nivån. Den första uppgångsfasen ser ut att vara avslutad vid 1767, varefter zink har rekylerat. Rekylen stannade vid 38% rekyl av uppgången, en relativt vanlig fibonaccinivå. Detta skulle kunna innebära att rekylen ner är färdig och att zink kan vara på gång att göra en ny uppgångsfas. Ett vanligt samband för uppgångarna är att vi får en lika lång upprörelse som vi redan sett, vilket i det här fallet skulle innebära ett möjligt mål runt 1960 USD per ton.
Ett möjligt problem med detta scenario är att den första rekylen på en uppgång ofta är mer än 38%, det är vanligare med 50% eller 62% rekyl. Detta skulle kunna innebära att idén att zink har mer uppsidepotential är korrekt, men att rekylen ner på den första uppgången inte är färdig. Dock var många av rekylerna uppåt i zinks tidigare nedgång också av ganska beskedlig magnitud, vilket skulle kunna vara ett argument för att det kanske räcker med den rekyl vi har sett.
Utifrån ett tekniskt perspektiv anser vi zink köpvärd kring dagens nivå vid 1640 USD per ton, med en stopploss under den senaste botten vid 1640 USD med ett mål runt 1960 USD om uppgångsscenariot är korrekt.
LME Zink, 4 timmarsgraf
[box]SHB Råvarukommentar är producerat av Handelsbanken och publiceras i samarbete och med tillstånd på Råvarumarknaden.se[/box]
Ansvarsbegränsning
Detta material är producerat av Svenska Handelsbanken AB (publ) i fortsättningen kallad Handelsbanken. De som arbetar med innehållet är inte analytiker och materialet är inte oberoende investeringsanalys. Innehållet är uteslutande avsett för kunder i Sverige. Syftet är att ge en allmän information till Handelsbankens kunder och utgör inte ett personligt investeringsråd eller en personlig rekommendation. Informationen ska inte ensamt utgöra underlag för investeringsbeslut. Kunder bör inhämta råd från sina rådgivare och basera sina investeringsbeslut utifrån egen erfarenhet.
Informationen i materialet kan ändras och också avvika från de åsikter som uttrycks i oberoende investeringsanalyser från Handelsbanken. Informationen grundar sig på allmänt tillgänglig information och är hämtad från källor som bedöms som tillförlitliga, men riktigheten kan inte garanteras och informationen kan vara ofullständig eller nedkortad. Ingen del av förslaget får reproduceras eller distribueras till någon annan person utan att Handelsbanken dessförinnan lämnat sitt skriftliga medgivande. Handelsbanken ansvarar inte för att materialet används på ett sätt som strider mot förbudet mot vidarebefordran eller offentliggörs i strid med bankens regler.


Some rebound but not much. Brent crude rebounded 1.5% yesterday to $65.47/b. This morning it is inching 0.2% up to $65.6/b. The lowest close last week was on Thursday at $64.11/b.

The curve structure is almost as week as it was before the weekend. The rebound we now have gotten post the message from OPEC+ over the weekend is to a large degree a rebound along the curve rather than much strengthening at the front-end of the curve. That part of the curve structure is almost as weak as it was last Thursday.
We are still on a weakening path. The message from OPEC+ over the weekend was we are still on a weakening path with rising supply from the group. It is just not as rapidly weakening as was feared ahead of the weekend when a quota hike of 500 kb/d/mth for November was discussed.
The Brent curve is on its way to full contango with Brent dipping into the $50ies/b. Thus the ongoing weakening we have had in the crude curve since the start of the year, and especially since early June, will continue until the Brent crude oil forward curve is in full contango along with visibly rising US and OECD oil inventories. The front-month Brent contract will then flip down towards the $60/b-line and below into the $50ies/b.
At what point will OPEC+ turn to cuts? The big question then becomes: When will OPEC+ turn around to make some cuts? At what (price) point will they choose to stabilize the market? Because for sure they will. Higher oil inventories, some more shedding of drilling rigs in US shale and Brent into the 50ies somewhere is probably where the group will step in.
There is nothing we have seen from the group so far which indicates that they will close their eyes, let the world drown in oil and the oil price crash to $40/b or below.
The message from OPEC+ is also about balance and stability. The world won’t drown in oil in 2026. The message from the group as far as we manage to interpret it is twofold: 1) Taking back market share which requires a lower price for non-OPEC+ to back off a bit, and 2) Oil market stability and balance. It is not just about 1. Thus fretting about how we are all going to drown in oil in 2026 is totally off the mark by just focusing on point 1.
When to buy cal 2026? Before Christmas when Brent hits $55/b and before OPEC+ holds its last meeting of the year which is likely to be in early December.
Brent crude oil prices have rebounded a bit along the forward curve. Not much strengthening in the structure of the curve. The front-end backwardation is not much stronger today than on its weakest level so far this year which was on Thursday last week.

The front-end backwardation fell to its weakest level so far this year on Thursday last week. A slight pickup yesterday and today, but still very close to the weakest year to date. More oil from OPEC+ in the coming months and softer demand and rising inventories. We are heading for yet softer levels.

Down to the lowest since early May. Brent crude has fallen sharply the latest four days. It closed at USD 64.11/b yesterday which is the lowest since early May. It is staging a 1.3% rebound this morning along with gains in both equities and industrial metals with an added touch of support from a softer USD on top.
What stands out the most to us this week is the collapse in the Dubai one to three months time-spread.
Dubai is medium sour crude. OPEC+ is in general medium sour crude production. Asian refineries are predominantly designed to process medium sour crude. So Dubai is the real measure of the balance between OPEC+ holding back or not versus Asian oil demand for consumption and stock building.
A sharp weakening of the front-end of the Dubai curve. The front-end of the Dubai crude curve has been holding out very solidly throughout this summer while the front-end of the Brent and WTI curves have been steadily softening. But the strength in the Dubai curve in our view was carrying the crude oil market in general. A source of strength in the crude oil market. The core of the strength.
The now finally sharp decline of the front-end of the Dubai crude curve is thus a strong shift. Weakness in the Dubai crude marker is weakness in the core of the oil market. The core which has helped to hold the oil market elevated.
Facts supports the weakening. Add in facts of Iraq lifting production from Kurdistan through Turkey. Saudi Arabia lifting production to 10 mb/d in September (normal production level) and lifting exports as well as domestic demand for oil for power for air con is fading along with summer heat. Add also in counter seasonal rise in US crude and product stocks last week. US oil stocks usually decline by 1.3 mb/week this time of year. Last week they instead rose 6.4 mb/week (+7.2 mb if including SPR). Total US commercial oil stocks are now only 2.1 mb below the 2015-19 seasonal average. US oil stocks normally decline from now to Christmas. If they instead continue to rise, then it will be strongly counter seasonal rise and will create a very strong bearish pressure on oil prices.
Will OPEC+ lift its voluntary quotas by zero, 137 kb/d, 500 kb/d or 1.5 mb/d? On Sunday of course OPEC+ will decide on how much to unwind of the remaining 1.5 mb/d of voluntary quotas for November. Will it be 137 kb/d yet again as for October? Will it be 500 kb/d as was talked about earlier this week? Or will it be a full unwind in one go of 1.5 mb/d? We think most likely now it will be at least 500 kb/d and possibly a full unwind. We discussed this in a not earlier this week: ”500 kb/d of voluntary quotas in October. But a full unwind of 1.5 mb/d”
The strength in the front-end of the Dubai curve held out through summer while Brent and WTI curve structures weakened steadily. That core strength helped to keep flat crude oil prices elevated close to the 70-line. Now also the Dubai curve has given in.

Brent crude oil forward curves

Total US commercial stocks now close to normal. Counter seasonal rise last week. Rest of year?

Total US crude and product stocks on a steady trend higher.

Analys
OPEC+ will likely unwind 500 kb/d of voluntary quotas in October. But a full unwind of 1.5 mb/d in one go could be in the cards
Down to mid-60ies as Iraq lifts production while Saudi may be tired of voluntary cut frugality. The Brent December contract dropped 1.6% yesterday to USD 66.03/b. This morning it is down another 0.3% to USD 65.8/b. The drop in the price came on the back of the combined news that Iraq has resumed 190 kb/d of production in Kurdistan with exports through Turkey while OPEC+ delegates send signals that the group will unwind the remaining 1.65 mb/d (less the 137 kb/d in October) of voluntary cuts at a pace of 500 kb/d per month pace.
Signals of accelerated unwind and Iraqi increase may be connected. Russia, Kazakhstan and Iraq were main offenders versus the voluntary quotas they had agreed to follow. Russia had a production ’debt’ (cumulative overproduction versus quota) of close to 90 mb in March this year while Kazakhstan had a ’debt’ of about 60 mb and the same for Iraq. This apparently made Saudi Arabia angry this spring. Why should Saudi Arabia hold back if the other voluntary cutters were just freeriding? Thus the sudden rapid unwinding of voluntary cuts. That is at least one angle of explanations for the accelerated unwinding.
If the offenders with production debts then refrained from lifting production as the voluntary cuts were rapidly unwinded, then they could ’pay back’ their ’debts’ as they would under-produce versus the new and steadily higher quotas.
Forget about Kazakhstan. Its production was just too far above the quotas with no hope that the country would hold back production due to cross-ownership of oil assets by international oil companies. But Russia and Iraq should be able to do it.
Iraqi cumulative overproduction versus quotas could reach 85-90 mb in October. Iraq has however steadily continued to overproduce by 3-5 mb per month. In July its new and gradually higher quota came close to equal with a cumulative overproduction of only 0.6 mb that month. In August again however its production had an overshoot of 100 kb/d or 3.1 mb for the month. Its cumulative production debt had then risen to close to 80 mb. We don’t know for September yet. But looking at October we now know that its production will likely average close to 4.5 mb/d due to the revival of 190 kb/d of production in Kurdistan. Its quota however will only be 4.24 mb/d. Its overproduction in October will thus likely be around 250 kb/d above its quota with its production debt rising another 7-8 mb to a total of close to 90 mb.
Again, why should Saudi Arabia be frugal while Iraq is freeriding. Better to get rid of the voluntary quotas as quickly as possible and then start all over with clean sheets.
Unwinding the remaining 1.513 mb/d in one go in October? If OPEC+ unwinds the remaining 1.513 mb/d of voluntary cuts in one big go in October, then Iraq’s quota will be around 4.4 mb/d for October versus its likely production of close to 4.5 mb/d for the coming month..
OPEC+ should thus unwind the remaining 1.513 mb/d (1.65 – 0.137 mb/d) in one go for October in order for the quota of Iraq to be able to keep track with Iraq’s actual production increase.
October 5 will show how it plays out. But a quota unwind of at least 500 kb/d for Oct seems likely. An overall increase of at least 500 kb/d in the voluntary quota for October looks likely. But it could be the whole 1.513 mb/d in one go. If the increase in the quota is ’only’ 500 kb/d then Iraqi cumulative production will still rise by 5.7 mb to a total of 85 mb in October.
Iraqi production debt versus quotas will likely rise by 5.7 mb in October if OPEC+ only lifts the overall quota by 500 kb/d in October. Here assuming historical production debt did not rise in September. That Iraq lifts its production by 190 kb/d in October to 4.47 mb/d (August level + 190 kb/d) and that OPEC+ unwinds 500 kb/d of the remining quotas in October when they decide on this on 5 October.


Samtal om sällsynta jordartsmetaller, guld och silver

Brookfield köper bränsleceller för 5 miljarder USD av Bloom Energy för att driva AI-datacenter

Teck Resources kan förse Nordamerika och kanske hela G7 med all germanium som behövs

Leading Edge Materials är på rätt plats i rätt tid

Oljepriset faller efter ny handelskonflikt mellan USA och Kina

Kinas elproduktion slog nytt rekord i augusti, vilket även kolkraft gjorde

Tyskland har så höga elpriser att företag inte har råd att använda elektricitet

OPEC+ missar produktionsmål, stöder oljepriserna

Ett samtal om guld, olja, fjärrvärme och förnybar energi
Brent crude ticks higher on tension, but market structure stays soft
-
 Nyheter4 veckor sedan
Kinas elproduktion slog nytt rekord i augusti, vilket även kolkraft gjorde
-
Nyheter4 veckor sedan
Tyskland har så höga elpriser att företag inte har råd att använda elektricitet
-
 Nyheter3 veckor sedan
OPEC+ missar produktionsmål, stöder oljepriserna
-
 Nyheter3 veckor sedan
Ett samtal om guld, olja, fjärrvärme och förnybar energi
-
Analys4 veckor sedan
Brent crude ticks higher on tension, but market structure stays soft
-
Analys3 veckor sedan
Are Ukraine’s attacks on Russian energy infrastructure working?
-

 Nyheter2 veckor sedan
Guld nära 4000 USD och silver 50 USD, därför kan de fortsätta stiga
-

 Nyheter3 veckor sedan
Guldpriset uppe på nya höjder, nu 3750 USD