

Analys
SHB Råvarubrevet 6 september 2013

 Råvaror allmänt
Man petar inte på en skallerom
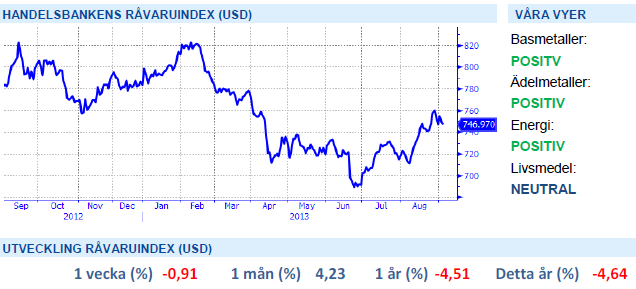
Risktillgångar har drabbats av viss tillbakagång under veckan när en amerikansk attack mot Syrien har blivit allt mer uppenbar. Vi gästades av FOI:s analytiker som menar att sannolikheten för en attack från Obama nu är mer än 80 %. Antingen dödar man en skallerorm eller så låter man den vara i fred; man petar inte på den. Har Obama gett sig in i argumentationen med Syrien så kommer han sannolikt att löpa hela linan ut. Den geopolitiska spänningen ökar riskpremien i olja men verkar dämpande på de flesta andra råvaror.
Globalt fortsätter makrodata att vittna om en förbättring. Veckan startade med ett bättre än väntat inköpschefsindex från Kina och slutar med bra inköpschefsindex (PMI) och arbetsmarknadsdata (jobless claims) från USA. Vårt tema med en marknad som drivs av robust makrodata håller alltså i sig, och vi tror att det fortgår några månader till. Mycket av den bra makrodatan verkar dock redan vara inprisad i många tillgångslag givet hur börsen och räntemarknaden betett sig senaste tiden. Stundande oro för råvarumarknaden är Fed:s ”tapering” som väntas tillkännages under septembermötet den 18/9. Mycket av detta torde dock vara inprisat i dagens marknad och vi fortsätter därför tro att stark makrodata får råvarorna att stiga framöver.
Basmetaller
Kina överraskar positivt
I söndags publicerades Kinas PMI med positivt resultat, 51 mot väntade 50,6, och gav basmetallerna skjuts uppåt initialt. Efter att en attack mot Syrien blir mer sannolik har dock risktillgångar som basmetaller fallit tillbaka något under veckan. Tenn har haft ett kraftigt uppsving under veckan efter exportbegränsningar från Indonesien, värdens störta exportör. Indonesien har i sin ambition att öka de inhemska smältlönerna stoppat exporten av tenn. Dels höjer man den för export godkända halten samtidigt som man försöker stimulera den lokala handeln och landets möjligheter att behålla ett större värde av landets värdefulla naturtillgångar. Detta har tvingat PT Timah, världens tredje största producent, att åberopa force majeure sedan den 30 augusti. Låga lager och inställda leveranser från Indonesien har skickat upp priset på tenn till fem månaders högsta och har under veckan stigit med dryga 6,2 %.
Under första halvan av året har utvecklingen på basmetaller och aktiemarknaden gått ordentligt isär, bilden nedan visar utvecklingen på Handelsbankens Basmetallindex mot S&P 500 sedan 2007. Även om amerikansk och europeisk makro signalerat återhämtning under en tid, verkar den kinesiska ekonomin varit i kontraktion fram till juli/augusti i år vilket pressat efterfrågan och priserna på metaller. De senaste veckorna har vi dock sett tecken på att den kinesiska tillväxten kan ta fart igen där några fundamentala rörelser är intressanta att notera, framför allt på koppar. Kinas kopparimport har återigen ökat och såväl inhemska som globala lager har minskat samtidigt som investerare täckt sina korta positioner. När den värsta oron för ett överutbud nu avtagit samtidigt som lagren minskar anser vi att metallpriserna bör ha bottnat ur under Q2 2013 och att en ökande efterfrågan bör resultera i högre metallpriser överlag under hösten.
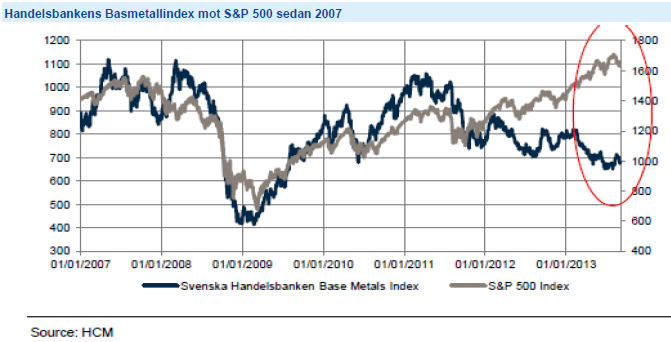
Kinas kopparimport har återigen ökat och såväl inhemska som globala lager har minskat samtidigt som investerare täckt sina korta positioner. Vi tror på: LONG KOPPAR
Ädelmetaller
På guldfronten intet nytt!
Efter dagens rykande färska arbetslöshetsstatistik från USA, nonfarm payrolls som kom in något sämre än väntat, handlar guldet på 1390 dollar per uns, att jämföra med förra fredagens 1390 dollar per uns… Veckan har präglats av små rörselser i brist på nya nyheter i Syrienfrågan och i linje med en avvaktande hållning på de flesta marknaderna. Vi bibehåller vår positiva syn på guldet i det kortare perspektivet, och vår negativa syn i det längre perspektivet. Platina har tappat marginellt under veckan som gått.
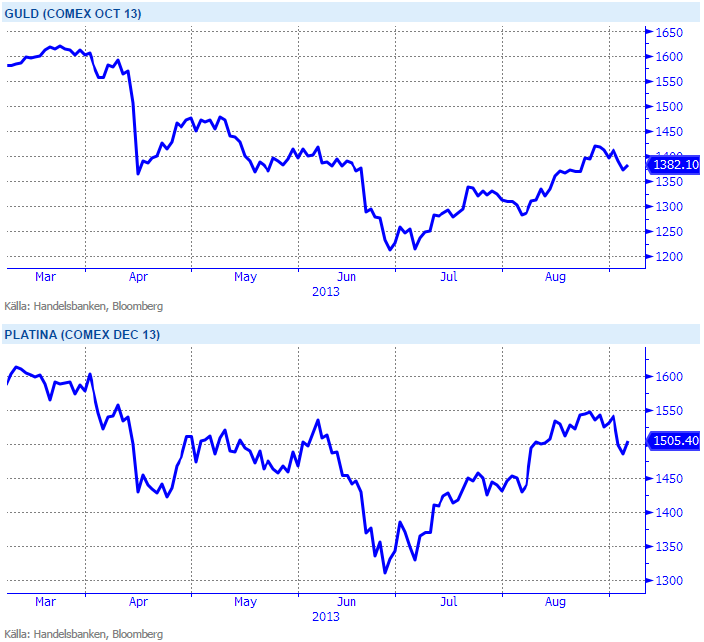
I ett läge där råvaror generellt har viktats ned av institutionella placerare kan guld och silver få en ”omotiverad” uppgång när dessa indexköpare återvänder till råvaror drivit av bättre utsikter för Kina och USA. Vi tror på: LONG GULD H och LONG SILVER H
Energi
Fortsatt Syrienattack i fokus
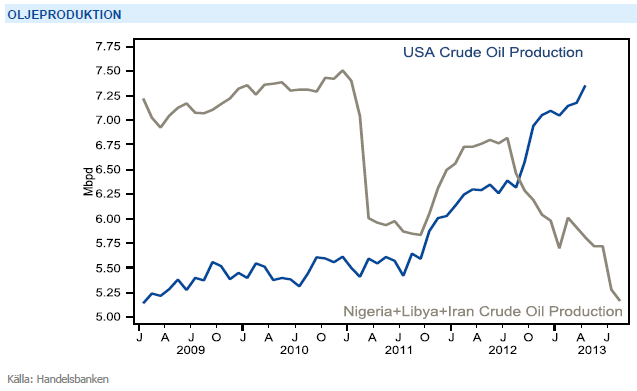
Oljan ligger kvar på höga nivåer där oron för utbudsstörningar i Mellanöstern och sannolikheten att att USA slår tillbaka på al-Assad regimen kvarstår. Buy the rumour sell the fact brukar ju vara en gyllene regel där vi tidigare sett riskpremien pysa ut ganska hastigt efter både Libyen- och Irankonflikten. Även om så sker efter en eventuell intervention, ser vi flera faktorer som kan skrämma upp oljepriset ytterligare. Den globala reservkapaciteten är endast 1.3 miljoner fat per dag och vi ställer oss frågande till om Saudiarabien, som redan idag producerar på rekordnivå, verkligen kan täcka upp för det kraftiga produktionsbortfallet från Nigeria, Libyen och Iran (se bilden nedan). Även Irak har minskat sin produktion de senaste 12 månaderna och denna osäkerhet anser vi väl motiverar nuvarande riskpremie. Lägg därtill positiv amerikansk makrostatistik vilket i kombination med vikande råoljelager för nionde veckan i rad bör skapa en hel del rörelser på uppsidan. Vår rekommendation om lång position kvartsår.
Elmarknaden och kvartalet Q1 2014 (som nu är underliggande för Handelsbankens elindex och investeringsprodukter) stiger med närmare 6 procent denna vecka. Uppgången inleddes med att Oskarshamnsverket 3 oväntat föll ur drift förra helgen vilket resulterade i att svenska kärnkraften föll tillbaka på 58 procents output. Det torra scenario vi såg mot slutet av förra veckan låg kvar över helgen vilket genererade en hel del köpintresse. Vidare har såväl bränslekomplex, utsläppsrätter och Tyska marknaden där vi sett en del shortcovering stärkts vilket gjort att vi tagit oss igenom tidigare motståndsnivåer. Vädret spelar till stor del in och begränsar nedsidan på de två kommande kvartalskontrakten. Senaste väderprognoserna pekar på ett kraftigt underskott i nederbörden de kommande 10-dagarna vilket i skrivande stund ser ut att försämra energibalansen med 5-6 TWh ned till -13 TWh. Vi ligger därför kvar med lång rekommendation.
Oroligheterna i mellanöstern med risk för ytterligare produktionsbortfall ger stöd till oljepriset. Vi tror på: LONG OLJA
Livsmedel
Goda skördar pressar rispriset
Spannmålspriserna har den senaste tiden påverkats i hög grad av väderutvecklingen i USA. Majsen, men främst sojan som inte kommit lika långt i sin utveckling, har påverkats negativt av torrt och varmt väder och risken för nedjusteringar av kommande skörd har ökat. Väderprognoserna har varierat en del och priserna likaså – regn i sikte har pressat ned prisnivån något men nya prognoser om åter minskad nederbörd har lätt skapat ett uppsving igen.
Kakao tillhör den råvara i vårt livsmedelindex som gått bäst sedan årsskiftet. SHB Cocoa har gått upp drygt 8,5 procent som följd av bl.a. torrt väder och minskad skörd i Afrikas västkust. Under veckan har kakaopriset fått ytterligare stöd och nådde 11-månaders högsta efter nya väderrapporter som visat på halverat skyfall för de senaste 30 dagarna jämfört med ett normalår.
En annan mjuk råvara som haft ett volatilt år är ris. Underliggande terminen till SHB Rice är Rough Rice som handlas på Chicago börsen och där ett kontrakt motsvarar 2000 CWT (ca 90 kg). De globala lagren på ris väntas stiga till 107,47 miljoner ton för säsong 2013-14 – vilket är i så fall den högsta siffran på 12 år. Förväntningarna på den kommande globala risproduktionen för säsong 2013-14 visar på en ökning med 1,9 procent från tidigare säsong, enligt den senaste rapporten från amerikanska jordbruksdepartementet. Förhållandet mellan utgående lager i förhållande till årlig konsumtion är 22,6 procent. Den höga siffran visar på välfyllda rislager för säsongen varför vi tror på fallande priser.
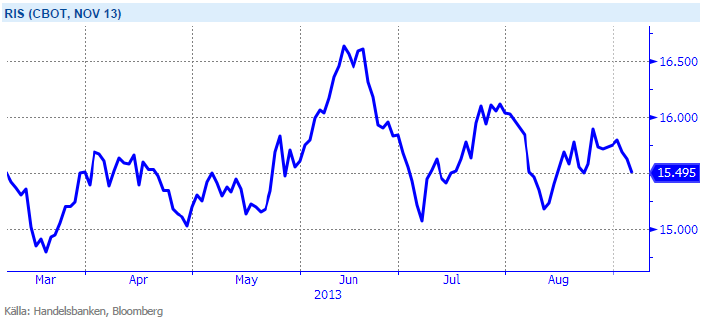
Förväntningar på den kommande risproduktionen är stor och prognoser visar på välfyllda lager. Vi tror på: SHORT RIS
Handelsbankens Råvaruindex
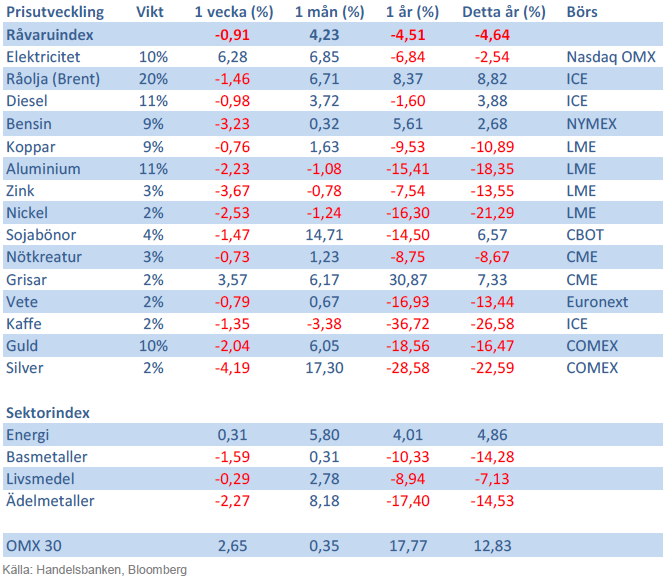
Handelsbankens råvaruindex består av de underliggande indexen för respektive råvara. Vikterna är bestämda till hälften från värdet av nordisk produktion (globala produktionen för sektorindex) och till hälften från likviditeten i terminskontrakten.
[box]SHB Råvarubrevet är producerat av Handelsbanken och publiceras i samarbete och med tillstånd på Råvarumarknaden.se[/box]
Ansvarsbegränsning
Detta material är producerat av Svenska Handelsbanken AB (publ) i fortsättningen kallad Handelsbanken. De som arbetar med innehållet är inte analytiker och materialet är inte oberoende investeringsanalys. Innehållet är uteslutande avsett för kunder i Sverige. Syftet är att ge en allmän information till Handelsbankens kunder och utgör inte ett personligt investeringsråd eller en personlig rekommendation. Informationen ska inte ensamt utgöra underlag för investeringsbeslut. Kunder bör inhämta råd från sina rådgivare och basera sina investeringsbeslut utifrån egen erfarenhet.
Informationen i materialet kan ändras och också avvika från de åsikter som uttrycks i oberoende investeringsanalyser från Handelsbanken. Informationen grundar sig på allmänt tillgänglig information och är hämtad från källor som bedöms som tillförlitliga, men riktigheten kan inte garanteras och informationen kan vara ofullständig eller nedkortad. Ingen del av förslaget får reproduceras eller distribueras till någon annan person utan att Handelsbanken dessförinnan lämnat sitt skriftliga medgivande. Handelsbanken ansvarar inte för att materialet används på ett sätt som strider mot förbudet mot vidarebefordran eller offentliggörs i strid med bankens regler.


When it starts to move lower it moves rather quickly. Gaza, China, IEA. Brent crude is down 2.1% today to $62/b after having traded as high as $66.58/b last Thursday and above $70/b in late September. The sell-off follows the truce/peace in Gaze, a flareup in US-China trade and yet another bearish oil outlook from the IEA.

A lasting peace in Gaze could drive crude oil at sea to onshore stocks. A lasting peace in Gaza would probably calm down the Houthis and thus allow more normal shipments of crude oil to sail through the Suez Canal, the Red Sea and out through the Bab-el-Mandeb Strait. Crude oil at sea has risen from 48 mb in April to now 91 mb versus a pre-Covid normal of about 50-60 mb. The rise to 91 mb is probably the result of crude sailing around Africa to be shot to pieces by the Houthis. If sailings were to normalize through the Suez Canal, then it could free up some 40 mb in transit at sea moving onshore into stocks.
The US-China trade conflict is of course bearish for demand if it continues.
Bearish IEA yet again. Getting closer to 2026. Credibility rises. We expect OPEC to cut end of 2025. The bearish monthly report from the IEA is what it is, but the closer we get to 2026, the more likely the IEA is of being ball-park right in its outlook. In its monthly report today the IEA estimates that the need for crude oil from OPEC in 2026 will be 25.4 mb/d versus production by the group in September of 29.1 mb/d. The group thus needs to do some serious cutting at the end of 2025 if it wants to keep the market balanced and avoid inventories from skyrocketing. Given that IEA is correct that is. We do however expect OPEC to implement cuts to avoid a large increase in inventories in Q1-26. The group will probably revert to cuts either at its early December meeting when they discuss production for January or in early January when they discuss production for February. The oil price will likely head yet lower until the group reverts to cuts.
Dubai: The Mid-East anchor dragging crude oil lower. Surplus emerging in Mid-East pricing. Crude oil prices held surprisingly strong all through the summer. A sign and a key source of that strength came from the strength in the front-end backwardation of the Dubai crude oil curve. It held out strong from mid-June and all until late September with an average 1-3mth time-spread premium of $1.8/b from mid-June to end of September. The 1-3mth time-spreads for Brent and WTI however were in steady deterioration from late June while their flat prices probably were held up by the strength coming from the Persian Gulf. Then in late September the strength in the Dubai curve suddenly collapsed. Since the start of October it has been weaker than both the Brent and the WTI curves. The Dubai 1-3mth time-spread now only stands at $0.25/b. The Middle East is now exporting more as it is producing more and also consuming less following elevated summer crude burn for power (Aircon) etc.
The only bear-element missing is a sudden and solid rise in OECD stocks. The only thing that is missing for the bear-case everyone have been waiting for is a solid, visible rise in OECD stocks in general and US oil stocks specifically. So watch out for US API indications tomorrow and official US oil inventories on Thursday.
No sign of any kind of fire-sale of oil from Saudi Arabia yet. To what we can see, Saudi Arabia is not at all struggling to sell its oil. It only lowered its Official Selling Prices (OSPs) to Asia marginally for November. A surplus market + Saudi determination to sell its oil to the market would normally lead to a sharp lowering of Saudi OSPs to Asia. Not yet at least and not for November.
The 5yr contract close to fixed at $68/b. Of importance with respect to how far down oil can/will go. When the oil market moves into a surplus then the spot price starts to trade in a large discount to the 5yr contract. Typically $10-15/b below the 5yr contract on average in bear-years (2009, 2015, 2016, 2020). But the 5yr contract is usually pulled lower as well thus making this approach a moving target. But the 5yr contract price has now been rock solidly been pegged to $68/b since 2022. And in the 2022 bull-year (Brent spot average $99/b), the 5yr contract only went to $72/b on average. If we assume that the same goes for the downside and that 2026 is a bear-year then the 5yr goes to $64/b while the spot is trading at a $10-15/b discount to that. That would imply an average spot price next year of $49-54/b. But that is if OPEC doesn’t revert to cuts and instead keeps production flowing. We think OPEC(+) will trim/cut production as needed into 2026 to prevent a huge build-up in global oil stocks and a crash in prices. But for now we are still heading lower. Into the $50ies/b.
Some rebound but not much. Brent crude rebounded 1.5% yesterday to $65.47/b. This morning it is inching 0.2% up to $65.6/b. The lowest close last week was on Thursday at $64.11/b.
The curve structure is almost as week as it was before the weekend. The rebound we now have gotten post the message from OPEC+ over the weekend is to a large degree a rebound along the curve rather than much strengthening at the front-end of the curve. That part of the curve structure is almost as weak as it was last Thursday.
We are still on a weakening path. The message from OPEC+ over the weekend was we are still on a weakening path with rising supply from the group. It is just not as rapidly weakening as was feared ahead of the weekend when a quota hike of 500 kb/d/mth for November was discussed.
The Brent curve is on its way to full contango with Brent dipping into the $50ies/b. Thus the ongoing weakening we have had in the crude curve since the start of the year, and especially since early June, will continue until the Brent crude oil forward curve is in full contango along with visibly rising US and OECD oil inventories. The front-month Brent contract will then flip down towards the $60/b-line and below into the $50ies/b.
At what point will OPEC+ turn to cuts? The big question then becomes: When will OPEC+ turn around to make some cuts? At what (price) point will they choose to stabilize the market? Because for sure they will. Higher oil inventories, some more shedding of drilling rigs in US shale and Brent into the 50ies somewhere is probably where the group will step in.
There is nothing we have seen from the group so far which indicates that they will close their eyes, let the world drown in oil and the oil price crash to $40/b or below.
The message from OPEC+ is also about balance and stability. The world won’t drown in oil in 2026. The message from the group as far as we manage to interpret it is twofold: 1) Taking back market share which requires a lower price for non-OPEC+ to back off a bit, and 2) Oil market stability and balance. It is not just about 1. Thus fretting about how we are all going to drown in oil in 2026 is totally off the mark by just focusing on point 1.
When to buy cal 2026? Before Christmas when Brent hits $55/b and before OPEC+ holds its last meeting of the year which is likely to be in early December.
Brent crude oil prices have rebounded a bit along the forward curve. Not much strengthening in the structure of the curve. The front-end backwardation is not much stronger today than on its weakest level so far this year which was on Thursday last week.

The front-end backwardation fell to its weakest level so far this year on Thursday last week. A slight pickup yesterday and today, but still very close to the weakest year to date. More oil from OPEC+ in the coming months and softer demand and rising inventories. We are heading for yet softer levels.

Down to the lowest since early May. Brent crude has fallen sharply the latest four days. It closed at USD 64.11/b yesterday which is the lowest since early May. It is staging a 1.3% rebound this morning along with gains in both equities and industrial metals with an added touch of support from a softer USD on top.
What stands out the most to us this week is the collapse in the Dubai one to three months time-spread.
Dubai is medium sour crude. OPEC+ is in general medium sour crude production. Asian refineries are predominantly designed to process medium sour crude. So Dubai is the real measure of the balance between OPEC+ holding back or not versus Asian oil demand for consumption and stock building.
A sharp weakening of the front-end of the Dubai curve. The front-end of the Dubai crude curve has been holding out very solidly throughout this summer while the front-end of the Brent and WTI curves have been steadily softening. But the strength in the Dubai curve in our view was carrying the crude oil market in general. A source of strength in the crude oil market. The core of the strength.
The now finally sharp decline of the front-end of the Dubai crude curve is thus a strong shift. Weakness in the Dubai crude marker is weakness in the core of the oil market. The core which has helped to hold the oil market elevated.
Facts supports the weakening. Add in facts of Iraq lifting production from Kurdistan through Turkey. Saudi Arabia lifting production to 10 mb/d in September (normal production level) and lifting exports as well as domestic demand for oil for power for air con is fading along with summer heat. Add also in counter seasonal rise in US crude and product stocks last week. US oil stocks usually decline by 1.3 mb/week this time of year. Last week they instead rose 6.4 mb/week (+7.2 mb if including SPR). Total US commercial oil stocks are now only 2.1 mb below the 2015-19 seasonal average. US oil stocks normally decline from now to Christmas. If they instead continue to rise, then it will be strongly counter seasonal rise and will create a very strong bearish pressure on oil prices.
Will OPEC+ lift its voluntary quotas by zero, 137 kb/d, 500 kb/d or 1.5 mb/d? On Sunday of course OPEC+ will decide on how much to unwind of the remaining 1.5 mb/d of voluntary quotas for November. Will it be 137 kb/d yet again as for October? Will it be 500 kb/d as was talked about earlier this week? Or will it be a full unwind in one go of 1.5 mb/d? We think most likely now it will be at least 500 kb/d and possibly a full unwind. We discussed this in a not earlier this week: ”500 kb/d of voluntary quotas in October. But a full unwind of 1.5 mb/d”
The strength in the front-end of the Dubai curve held out through summer while Brent and WTI curve structures weakened steadily. That core strength helped to keep flat crude oil prices elevated close to the 70-line. Now also the Dubai curve has given in.

Brent crude oil forward curves

Total US commercial stocks now close to normal. Counter seasonal rise last week. Rest of year?

Total US crude and product stocks on a steady trend higher.


Guld och silver stiger hela tiden mot nya höjder
The Mid-East anchor dragging crude oil lower

Samtal om sällsynta jordartsmetaller, guld och silver

Brookfield köper bränsleceller för 5 miljarder USD av Bloom Energy för att driva AI-datacenter

Teck Resources kan förse Nordamerika och kanske hela G7 med all germanium som behövs

Tyskland har så höga elpriser att företag inte har råd att använda elektricitet

OPEC+ missar produktionsmål, stöder oljepriserna

Ett samtal om guld, olja, fjärrvärme och förnybar energi
Brent crude ticks higher on tension, but market structure stays soft

Guld nära 4000 USD och silver 50 USD, därför kan de fortsätta stiga
-
Nyheter4 veckor sedan
Tyskland har så höga elpriser att företag inte har råd att använda elektricitet
-
 Nyheter3 veckor sedan
OPEC+ missar produktionsmål, stöder oljepriserna
-
 Nyheter3 veckor sedan
Ett samtal om guld, olja, fjärrvärme och förnybar energi
-
Analys4 veckor sedan
Brent crude ticks higher on tension, but market structure stays soft
-
 Nyheter2 veckor sedan
Guld nära 4000 USD och silver 50 USD, därför kan de fortsätta stiga
-
Analys3 veckor sedan
Are Ukraine’s attacks on Russian energy infrastructure working?
-

 Nyheter1 vecka sedan
Goldman Sachs höjer prognosen för guld, tror priset når 4900 USD
-

 Nyheter3 veckor sedan
Guldpriset uppe på nya höjder, nu 3750 USD