

Analys
SEB – Råvarukommentarer, 9 september 2013

Rekommendationer
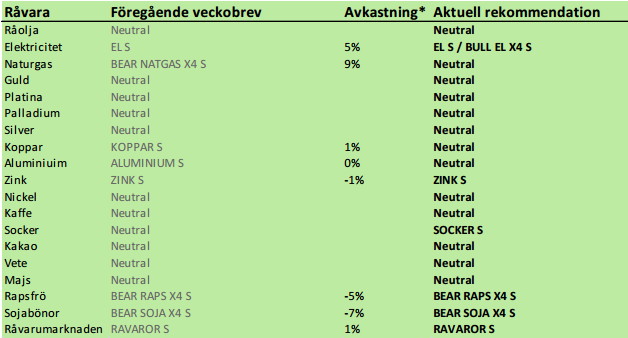
*) Avkastningen lämnar vi blank här eftersom det har varit ett två månaders uppehåll. Generellt sett har dock rekommendationerna varit lyckosamma med kraftiga nedgångar i priset på t ex spannmål och oljeväxter och prisuppgång på basmetaller.
Inledning
Styrkan i elmarknaden förvånar oss inte. En lång position i elpriset är vår främsta rekommendation. Förhoppningsvis får vi en rekyl nedåt i veckan. Det är i så fall ett bra tillfälle att komma in i marknaden till ett bra pris. Det är möjligt att trenden i elpriset kommer att vara uppåtriktad under lång tid.
En annan råvara, som står på gränsen till trendvändning är socker. Produktionen har varit större än konsumtionen i tre år, men nu kommer rapporter om att den här perioden tidigare än väntat är snart är över. Vi rekommenderar därför köp av SOCKER S.
Som ytterligare tecken på att världsekonomin är på väg att återhämta sig kom PMI för UK, Kina och USA in starkare i veckan som gick på 57.2 (54.8), 51 (50.3) och 55.7 (55.4), respektive. Det var alltså mer positiva förväntningar hos inköpscheferna i alla dessa tre länder. Förra veckan kunde vi rapportera att PMI för Eurozonen blev 51.4, vilket ska jämföras med 50.3 månaden innan.
I fredags var dock Non Farm Payrolls-statistiken från USA en besvikelse. Arbetslösheten sjunker visserligen en tiondels procent i USA, men det beror på att långtidsarbetslösa helt enkelt har lämnat arbetsmarknaden. Medan detta kan tolkas negativt, finns också en positiv sida för råvarumarknaden och det är att detta kan få den monetära politiken att vara expansiv längre än den annars varit. Mer pengar som trycks ut i ekonomin under längre tid, pumpar upp latent inflation ännu lite mer.
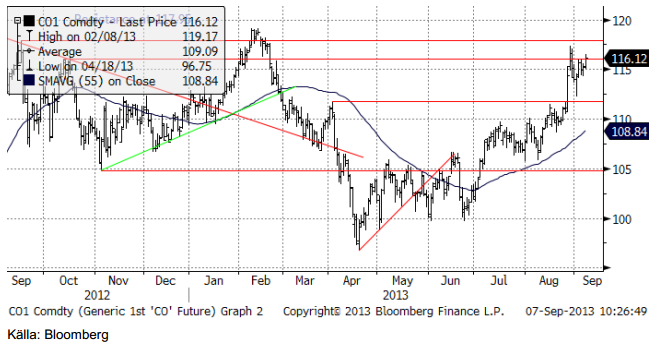
Råolja – Brent
Oljepriset ligger vid 116 dollar per fat, strax under tekniska motstånd. Fokus är på frågan om USA ska angripa Syrien, men under ytan finns andra faktorer, som driver på. På efterfrågesidan ser vi att USA:s konsumtion av olja växer igen. Implicit efterfrågan är 3% – 4% högre jämfört med förra året och så har det varit de senaste 8 veckorna. USA:s ekonomi håller på att återhämta sig, även om fredagens Non Farm Payrolls var en besvikelse. På utbudssidan ser vi inga tecken alls på att Libyens export komma igång igen.
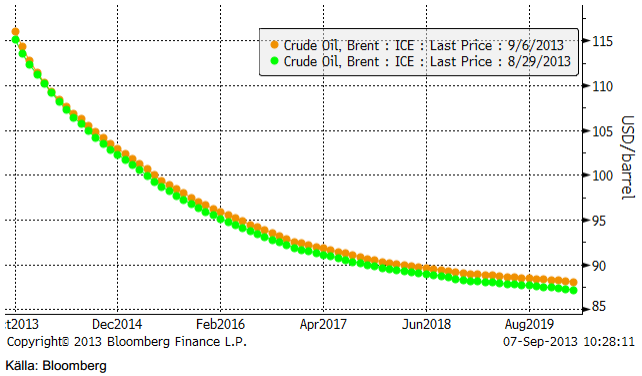
Den senaste veckan är det framförallt de längre terminskontrakten som har stigit, vad vi i marknaden kallar för ”bakänden”. I diagrammet nedan ser vi hur oljeterminsmarknadens terminspriser ser ut framåt i tiden. Den brandgula kurvan visar hur det såg ut i fredags kväll och den gröna hur det såg ut veckan innan.
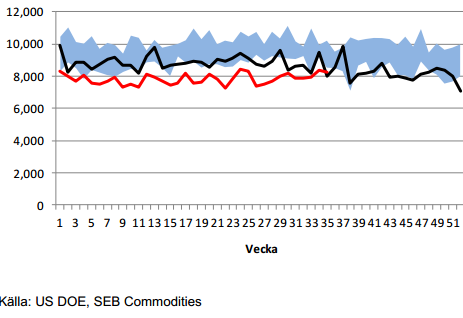
Nedan ser vi utvecklingen av råoljelagren i USA.
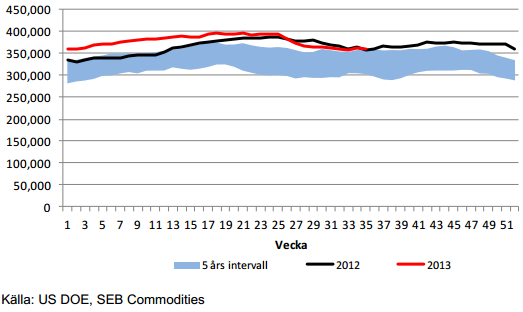
Importen år 2013 (röd) låg förra veckan på högre än under 2012, för samma vecka. Den ligger dock under snittet för de fem åren dessförinnan.
Ur ett tradingperspektiv skulle jag vilja fortsätta vara neutral. I det korta perspektivet beror prisutvecklingen på USA-Syrien-frågan och den kan vi inte gissa svaret på.
Elektricitet
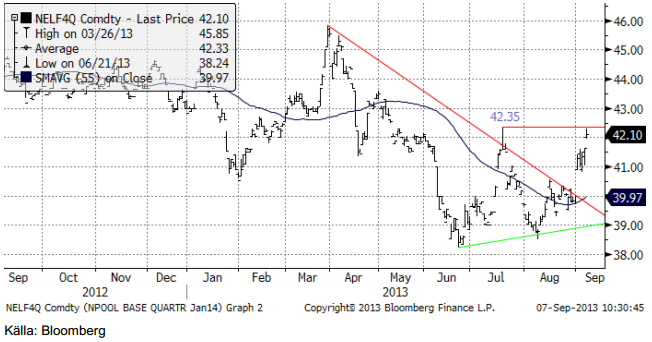
Nedan ser vi prisdiagrammet på det första kvartalets 2014 kontrakt. Efter vår köprekommendation vid ett pris under 40 euro, har marknaden handlat upp till strax under det tekniska motståndet vid 42.35 euro / MWh. Möjligen kommer en rekyl nedåt och det är i så fall ett köptillfälle.
Det finns de som undrar om de missat tåget, när priserna gått upp så kraftigt. Det har man alls inte gjort. Det är ett klassiskt misstag att inte köpa, bara för att priserna har gått upp kraftigt under kort tid. Priserna har gått ner under 2 år och 8 månader. Pristrenden uppåt kan mycket väl pågå lika länge. Fem dagars hausse innebär inte att det är för sent att ta en lång position i elmarknaden.
När Europa lägger krisen bakom sig återkommer miljöfrågorna förmodligen till agendan. EU-kommissionen beslutade i torsdags att ge ut 12% mindre gratis utsläppsrätter avseende CO2, än vad de som sökt hade hoppats få. Detta reducerar den naturliga långa positionen i marknaden för CO2. Priset på utsläppsrätter teg med 9% under torsdagens handel till ett pris över fem euro. Detta kan utlösa en anstormning för billiga utsläppsrätter. CO2 kan snabbt ta sig upp till 8 euro per ton.
El-terminer för kalenderår 2016 steg med 4% på den tyska elbörsen EEX i torsdags, som en naturlig konsekvens av prisuppgången på utsläppsrätter. Hela terminskurvan är på väg uppåt både på kontinenten och i Norden.
Nedan ser vi spotkontraktet på ”årskontraktet” för el, dvs vad det skulle kosta att prissäkra ett helt kalenderår. Just nu avser spotkontraktet priset för att prissäkra leverans av el under hela år 2014. Diagrammet är på dagsbasis. Även här ser vi att vi har en teknisk köpsignal, då trendlinjen bröts och prist gick förbi toppen i juli.
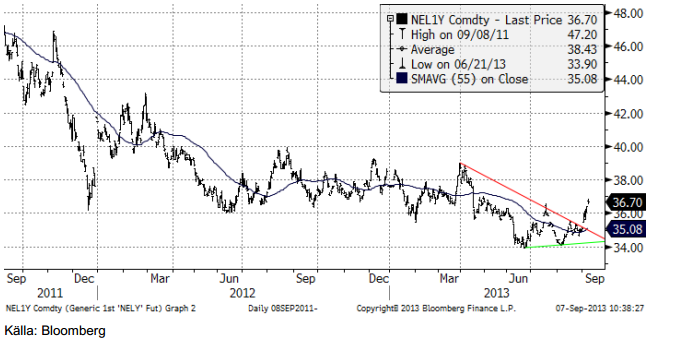
Vi tror att det är riktigt låga priser på el just nu. Det är orsakat av riktigt låga priser på kol, bottennivåer på utlsläppsrätter och allmän lågkonjunktur. Vi har nu fått en bekräftelse på ”tajmingen” av teknisk analys, vilket stärker oss i uppfattningen om att den nedgång som pågått i 2 år och åtta månader är slut och att en uppgångsfas har inletts.
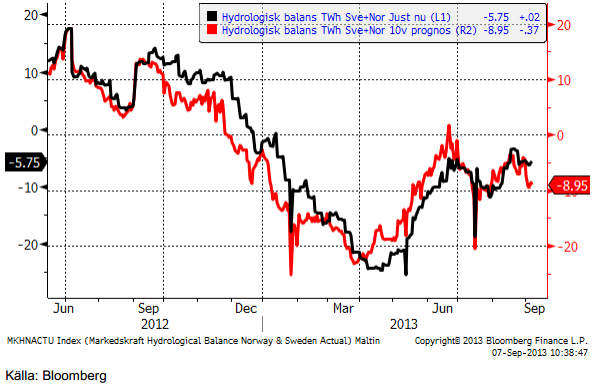
Hydrologisk balans har fortsatt att försämras, särskilt prognosen.
Marginalkostnaden för att producera el bestäms av priset på kol och priset på utsläppsrätter. Nedan ser vi priset på utsläppsrätter i euro / ton. Notera de kraftiga prisuppgångarna i torsdags och i fredags.
Vi rekommenderar alltså köp av el, t ex EL S eller BULL EL X4 S.
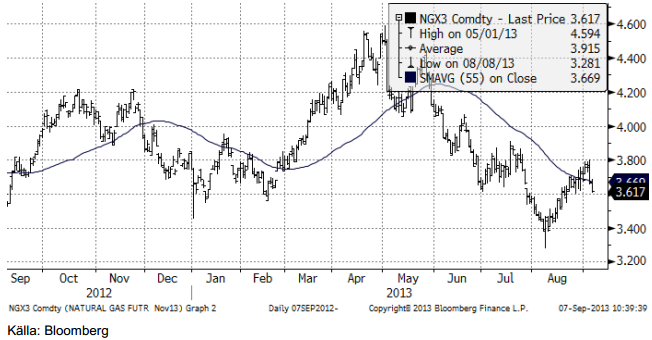
Naturgas
Naturgasprisets rekyl uppåt, vändes i nedgång i torsdags. Priset i fredags stannade på ett tekniskt stöd, 3.60. Vi har ingen vy om vart priset kommer att gå den kommande veckan.
Vi har haft rekommendation av BEAR NATGAS X4 S, men går nu över till neutral rekommendation.
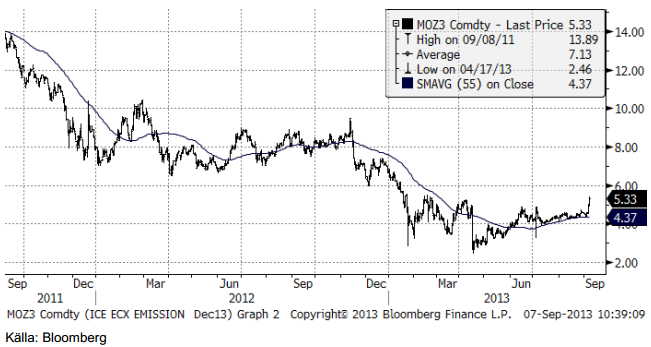
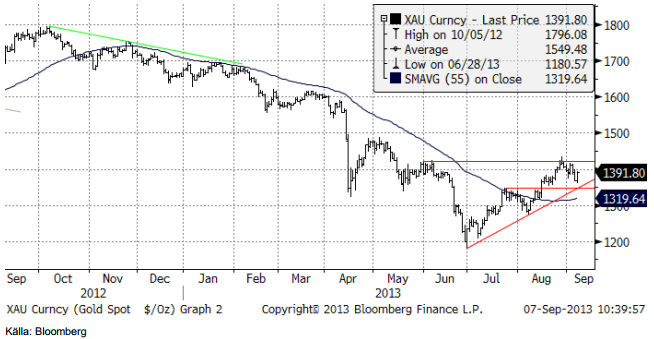
Guld & Silver
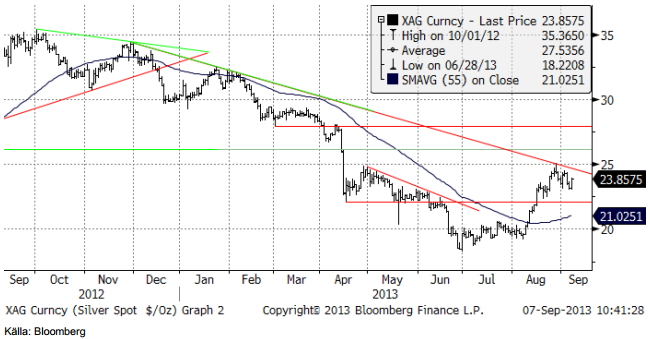
Guldpriset rekylerade precis som vi skrev förra veckan, vid det tekniska motståndet. Tekniskt börjar det dra ihop sig till en kamp mellan köpare och säljare. Ovanför dagens kurs finns motståndet från början av juni. Strax under ligger stödlinjen för uppgången som började i juli. Ett brott av någon av dessa, uppåt eller nedåt, ger en anledning att handla.
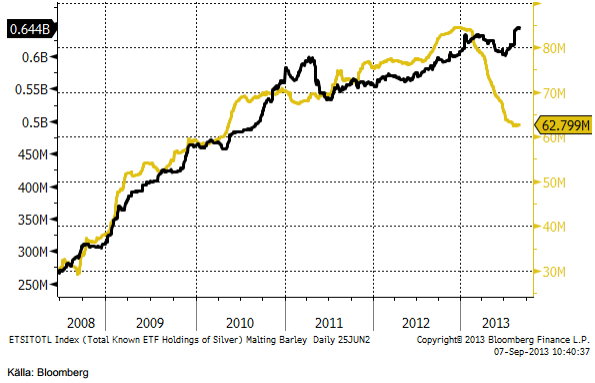
Nedan ser vi antalet troy uns i ETF:er på silver (svart linje) och i guld (gul linje).
Nedan ser vi kursdiagrammet för silver i dollar per troy ounce. Prisuppgången i veckan stannade vid motståndet på 25 dollar, som nämndes i förrförra veckans brev. Den tekniska bilden är precis som för guld, det står och väger, tämligen jämt mellan ”bulls” och ”bears”.
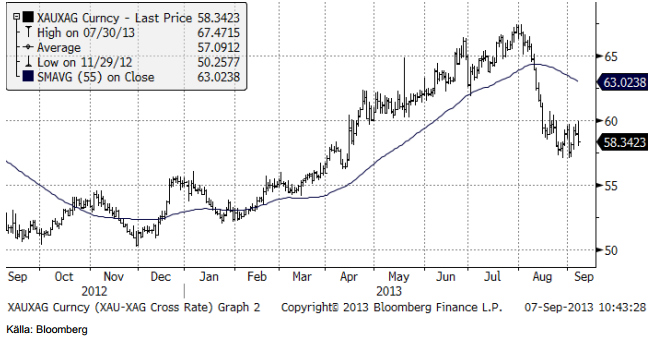
Nedan ser vi kvoten mellan guldpriset och silverpriset.
Platina & Palladium
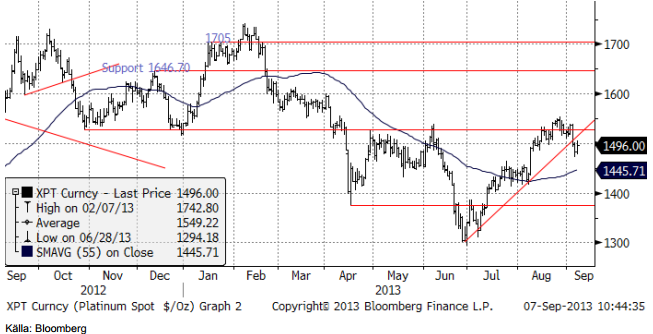
Platina har brutit stödet för uppgången från början av juli. Det är inte ett gott tecken.
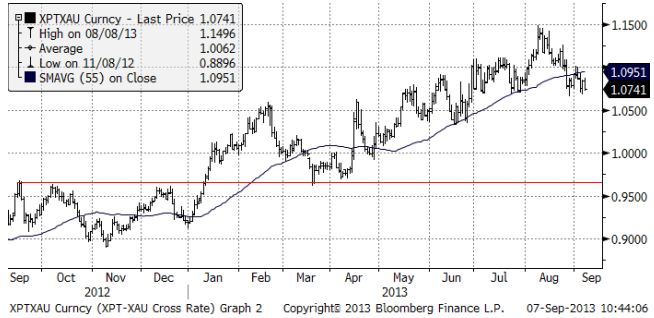
Nedan ser i kvoten mellan platina och guld. Vi ser att platina börjat handla svagare mot guld. Vi har haft en liten rekyl, men nu skulle platina faktiskt kunna förlora ytterligare mot guldet.
Palladiumpriset är just i färd med att bryta nedåt, ur den triangel vi uppmärksammade förra veckan. Detta kan ge en anledning att gå kort palladium.
Vi är för närvarande neutrala platina och palladium, men om palladium skulle falla bara något lite ytterligare, skulle vi vilja haka på och ta en kort position via BEAR PALLAD X4 S.
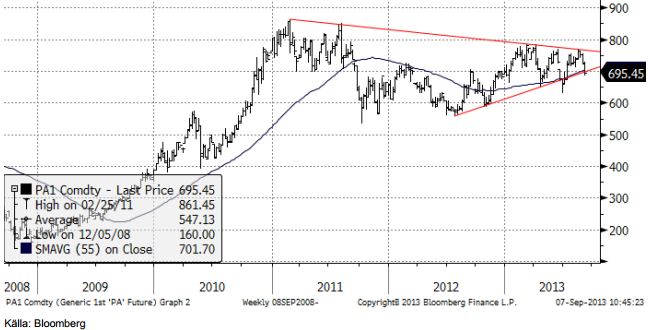
Koppar
De som tror på uppgång i kopparpriset pekar på att det ekonomiska läget i Kina håller på att förbättras och de första tecknen på en återhämtning i Europa. De ser detta som en bra anledning att köpa på nedgångar. De som tror på fortsatt nedgång i kopparpriset oroar sig för det ekonomiska hälsotillståndet i tillväxtmarknader som Indien, Brasilien, Ryssland och Indonesien. Effekten av osäkerheten har blivit en högre kursrörlighet. Vi håller mer på den grupp som tror på en uppgång i priset, eftersom fundamenta gradvis tycks förbättras. Vi tror att konsumenter av metallen också kommer att passa på att köpa på prisnedgångar. Å andra sidan hör vi också om producenter som är måna om att hedga om priserna kommer upp till runt 7400 dollar. Det ger oss en ”range” som ligger vid 7000 till 7500 dollar per ton och det är där priset har legat. Skulle priset gå över 7500 dollar, har vi en teknisk köpsignal, men som marknaden ser ut, är det nog en bättre idé att försöka köpa nära botten på prisintervallet, dvs om priset återigen går ner mot 7000 dollar.
Den allmänna uppfattningen i marknaden är att överskottet kommer att bli 408,000 ton nästa år. Det är den högsta nivån på överproduktion i förhållande till konsumtion sedan år 2001. Baserat på en survey av 15 analytiker väntas innevarande år ha en överproduktion på 167,000 ton. Detta är 2% av total produktion. Ökad produktion har varit väntad i flera år. Kinas drag i efterfrågan skulle förr eller senare följas av mer produktion. I takt med att Kinas råvaruefterfrågan planar ut, kommer produktionen i kapp.
Nedan ser vi kopparpriset och lagernivån vid LME. Notera stödet strax under dagens prisnivå och brottet av den nedåtgående kortsiktiga trenden.
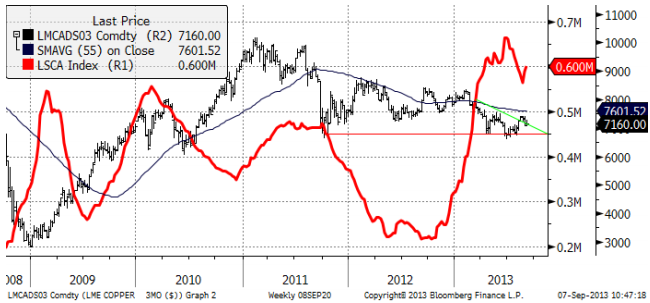
Det är en svårtolkad bild och vi rekommenderar neutral position.
Aluminium
Prisuppgången orkade inte igenom 55-dagars glidande medelvärde. Man ser då och då att detta fungerar som ett motstånd, antagligen för att handlare tittar på det och att det attraherar säljordrar när priserna kommer nedifrån upp mot det. Man skulle kunna tänka sig att diagrammet uppvisar en klassisk så kallad ”head and shoulders” formation, med huvudet vid toppen år 2011 och nacklinjen vid 1900 dollar. I så fall är prisobjektivet på nedsidan vid samma bottennivå som i början av år 2009, dvs ca 1300 dollar. Trenden är faktiskt nedåtriktad just nu. Stöd finns vid 1800 dollar. Går priset under den nivån skulle vi vilja vara korta, dvs köpta BEAR ALU X4 S.
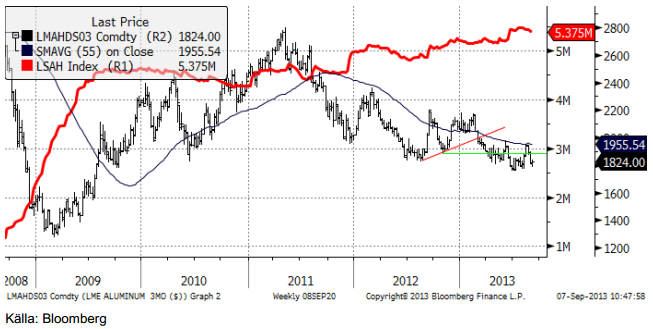
Vi har neutral rekommendation, tidigare köp.
Zink
Priset på zink har i nästan två års tid legat inom ett intervall mellan 1718.50 dollar per ton och 2200 dollar per ton, som vi ser nedan. Den röda linjen visar lagren av zink vid LME. Vi ser att marknaden börjat komma mer i balans. De rekordstora lagren har börjat minska.
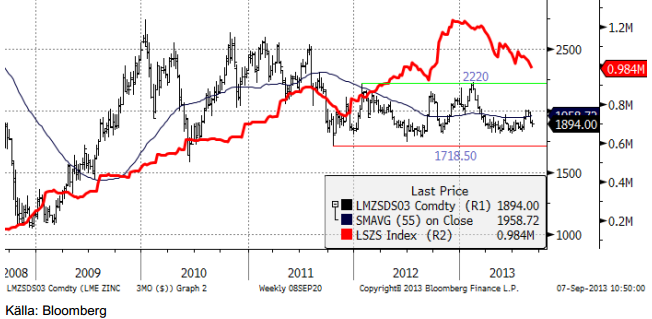
Vi fortsätter med en försiktig köprekommendation, av ZINK S.
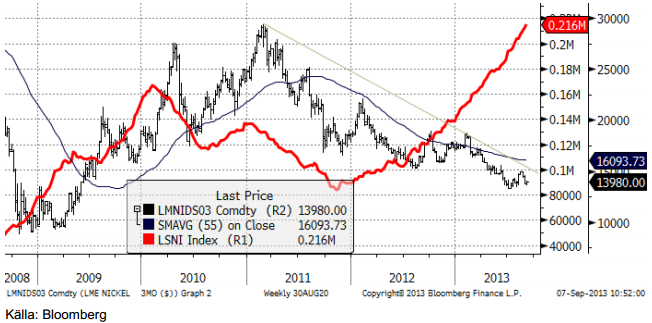
Nickel
Nickelpriset höll sig stabilt i jämförelse med andra basmetaller när marknaden föll i mitten av den gångna veckan. Enligt Macquarie ligger de senaste priserna för Nickel Pig Iron (NPI) med 8 – 13% nickelinnehåll 600 dollar över LME-noteringen. Det är första gången sedan 2012 som detta sker. Just nu är det verkliga nickelinnehållet närmare 15% i NPI, högre än vad det var i juli. I juni låg priset på NPI 2500 dollar under LME-noteringen. Enligt samma källa, kan detta tyda på att utbudet av NPI äntligen håller på att minska.
Detta skulle, åtminstone i teorin, kunna innebära högre pris på nickel. Frågan är om detta är början på en länge efterlängtad förbättring i nickelmarknadens tillstånd. Det kanske är ett tidigt tecken. En blick på lagren och lagerutvecklingen vid LME visar att marknaden har en lång väg tillbaka till balans att gå. Nickel stack ut i veckan som gick och visade förvånande styrka.
Tekniskt har vi ett stöd vid det lägsta priset under år 2013, som är 13,298 dollar / ton. Vi ser också att det finns en motståndslinje från toppen under 2011 som ännu inte är bruten. Än så länge är den tekniska trenden nedåt, men priserna är sannolikt nära botten.
[box]SEB Veckobrev Veckans råvarukommentar är producerat av SEB Merchant Banking och publiceras i samarbete och med tillstånd på Råvarumarknaden.se[/box]
Disclaimer
The information in this document has been compiled by SEB Merchant Banking, a division within Skandinaviska Enskilda Banken AB (publ) (“SEB”).
Opinions contained in this report represent the bank’s present opinion only and are subject to change without notice. All information contained in this report has been compiled in good faith from sources believed to be reliable. However, no representation or warranty, expressed or implied, is made with respect to the completeness or accuracy of its contents and the information is not to be relied upon as authoritative. Anyone considering taking actions based upon the content of this document is urged to base his or her investment decisions upon such investigations as he or she deems necessary. This document is being provided as information only, and no specific actions are being solicited as a result of it; to the extent permitted by law, no liability whatsoever is accepted for any direct or consequential loss arising from use of this document or its contents.
About SEB
SEB is a public company incorporated in Stockholm, Sweden, with limited liability. It is a participant at major Nordic and other European Regulated Markets and Multilateral Trading Facilities (as well as some non-European equivalent markets) for trading in financial instruments, such as markets operated by NASDAQ OMX, NYSE Euronext, London Stock Exchange, Deutsche Börse, Swiss Exchanges, Turquoise and Chi-X. SEB is authorized and regulated by Finansinspektionen in Sweden; it is authorized and subject to limited regulation by the Financial Services Authority for the conduct of designated investment business in the UK, and is subject to the provisions of relevant regulators in all other jurisdictions where SEB conducts operations. SEB Merchant Banking. All rights reserved.

Brent is climbing higher. Front-month is at USD 106.3/bl this morning, close to a weekly high and a USD 9/bl jump from Mondays open. This is the move we flagged as a risk earlier in the week: the market shifting from ”a deal is around the corner” to ”this is going to take longer than we thought”.

Analyst Commodities, SEB
During April, rest-of-year Brent remained remarkably stable around USD 90/bl. A stability which rested on one single assumption: the SoH reopens around 1 May. That assumption is now slowly falling apart.
As we highlighted yesterday: every week of delay beyond 1 May adds (theoretically) ish USD 5/bl to the rest-of-year average, as global inventories draw 100 million barrels per week. i.e., a mid-May reopening implies rest-of-year Brent closer to USD 100/bl, and anything pushing into June or July takes us meaningfully higher.
What’s changed in the last 48 hours:
#1: The US military has formally warned that clearing suspected sea mines from SoH could take up to six months. That is a completely different timescale from what the financial market is pricing. Even a political deal tomorrow does not immediately reopen the strait.
#2: Trump has shifted his tone from urgency to ”strategic patience”. In yesterday’s press conference: ”Don’t rush me… I want a great deal.” The market is reading this as a president no longer feeling pressured by timelines, with the naval blockade running in the background.
#3: So far, the military activity is escalating, not de-escalating. Axios reports Iran is laying more mines in SoH. The US 3rd carrier strike group (USS George H.W. Bush) is arriving with two countermine vessels. Trump yesterday ordered the US Navy to destroy any Iranian boats caught laying mines. While CNN reports that the Pentagon is actively drawing up plans to strike Iranian SoH capabilities and individual Iranian military leaders if the ceasefire collapses. i.e., NOT a attitude consistent with an imminent deal!
Spot crude and product prices eased off the early-April highs on a combination of system rerouting and deal optimism. Both now weakening. Goldman estimates April Gulf output is reduced by 14.5 mbl/d, or 57% of pre-war supply, a number that keeps getting worse the longer this drags on.
Demand-side adaptation is ongoing: S. Korea has cut its Middle East crude dependence from 69% to 56% by pulling more from the Americas and Africa, and Japan is kicking off a second round of SPR releases from 1 May. But SPRs are finite.
Ref. to the negotiations, we should not bet on speed. The current Iranian leadership is dominated by genuine hardliners willing to absorb economic pain and run the clock to extract concessions. That is not a setup for a rapid resolution. US/Israeli media briefings keep framing the delay as ”internal Iranian divisions”, the reality is more complicated and points toward weeks and months, not days.
Our point is that the complexity is large, and higher prices have only just started (given a scenario where the negotiations drag out in time). The market spent April leaning on the USD 90/bl rest-of-year assumption; that case is diminishing by the hour. If ”early May reopening” is replaced by ”June, July or later” over the next week or two, both crude and products have meaningful room to reprice higher from here. There is a high risk being short energy and betting on any immediate political resolution(!).
Down on Friday. Up on Monday. The Brent June crude oil contract traded down 5.1% last week to a close of $90.38/b. It reached a high of $103.87/b last Monday and a low of $86.09/b on Friday as Iran announced that the Strait of Hormuz was fully open for transit. That quickly changed over the weekend as the US upheld its blockade of Iranian oil exports while Iran naturally responded by closing the SoH again. The US blew a hole in the engine room of the Iranian ship TOUSKA and took custody of the ship on Sunday. Brent crude is up 5.6% this morning to $95.4/b.

The cease-fire is expiring tomorrow. The US has said it will send a delegation for a second round of negotiations in Islamabad in Pakistan. But Iran has for now rejected a second round of talks as it views US demands as unrealistic and excessive while the US is also blocking the Strait of Hormuz.
While Brent is up 5% this morning, the financial market is still very optimistic that progress will be made. That talks will continue and that the SoH will fully open by the start of May which is consistent with a rest-of-year average Brent crude oil price of around $90/b with the market now trading that balance at around $88/b.
Financial optimism vs. physical deterioration. We have a divergence where the financial market is trading negotiations, improvements and resolution while at the same time the physical market is deteriorating day by day. Physical oil flows remain constrained by disrupted flows, longer voyage times and elevated freight and insurance costs.
Financial markets are betting that a US/Iranian resolution will save us in time from violent shortages down the road. But every day that the SoH remains closed is bringing us closer to a potentially very painful point of shortages and much higher prices.
The US blockade is also a weapon of leverage against its European and Asian allies. When Iran closed the SoH it held the world economy as a hostage against the US. The US blockade of the SoH is of course blocking Iranian oil exports. But it is also an action of disruption directed towards Europe and Asia. The US has called for the rest of the world to engaged in the war with Iran: ”If you want oil from the Persian Gulf, then go and get it”. A risk is that the US plays brinkmanship with the global oil market directed towards its European and Asian allies and maybe even towards China to force them to engage and take part. Maybe unthinkable. But unthinkable has become the norm with Trump in the White House.
Wild moves yesterday. Brent crude traded to a high of $114.43/b and a low of $96.0/b and closed at $99.94/b yesterday.
US – Iran negotiations ongoing or not? What a day. Donald Trump announced that good talks were ongoing between Iran and the US and that the 48 hour deadline before bombing Iranian power plants and energy infrastructure was postponed by five days subject to success of ongoing meetings. Iranian media meanwhile stated that no meetings were ongoing at all.
Today we are scratching our heads trying to figure out what yesterday was all about.
Friends and family playing the market? Was it just Trump and his friends and family who were playing with oil and equity markets with $580m and $1.46bn in bets being placed by someone in oil and equity markets just 15 minutes before Trump’s announcement?
Was Trump pulling a TACO as he reached his political and economic pain point: Brent at $112/b, US Gas at $4/gal, SPX below 200dma and US 10yr above 4.4%?
Different Iranian factions with Trump talking with one of them? Are there real negotiations going on but with the US talking to one faction in Iran while another, the hardliners, are not involved and are denying any such negotiations going on?
Extending the ultimatum to attack and invade Kharg island next weekend? Or, is the five day delay of the deadline a tactical decision to allow US amphibious assault ships and marines to arrive in the Gulf in the upcoming weekend while US and Israeli continues to degrade Iranian military targets till then. And then next weekend a move by the US/Israel to attack and conquer for example the Kharg island?
We do not really know which it is or maybe a combination of these.
We did get some kind of TACO ydy. But markets have been waiting for some kind of TACO to happen and yesterday we got some kind of TACO. And Brent crude is now trading at $101.5/b as a result rather than at $112-114/b as it did no the high yesterday.
But what really matters in our view is the political situation on the ground in Iran. Will hardliners continue to hold power or will a more pragmatic faction gain power?
If the hardliners remain in power then oil pain should extend all the way to US midterm elections. The hardliners were apparently still in charge as of last week. Iran immediately retaliated and damaged LNG infrastructure in Qatar after Israel hit Iranian South Pars. The SoH was still closed and all messages coming out of Iran indicated defiance. Hardliners continues in power has a huge consequence for oil prices going forward. The regime has played its ’oil-weapon’ (closing or chocking the Strait of Hormuz). It is using it to achieve political goals. Deterrence: it needs to be so politically and economically expensive to attack Iran that it won’t happen again in the future. Or at least that the US/Israel thinks 10-times over before they attack again. The highest Brent crude oil closing price since the start of the war is $112.19/b last Friday. In comparison the 20-year inflation adjusted Brent price is $103/b. So Brent crude last Friday at $112.19/b isn’t a shockingly high price. And it is still far below the nominal high of $148/b from 2008 which is $220/b if inflation adjusted. So once in a lifetime Iran activates its most powerful weapon. The oil weapon. It needs to show the power of this weapon and it needs to reap political gains. Getting Brent to $112/b and intraday high of $119.5/b (9 March) isn’t a display of the power of that weapon. And it is not a deterrence against future attacks.
So if the hardliners remain in power in Iran, then the SoH will likely remain chocked all the way to US midterm elections and Brent crude will at a minimum go above the historical nominal high of $148/b from 2008.
Thus the outlook for the oil price for the rest of the year doesn’t depend all that much of whether Trump pulls a TACO or not. Stops bombing or not. It depends more on who is in charge in Iran. If it is the hardliners, then deterrence against future attacks via chocking of the SoH and high oil prices is the likely line of action. It is impacting the world but the Iranian ’oil-weapon’ is directed towards the US president and the the US midterm elections.
If a pragmatic faction gets to power in Iran, then a very prosperous future is possible. However, if power is shifting towards a more pragmatic faction in Iran then a completely different direction could evolve. Such a faction could possibly be open for cooperation with the US and the GCC and possibly put its issues versus Israel aside. Then the prosperity we have seen evolving in Dubai could be a possible future also for Iran.
So far it looks like the hardliners are fully in charge. As far as we can see, the hardliners are still fully in control in Iran. That points towards continued chocking of the SoH and oil prices ticking higher as global inventories (the oil market buffers) are drawn lower. And not just for a few more weeks, but possibly all the way to the US midterm elections.


Brent crude up USD 9/bl on the week… ”deal around the corner” narrative fades
Market Still Betting on Timely Resolution, But Each Day Raises Shortage Risk

Christian Kopfer om läget för oljan

Marknaden måste börja betrakta de höga kopparpriserna som det nya normala

Det fysiska spotpriset på brentolja har slagit nytt rekord

40 minuter med Javier Blas om hur världen verkligen påverkas av energikrisen

Elpriserna fördubblas, stor osäkerhet inför sommaren
Det fysiska spotpriset på brentolja har slagit nytt rekord
Marknaden måste börja betrakta de höga kopparpriserna som det nya normala
Christian Kopfer om läget för oljan
-
 Nyheter3 veckor sedan
40 minuter med Javier Blas om hur världen verkligen påverkas av energikrisen
-
 Nyheter4 veckor sedan
Elpriserna fördubblas, stor osäkerhet inför sommaren
-
 Nyheter3 veckor sedan
Det fysiska spotpriset på brentolja har slagit nytt rekord
-
 Nyheter3 veckor sedan
Marknaden måste börja betrakta de höga kopparpriserna som det nya normala
-
 Nyheter2 veckor sedan
Christian Kopfer om läget för oljan
-

 Nyheter3 veckor sedan
Efter tillväxten: Guldbrev satsar på expansion i Europa
-
Analys5 dagar sedan
Market Still Betting on Timely Resolution, But Each Day Raises Shortage Risk
-
Analys16 timmar sedan
Brent crude up USD 9/bl on the week… ”deal around the corner” narrative fades