

Analys
SHB Råvarubrevet 6 september 2013

 Råvaror allmänt
Man petar inte på en skallerom
Risktillgångar har drabbats av viss tillbakagång under veckan när en amerikansk attack mot Syrien har blivit allt mer uppenbar. Vi gästades av FOI:s analytiker som menar att sannolikheten för en attack från Obama nu är mer än 80 %. Antingen dödar man en skallerorm eller så låter man den vara i fred; man petar inte på den. Har Obama gett sig in i argumentationen med Syrien så kommer han sannolikt att löpa hela linan ut. Den geopolitiska spänningen ökar riskpremien i olja men verkar dämpande på de flesta andra råvaror.
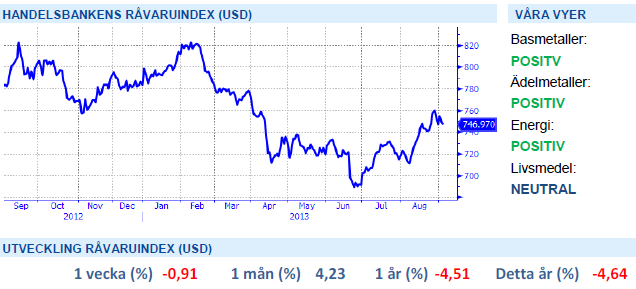
Globalt fortsätter makrodata att vittna om en förbättring. Veckan startade med ett bättre än väntat inköpschefsindex från Kina och slutar med bra inköpschefsindex (PMI) och arbetsmarknadsdata (jobless claims) från USA. Vårt tema med en marknad som drivs av robust makrodata håller alltså i sig, och vi tror att det fortgår några månader till. Mycket av den bra makrodatan verkar dock redan vara inprisad i många tillgångslag givet hur börsen och räntemarknaden betett sig senaste tiden. Stundande oro för råvarumarknaden är Fed:s ”tapering” som väntas tillkännages under septembermötet den 18/9. Mycket av detta torde dock vara inprisat i dagens marknad och vi fortsätter därför tro att stark makrodata får råvarorna att stiga framöver.
Basmetaller
Kina överraskar positivt
I söndags publicerades Kinas PMI med positivt resultat, 51 mot väntade 50,6, och gav basmetallerna skjuts uppåt initialt. Efter att en attack mot Syrien blir mer sannolik har dock risktillgångar som basmetaller fallit tillbaka något under veckan. Tenn har haft ett kraftigt uppsving under veckan efter exportbegränsningar från Indonesien, värdens störta exportör. Indonesien har i sin ambition att öka de inhemska smältlönerna stoppat exporten av tenn. Dels höjer man den för export godkända halten samtidigt som man försöker stimulera den lokala handeln och landets möjligheter att behålla ett större värde av landets värdefulla naturtillgångar. Detta har tvingat PT Timah, världens tredje största producent, att åberopa force majeure sedan den 30 augusti. Låga lager och inställda leveranser från Indonesien har skickat upp priset på tenn till fem månaders högsta och har under veckan stigit med dryga 6,2 %.
Under första halvan av året har utvecklingen på basmetaller och aktiemarknaden gått ordentligt isär, bilden nedan visar utvecklingen på Handelsbankens Basmetallindex mot S&P 500 sedan 2007. Även om amerikansk och europeisk makro signalerat återhämtning under en tid, verkar den kinesiska ekonomin varit i kontraktion fram till juli/augusti i år vilket pressat efterfrågan och priserna på metaller. De senaste veckorna har vi dock sett tecken på att den kinesiska tillväxten kan ta fart igen där några fundamentala rörelser är intressanta att notera, framför allt på koppar. Kinas kopparimport har återigen ökat och såväl inhemska som globala lager har minskat samtidigt som investerare täckt sina korta positioner. När den värsta oron för ett överutbud nu avtagit samtidigt som lagren minskar anser vi att metallpriserna bör ha bottnat ur under Q2 2013 och att en ökande efterfrågan bör resultera i högre metallpriser överlag under hösten.
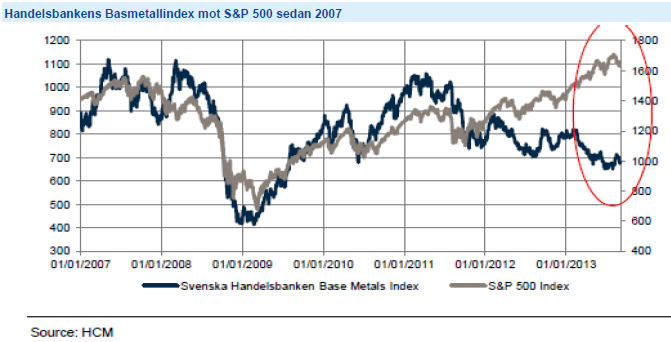
Kinas kopparimport har återigen ökat och såväl inhemska som globala lager har minskat samtidigt som investerare täckt sina korta positioner. Vi tror på: LONG KOPPAR
Ädelmetaller
På guldfronten intet nytt!
Efter dagens rykande färska arbetslöshetsstatistik från USA, nonfarm payrolls som kom in något sämre än väntat, handlar guldet på 1390 dollar per uns, att jämföra med förra fredagens 1390 dollar per uns… Veckan har präglats av små rörselser i brist på nya nyheter i Syrienfrågan och i linje med en avvaktande hållning på de flesta marknaderna. Vi bibehåller vår positiva syn på guldet i det kortare perspektivet, och vår negativa syn i det längre perspektivet. Platina har tappat marginellt under veckan som gått.
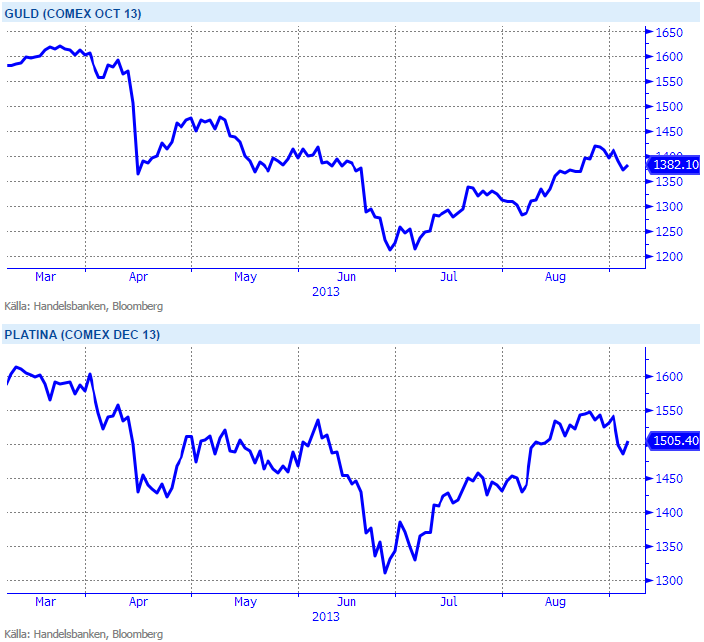
I ett läge där råvaror generellt har viktats ned av institutionella placerare kan guld och silver få en ”omotiverad” uppgång när dessa indexköpare återvänder till råvaror drivit av bättre utsikter för Kina och USA. Vi tror på: LONG GULD H och LONG SILVER H
Energi
Fortsatt Syrienattack i fokus
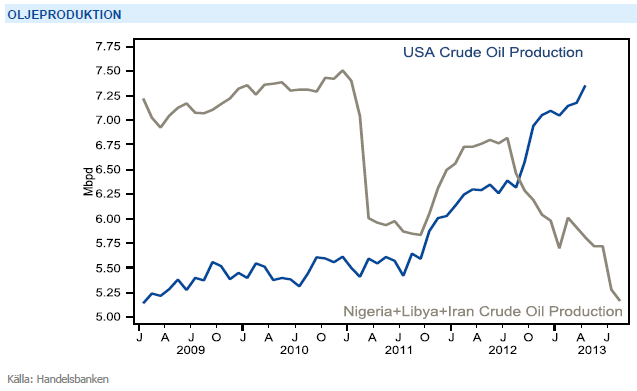
Oljan ligger kvar på höga nivåer där oron för utbudsstörningar i Mellanöstern och sannolikheten att att USA slår tillbaka på al-Assad regimen kvarstår. Buy the rumour sell the fact brukar ju vara en gyllene regel där vi tidigare sett riskpremien pysa ut ganska hastigt efter både Libyen- och Irankonflikten. Även om så sker efter en eventuell intervention, ser vi flera faktorer som kan skrämma upp oljepriset ytterligare. Den globala reservkapaciteten är endast 1.3 miljoner fat per dag och vi ställer oss frågande till om Saudiarabien, som redan idag producerar på rekordnivå, verkligen kan täcka upp för det kraftiga produktionsbortfallet från Nigeria, Libyen och Iran (se bilden nedan). Även Irak har minskat sin produktion de senaste 12 månaderna och denna osäkerhet anser vi väl motiverar nuvarande riskpremie. Lägg därtill positiv amerikansk makrostatistik vilket i kombination med vikande råoljelager för nionde veckan i rad bör skapa en hel del rörelser på uppsidan. Vår rekommendation om lång position kvartsår.
Elmarknaden och kvartalet Q1 2014 (som nu är underliggande för Handelsbankens elindex och investeringsprodukter) stiger med närmare 6 procent denna vecka. Uppgången inleddes med att Oskarshamnsverket 3 oväntat föll ur drift förra helgen vilket resulterade i att svenska kärnkraften föll tillbaka på 58 procents output. Det torra scenario vi såg mot slutet av förra veckan låg kvar över helgen vilket genererade en hel del köpintresse. Vidare har såväl bränslekomplex, utsläppsrätter och Tyska marknaden där vi sett en del shortcovering stärkts vilket gjort att vi tagit oss igenom tidigare motståndsnivåer. Vädret spelar till stor del in och begränsar nedsidan på de två kommande kvartalskontrakten. Senaste väderprognoserna pekar på ett kraftigt underskott i nederbörden de kommande 10-dagarna vilket i skrivande stund ser ut att försämra energibalansen med 5-6 TWh ned till -13 TWh. Vi ligger därför kvar med lång rekommendation.
Oroligheterna i mellanöstern med risk för ytterligare produktionsbortfall ger stöd till oljepriset. Vi tror på: LONG OLJA
Livsmedel
Goda skördar pressar rispriset
Spannmålspriserna har den senaste tiden påverkats i hög grad av väderutvecklingen i USA. Majsen, men främst sojan som inte kommit lika långt i sin utveckling, har påverkats negativt av torrt och varmt väder och risken för nedjusteringar av kommande skörd har ökat. Väderprognoserna har varierat en del och priserna likaså – regn i sikte har pressat ned prisnivån något men nya prognoser om åter minskad nederbörd har lätt skapat ett uppsving igen.
Kakao tillhör den råvara i vårt livsmedelindex som gått bäst sedan årsskiftet. SHB Cocoa har gått upp drygt 8,5 procent som följd av bl.a. torrt väder och minskad skörd i Afrikas västkust. Under veckan har kakaopriset fått ytterligare stöd och nådde 11-månaders högsta efter nya väderrapporter som visat på halverat skyfall för de senaste 30 dagarna jämfört med ett normalår.
En annan mjuk råvara som haft ett volatilt år är ris. Underliggande terminen till SHB Rice är Rough Rice som handlas på Chicago börsen och där ett kontrakt motsvarar 2000 CWT (ca 90 kg). De globala lagren på ris väntas stiga till 107,47 miljoner ton för säsong 2013-14 – vilket är i så fall den högsta siffran på 12 år. Förväntningarna på den kommande globala risproduktionen för säsong 2013-14 visar på en ökning med 1,9 procent från tidigare säsong, enligt den senaste rapporten från amerikanska jordbruksdepartementet. Förhållandet mellan utgående lager i förhållande till årlig konsumtion är 22,6 procent. Den höga siffran visar på välfyllda rislager för säsongen varför vi tror på fallande priser.
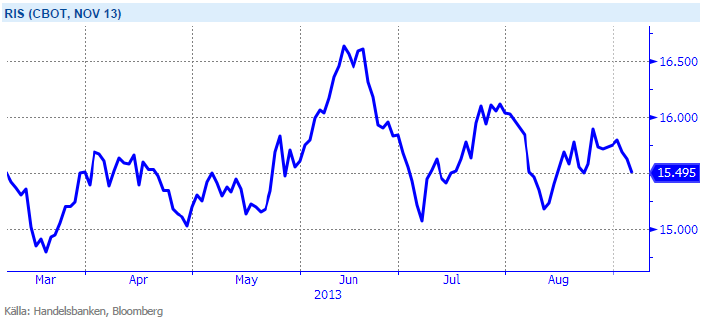
Förväntningar på den kommande risproduktionen är stor och prognoser visar på välfyllda lager. Vi tror på: SHORT RIS
Handelsbankens Råvaruindex
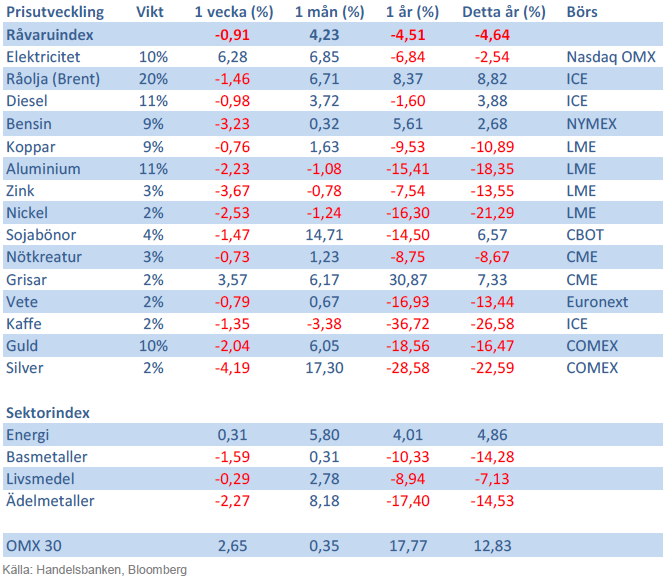
Handelsbankens råvaruindex består av de underliggande indexen för respektive råvara. Vikterna är bestämda till hälften från värdet av nordisk produktion (globala produktionen för sektorindex) och till hälften från likviditeten i terminskontrakten.
[box]SHB Råvarubrevet är producerat av Handelsbanken och publiceras i samarbete och med tillstånd på Råvarumarknaden.se[/box]
Ansvarsbegränsning
Detta material är producerat av Svenska Handelsbanken AB (publ) i fortsättningen kallad Handelsbanken. De som arbetar med innehållet är inte analytiker och materialet är inte oberoende investeringsanalys. Innehållet är uteslutande avsett för kunder i Sverige. Syftet är att ge en allmän information till Handelsbankens kunder och utgör inte ett personligt investeringsråd eller en personlig rekommendation. Informationen ska inte ensamt utgöra underlag för investeringsbeslut. Kunder bör inhämta råd från sina rådgivare och basera sina investeringsbeslut utifrån egen erfarenhet.
Informationen i materialet kan ändras och också avvika från de åsikter som uttrycks i oberoende investeringsanalyser från Handelsbanken. Informationen grundar sig på allmänt tillgänglig information och är hämtad från källor som bedöms som tillförlitliga, men riktigheten kan inte garanteras och informationen kan vara ofullständig eller nedkortad. Ingen del av förslaget får reproduceras eller distribueras till någon annan person utan att Handelsbanken dessförinnan lämnat sitt skriftliga medgivande. Handelsbanken ansvarar inte för att materialet används på ett sätt som strider mot förbudet mot vidarebefordran eller offentliggörs i strid med bankens regler.


Down on Friday. Up on Monday. The Brent June crude oil contract traded down 5.1% last week to a close of $90.38/b. It reached a high of $103.87/b last Monday and a low of $86.09/b on Friday as Iran announced that the Strait of Hormuz was fully open for transit. That quickly changed over the weekend as the US upheld its blockade of Iranian oil exports while Iran naturally responded by closing the SoH again. The US blew a hole in the engine room of the Iranian ship TOUSKA and took custody of the ship on Sunday. Brent crude is up 5.6% this morning to $95.4/b.

The cease-fire is expiring tomorrow. The US has said it will send a delegation for a second round of negotiations in Islamabad in Pakistan. But Iran has for now rejected a second round of talks as it views US demands as unrealistic and excessive while the US is also blocking the Strait of Hormuz.
While Brent is up 5% this morning, the financial market is still very optimistic that progress will be made. That talks will continue and that the SoH will fully open by the start of May which is consistent with a rest-of-year average Brent crude oil price of around $90/b with the market now trading that balance at around $88/b.
Financial optimism vs. physical deterioration. We have a divergence where the financial market is trading negotiations, improvements and resolution while at the same time the physical market is deteriorating day by day. Physical oil flows remain constrained by disrupted flows, longer voyage times and elevated freight and insurance costs.
Financial markets are betting that a US/Iranian resolution will save us in time from violent shortages down the road. But every day that the SoH remains closed is bringing us closer to a potentially very painful point of shortages and much higher prices.
The US blockade is also a weapon of leverage against its European and Asian allies. When Iran closed the SoH it held the world economy as a hostage against the US. The US blockade of the SoH is of course blocking Iranian oil exports. But it is also an action of disruption directed towards Europe and Asia. The US has called for the rest of the world to engaged in the war with Iran: ”If you want oil from the Persian Gulf, then go and get it”. A risk is that the US plays brinkmanship with the global oil market directed towards its European and Asian allies and maybe even towards China to force them to engage and take part. Maybe unthinkable. But unthinkable has become the norm with Trump in the White House.
Wild moves yesterday. Brent crude traded to a high of $114.43/b and a low of $96.0/b and closed at $99.94/b yesterday.
US – Iran negotiations ongoing or not? What a day. Donald Trump announced that good talks were ongoing between Iran and the US and that the 48 hour deadline before bombing Iranian power plants and energy infrastructure was postponed by five days subject to success of ongoing meetings. Iranian media meanwhile stated that no meetings were ongoing at all.
Today we are scratching our heads trying to figure out what yesterday was all about.
Friends and family playing the market? Was it just Trump and his friends and family who were playing with oil and equity markets with $580m and $1.46bn in bets being placed by someone in oil and equity markets just 15 minutes before Trump’s announcement?
Was Trump pulling a TACO as he reached his political and economic pain point: Brent at $112/b, US Gas at $4/gal, SPX below 200dma and US 10yr above 4.4%?
Different Iranian factions with Trump talking with one of them? Are there real negotiations going on but with the US talking to one faction in Iran while another, the hardliners, are not involved and are denying any such negotiations going on?
Extending the ultimatum to attack and invade Kharg island next weekend? Or, is the five day delay of the deadline a tactical decision to allow US amphibious assault ships and marines to arrive in the Gulf in the upcoming weekend while US and Israeli continues to degrade Iranian military targets till then. And then next weekend a move by the US/Israel to attack and conquer for example the Kharg island?
We do not really know which it is or maybe a combination of these.
We did get some kind of TACO ydy. But markets have been waiting for some kind of TACO to happen and yesterday we got some kind of TACO. And Brent crude is now trading at $101.5/b as a result rather than at $112-114/b as it did no the high yesterday.
But what really matters in our view is the political situation on the ground in Iran. Will hardliners continue to hold power or will a more pragmatic faction gain power?
If the hardliners remain in power then oil pain should extend all the way to US midterm elections. The hardliners were apparently still in charge as of last week. Iran immediately retaliated and damaged LNG infrastructure in Qatar after Israel hit Iranian South Pars. The SoH was still closed and all messages coming out of Iran indicated defiance. Hardliners continues in power has a huge consequence for oil prices going forward. The regime has played its ’oil-weapon’ (closing or chocking the Strait of Hormuz). It is using it to achieve political goals. Deterrence: it needs to be so politically and economically expensive to attack Iran that it won’t happen again in the future. Or at least that the US/Israel thinks 10-times over before they attack again. The highest Brent crude oil closing price since the start of the war is $112.19/b last Friday. In comparison the 20-year inflation adjusted Brent price is $103/b. So Brent crude last Friday at $112.19/b isn’t a shockingly high price. And it is still far below the nominal high of $148/b from 2008 which is $220/b if inflation adjusted. So once in a lifetime Iran activates its most powerful weapon. The oil weapon. It needs to show the power of this weapon and it needs to reap political gains. Getting Brent to $112/b and intraday high of $119.5/b (9 March) isn’t a display of the power of that weapon. And it is not a deterrence against future attacks.
So if the hardliners remain in power in Iran, then the SoH will likely remain chocked all the way to US midterm elections and Brent crude will at a minimum go above the historical nominal high of $148/b from 2008.
Thus the outlook for the oil price for the rest of the year doesn’t depend all that much of whether Trump pulls a TACO or not. Stops bombing or not. It depends more on who is in charge in Iran. If it is the hardliners, then deterrence against future attacks via chocking of the SoH and high oil prices is the likely line of action. It is impacting the world but the Iranian ’oil-weapon’ is directed towards the US president and the the US midterm elections.
If a pragmatic faction gets to power in Iran, then a very prosperous future is possible. However, if power is shifting towards a more pragmatic faction in Iran then a completely different direction could evolve. Such a faction could possibly be open for cooperation with the US and the GCC and possibly put its issues versus Israel aside. Then the prosperity we have seen evolving in Dubai could be a possible future also for Iran.
So far it looks like the hardliners are fully in charge. As far as we can see, the hardliners are still fully in control in Iran. That points towards continued chocking of the SoH and oil prices ticking higher as global inventories (the oil market buffers) are drawn lower. And not just for a few more weeks, but possibly all the way to the US midterm elections.
A brief sigh of relief yesterday as oil infra at Kharg wasn’t damaged. But higher today. Brent crude dabbled around a bit yesterday in relief that oil infrastructure at Iran’s Kharg island wasn’t damaged. It traded briefly below the 100-line and in a range of $99.54 – 106.5/b. Its close was near the low at $100.21/b.
No easy victorious way out for Trump. So no end in sight yet. Brent is up 3.2% today to $103.4/b with no signs that the war will end anytime soon. Trump has no easy way to declare victory and mission accomplished as long as Iran is in full control of the Strait of Hormuz while also holding some 440 kg of uranium enriched to 60% and not far from weapons grade at 90%. As long as these two factors are unresolved it is difficult for Trump to pull out of the Middle East. Naturally he gets increasingly frustrated over the situation as the oil price and US retail gas prices keeps ticking higher while the US is tied into the mess in the Middle East. Trying to drag NATO members into his mess but not much luck there.
When commodity prices spike they spike 2x, 3x, 4x or 5x. Supply and demand for commodities are notoriously inflexible. When either of them shifts sharply, the the price can easily go to zero (April 2022) or multiply 2x, 3x, or even 5x of normal. Examples in case cobalt in 2025 where Kongo restricted supply and the price doubled. Global LNG in 2022 where the price went 5x normal for the full year average. Demand for tungsten in ammunition is up strongly along with full war in the middle east. And its price? Up 537%.
Why hasn’t the Brent crude oil price gone 2x, 3x, 4x or 5x versus its normal of $68/b given close to full stop in the flow of oil of the Strait of Hormuz? We are after all talking about close to 20% of global supply being disrupted. The reason is the buffers. It is fairly easy to store oil. Commercial operators only hold stocks for logistical variations. It is a lot of oil in commercial stocks, but that is predominantly because the whole oil system is so huge. In addition we have Strategic Petroleum Reserves (SPRs) of close to 2500 mb of crude and 1000 mb of oil products. The IEA last week decided to release 400 mb from global SPR. Equal to 20 days of full closure of the Strait of Hormuz. Thus oil in commercial stocks on land, commercial oil in transit at sea and release of oil from SPRs is currently buffering the situation.
But we are running the buffers down day by day. As a result we see gradually increasing stress here and there in the global oil market. Asia is feeling the pinch the most. It has very low self sufficiency of oil and most of the exports from the Gulf normally head to Asia. Availability of propane and butane many places in India (LPG) has dried up very quickly. Local prices have tripled as a result. Local availability of crude, bunker oil, fuel oil, jet fuel, naphtha and other oil products is quickly running down to critical levels many places in Asia with prices shooting up. Oman crude oil is marked at $153/b. Jet fuel in Singapore is marked at $191/b.
Oil at sea originating from Strait of Hormuz from before 28 Feb is rapidly emptied. Oil at sea is a large pool of commercial oil. An inventory of oil in constant move. If we assume that the average journey from the Persian Gulf to its destinations has a volume weighted average of 13.5 days then the amount of oil at sea originating from the Persian Gulf when the the US/Israel attacked on 28 Feb was 13.5 days * 20 mb/d = 269 mb. Since the strait closed, this oil has increasingly been delivered at its destinations. Those closest to the Strait, like Pakistan, felt the emptying of this supply chain the fastest. Propane prices shooting to 3x normal there already last week and restaurants serving cold food this week is a result of that. Some 50-60% of Asia’s imports of Naphtha normally originates from the Persian Gulf. So naphtha is a natural pain point for Asia. The Gulf also a large and important exporter of Jet fuel. That shut in has lifted jet prices above $200/b.
To simplify our calculations we assume that no oil has left the Strait since that date and that there is no increase in Saudi exports from Yanbu. Then the draining of this inventory at sea originated from the Persian Gulf will essentially look like this:
The supply chain of oil at sea originating from the Strait of Hormuz is soon empty. Except for oil allowed through the Strait of Hormuz by Iran and increased exports from Yanbu in the Red Sea. Not included here.

Oil at sea is falling fast as oil is delivered without any new refill in the Persian Gulf. Waivers for Russian crude is also shifting Russian crude to consumers. Brent crude will likely start to feel the pinch much more forcefully when oil at sea is drawn down another 200 mb to around 1000 mb. That is not much more than 10 days from here.

Oil and oil products are starting to become very pricy many places. Brent crude has still been shielded from spiking like the others.


Market Still Betting on Timely Resolution, But Each Day Raises Shortage Risk

Christian Kopfer om läget för oljan

Marknaden måste börja betrakta de höga kopparpriserna som det nya normala

Det fysiska spotpriset på brentolja har slagit nytt rekord

40 minuter med Javier Blas om hur världen verkligen påverkas av energikrisen
40 minuter med Javier Blas om hur världen verkligen påverkas av energikrisen

Elpriserna fördubblas, stor osäkerhet inför sommaren

MP Materials, USA:s svar på Kinas dominans över sällsynta jordartsmetaller
Det fysiska spotpriset på brentolja har slagit nytt rekord

Studsvik har idag ansökt om att få bygga 1200-1600 MW kärnkraft i Valdemarsvik
-
 Nyheter3 veckor sedan
40 minuter med Javier Blas om hur världen verkligen påverkas av energikrisen
-
 Nyheter4 veckor sedan
Elpriserna fördubblas, stor osäkerhet inför sommaren
-
 Nyheter4 veckor sedan
MP Materials, USA:s svar på Kinas dominans över sällsynta jordartsmetaller
-
 Nyheter2 veckor sedan
Det fysiska spotpriset på brentolja har slagit nytt rekord
-
 Nyheter4 veckor sedan
Studsvik har idag ansökt om att få bygga 1200-1600 MW kärnkraft i Valdemarsvik
-
 Nyheter2 veckor sedan
Marknaden måste börja betrakta de höga kopparpriserna som det nya normala
-
Analys4 veckor sedan
TACO (or Whatever It Was) Sends Oil Lower — Iran Keeps Choking Hormuz
-

 Nyheter4 veckor sedan
Matproduktion är beroende av gödsel, Gulfkriget skapar brist