

Analys
SHB Råvarubrevet 5 april 2013

 Råvaror allmänt
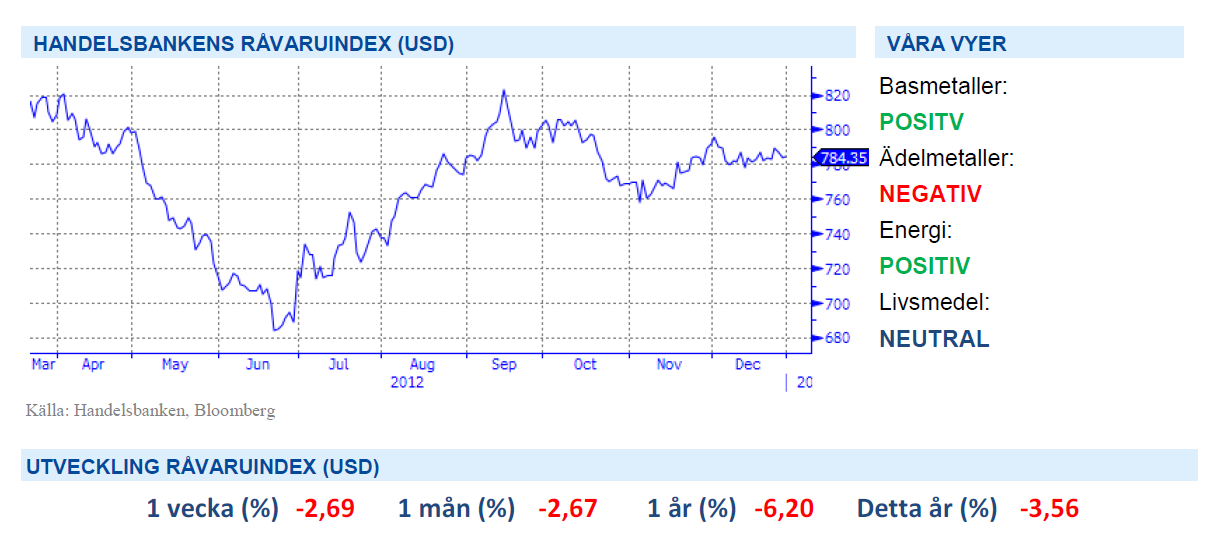
Motig vecka för risktillgångar
Veckan har varit motig för risktillgångar i Europa. Den QE drivna amerikanska börsen fortsätter däremot att driva på konsumtionen i USA trots skattehöjningar. Inköpschefsindex i USA kom in på förvånansvärt låga nivåer och väcker vår oro för att vi missat något tecken i den till synes starka amerikanska återhämtningen. Den låga siffran var också en påminnelse om att USA haft ett starkt säsongsmönster där våren varit en besvikelse under de senaste åren. Under fredagen publicerades non-farm payrolls som visade på färre antal sysselsatta i USA (utanför jordbrukssektorn) än väntat vilket fick bland annat stärkte guldet och försvagade dollarn.
Även från Kina kom inköpschefsindex och denna var visserligen på 12 månaders högsta men fortfarande bara något över 50 strecket. Vi vill se det kinesiska indexet klättra upp mot 52-53 för att säga att återhämtningen där står på säker mark. Investeringar och konsumtion ser dock bra ut men kinaråvaror tyngs av myndigheternas ambitioner att begränsa prisuppgångar i fastigheter. Vår makrosyn på ett Kina i återhämtning är dock intakt och första kvartalets kinadata är alltid svårtolkad på grund av nyårsledigheten.
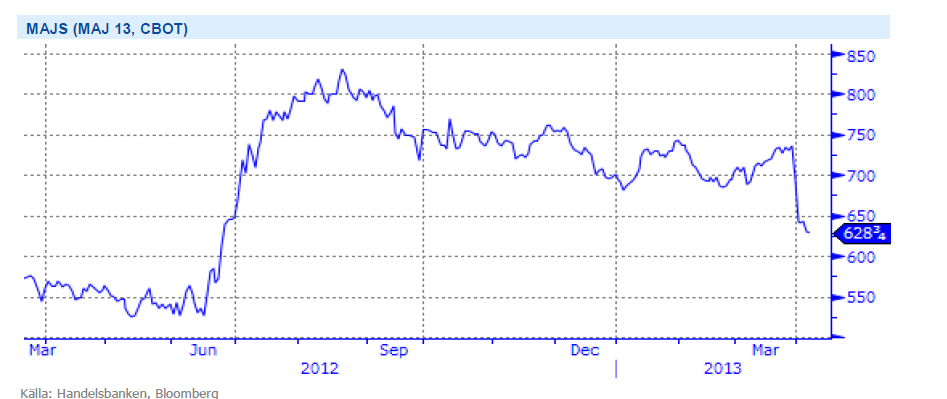
Efter den senaste tidens nedgångar på majs, vete och soja justerar vi vår vy för livsmedel till neutral.
Basmetallerna
Svag vecka för metallerna
Basmetallerna lägger en vecka bakom sig med återigen fallande priser. Volatila metallen nickel föll med 3,4 % medan koppar och aluminium tappade ca 2 % vardera. Veckans inköpschefsindex från Kina gav visst stöd men motarbetades av ytterligare uttalanden från myndigheterna om att begränsa prisuppgångarna på fastighetsmarknaden. Basmetallerna är tekniskt sett översålda och vi väntar oss en rekyl uppåt ganska snart.
I Chile, världens största producent, pågår sedan den 16:e mars en strejk bland hamnarbetarna vilken stoppar upp 9000 ton koppar varje dag. Kopparexporten har därmed minskat med 60 %. Samtidigt förbereder sig arbetarna i BHP Billiton och Anglo Americans koppargruvor för protester för förbättrade arbetsvillkor.
Metallerna tyngs fortsatt höga av lagernivåer (LME:s) där koppar och nickel ligger på historiskt höga nivåer.
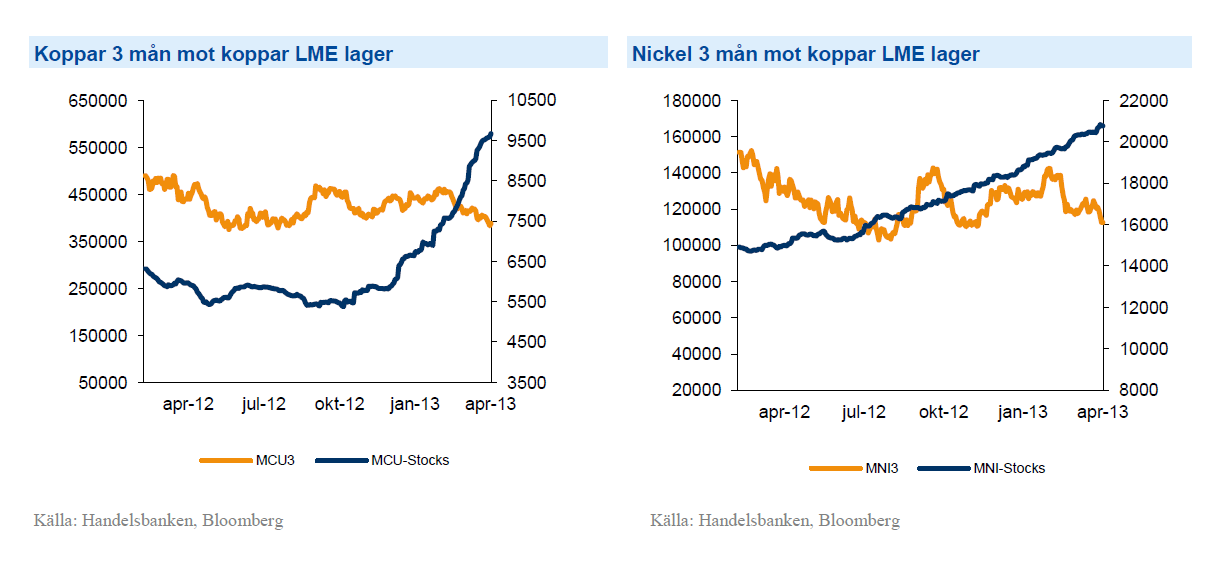
Trots nedgången under veckan tror vi på högre priser på basmetaller och ser istället möjlighet till ”buy on dip”. Vi tror på: BASMET H
Ädelmetaller
Vi tror fortsatt på lägre guld
I veckan skickade vi ut ett trading case där vi följde upp vår tro på lägre guld. Under 2012 nådde guld sin högsta nivå 1794 USD/oz den 4e oktober när QE3 yran var som värst. Därefter har guldet hamnat i en fallande trend. Sedan vi initierade en handelsidé på fallande guld i mitten av februari har guldet fallit. Under mitten av mars kom dock ett trendbrott när oron kring Cypern åter väckte guldets klassiska status som en säker hamn vid oro i det finansiella systemet. Den oron har nu dragit förbi efter att risken för spridningseffekter till övriga svaga länder i Sydeuropa verkar låga.
Den globala återhämtningen sprider sig och den urstarka börsen driver investerare ut ur defensiva positioner såsom guld. Under februari och mars har guld motsvarande 6 % av en årsproduktion i gruvorna sålts ut av ETF-investerare. Guld är den mest tekniskt handlade råvaran. Nu har guldet åter börjat falla och står på ett mycket viktigt stöd på 1550 med fallhöjden ner till 1450. Uppåt tycker vi att en stopp på 1585 är att rekommendera. Denna strategi lämpar sig väl för en hävstångsprodukt då målkurs och stop ligger relativt snävt. För vår långsiktiga tro på ett lägre guldpris lämpar sig GULD S H, utan hävstång bäst.
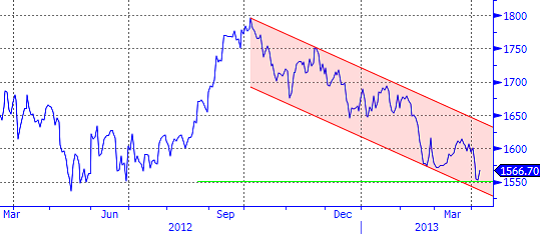
Starkare dollar och högre räntor blir utmanande för guldet samtidigt som inflationen väntas vara låg under året. Vi tror på: GULD S H
Energi
El – en av de bästa råvarorna i år!
Oljan är fortsatt rangehandlad och föll under veckan efter att amerikanska lagersiffror ökat mot förväntan samtidigt som amerikanska sysselsättningssiffror kom in klart under förväntan. Vi har en tro på försiktigt högre oljepriser baserat på att OPEC försvarar prisintervallet 100-110 USD och en allt bättre världskonjunktur. Vi räknar således med att marknaden värderar detta som intressanta nivåer kliva in i olja igen.
El har varit en av de bästa råvarorna under året (+10%) och vi fortsätter tro på högre priser. Det har varit en väldigt torr väderlek under de två veckor som gått med lågt inflöde till vattenmagasinen och energibalansen har minskat ytterligare 2 TWh till -14TWh mot normal år (se blått nedan) samtidigt som det varit väldigt kallt för året.
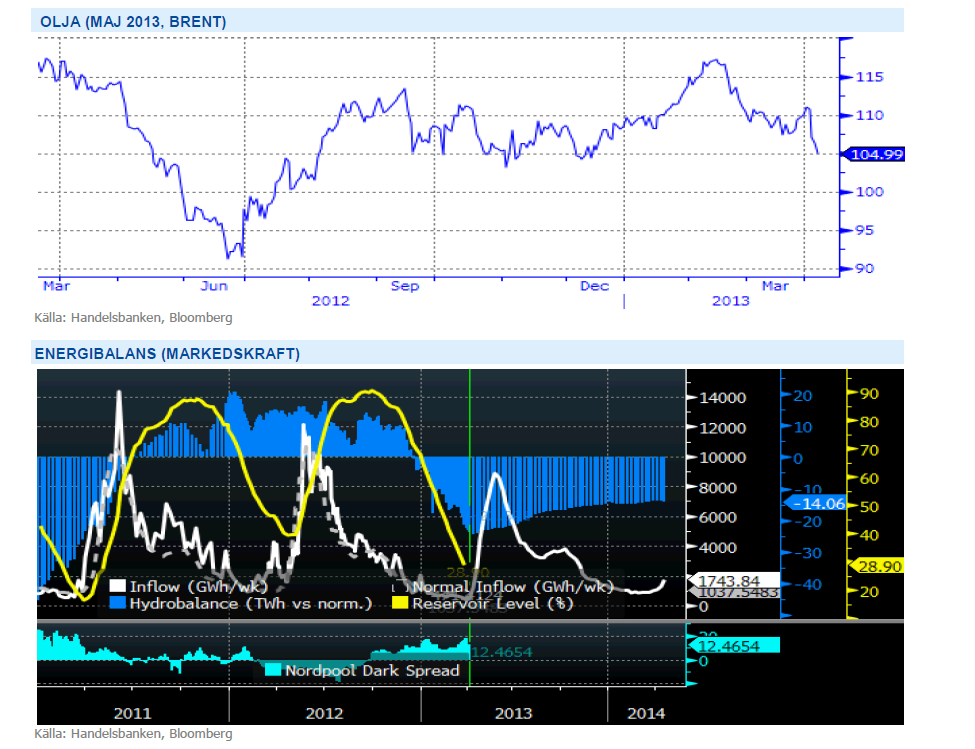
Den råvarugrupp som är mest beroende av den globala konjunkturen är Energi och med en starkare konjunktur ser vi positivt på utvecklingen för denna sektor. Vi tror på: ENERGI H
Livsmedel
Vi byter vy till neutral
Vi har länge haft en starkt negativ syn på jordbruksråvarorna soja, vete och majs efter fjolårets svåra torka i USA som drev upp priserna rejält. Priserna har sedan långsamt fallit i takt med att vi har närmat oss det nya odlingsåret. Precis före påsk kom amerikanska jordbruksdepartementet med sin kvartalsrapport som visade på större lager än väntat. Störst skillnad var det för majsen som visade på 7 % större lager än väntat (5,4 miljoner bushel mot förväntade 5 miljoner). På två dagar föll priset på majs 14 % och är nu nere på nivåer före torkan. På kort sikt tror vi därför att risken för ytterligare ras är begränsad och byter syn på livsmedel till neutral. Det europeiska vetet (som är underliggande till våra certifikat) behåller sin styrka då kall väderlek försvårar för pågående vårsådd och även försenar utvecklingen för höstgrödorna. Mot hösten, givet en normal sommar, bör vi dock få se lägre vetepris med upptill 15-18%.
Kaffe (SHB Coffee) är den råvara i vårt råvaruindex som fallit mest sen årsskiftet (-12 %). Det finns fortfarande gott om kaffe på marknaden efter förra årets rekordskördar, dessutom ligger skörden i Brasilien ett par månader bort där fortsatt höga skördar väntas. Under senare delen av mars månad har vi sett en liten uppgång som följd av att Kenya minskat sin export av kaffebönor med 15 procent till länder som Tyskland, Sverige och USA. Dessutom visade siffror som kom i veckan på 17 procent lägre export än vid samma period tidigare år från Guatemala p. g. a. svampsjukdomarna som drabbat stora delar av Centralamerika. Under förutsättning att vi får ett normalt år utan dramatiska väderproblem och fortsatt goda skördar från de stora kaffeproducerande länderna ser vi priset på Arabica–kaffet att komma ligga på dagens nivåer fram till efter skörd.
Handelsbankens Råvaruindex
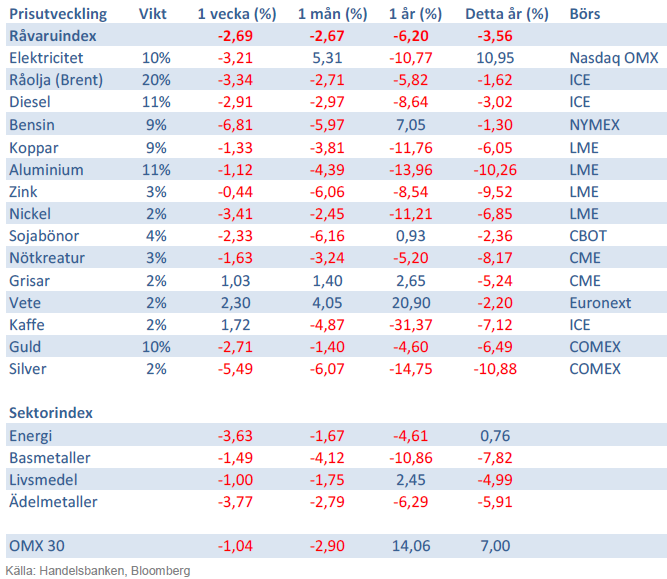
Handelsbankens råvaruindex består av de underliggande indexen för respektive råvara. Vikterna är bestämda till hälften från värdet av nordisk produktion (globala produktionen för sektorindex) och till hälften från likviditeten i terminskontrakten.
[box]SHB Råvarubrevet är producerat av Handelsbanken och publiceras i samarbete och med tillstånd på Råvarumarknaden.se[/box]
Ansvarsbegränsning
Detta material är producerat av Svenska Handelsbanken AB (publ) i fortsättningen kallad Handelsbanken. De som arbetar med innehållet är inte analytiker och materialet är inte oberoende investeringsanalys. Innehållet är uteslutande avsett för kunder i Sverige. Syftet är att ge en allmän information till Handelsbankens kunder och utgör inte ett personligt investeringsråd eller en personlig rekommendation. Informationen ska inte ensamt utgöra underlag för investeringsbeslut. Kunder bör inhämta råd från sina rådgivare och basera sina investeringsbeslut utifrån egen erfarenhet.
Informationen i materialet kan ändras och också avvika från de åsikter som uttrycks i oberoende investeringsanalyser från Handelsbanken. Informationen grundar sig på allmänt tillgänglig information och är hämtad från källor som bedöms som tillförlitliga, men riktigheten kan inte garanteras och informationen kan vara ofullständig eller nedkortad. Ingen del av förslaget får reproduceras eller distribueras till någon annan person utan att Handelsbanken dessförinnan lämnat sitt skriftliga medgivande. Handelsbanken ansvarar inte för att materialet används på ett sätt som strider mot förbudet mot vidarebefordran eller offentliggörs i strid med bankens regler.


Down to the lowest since early May. Brent crude has fallen sharply the latest four days. It closed at USD 64.11/b yesterday which is the lowest since early May. It is staging a 1.3% rebound this morning along with gains in both equities and industrial metals with an added touch of support from a softer USD on top.

What stands out the most to us this week is the collapse in the Dubai one to three months time-spread.
Dubai is medium sour crude. OPEC+ is in general medium sour crude production. Asian refineries are predominantly designed to process medium sour crude. So Dubai is the real measure of the balance between OPEC+ holding back or not versus Asian oil demand for consumption and stock building.
A sharp weakening of the front-end of the Dubai curve. The front-end of the Dubai crude curve has been holding out very solidly throughout this summer while the front-end of the Brent and WTI curves have been steadily softening. But the strength in the Dubai curve in our view was carrying the crude oil market in general. A source of strength in the crude oil market. The core of the strength.
The now finally sharp decline of the front-end of the Dubai crude curve is thus a strong shift. Weakness in the Dubai crude marker is weakness in the core of the oil market. The core which has helped to hold the oil market elevated.
Facts supports the weakening. Add in facts of Iraq lifting production from Kurdistan through Turkey. Saudi Arabia lifting production to 10 mb/d in September (normal production level) and lifting exports as well as domestic demand for oil for power for air con is fading along with summer heat. Add also in counter seasonal rise in US crude and product stocks last week. US oil stocks usually decline by 1.3 mb/week this time of year. Last week they instead rose 6.4 mb/week (+7.2 mb if including SPR). Total US commercial oil stocks are now only 2.1 mb below the 2015-19 seasonal average. US oil stocks normally decline from now to Christmas. If they instead continue to rise, then it will be strongly counter seasonal rise and will create a very strong bearish pressure on oil prices.
Will OPEC+ lift its voluntary quotas by zero, 137 kb/d, 500 kb/d or 1.5 mb/d? On Sunday of course OPEC+ will decide on how much to unwind of the remaining 1.5 mb/d of voluntary quotas for November. Will it be 137 kb/d yet again as for October? Will it be 500 kb/d as was talked about earlier this week? Or will it be a full unwind in one go of 1.5 mb/d? We think most likely now it will be at least 500 kb/d and possibly a full unwind. We discussed this in a not earlier this week: ”500 kb/d of voluntary quotas in October. But a full unwind of 1.5 mb/d”
The strength in the front-end of the Dubai curve held out through summer while Brent and WTI curve structures weakened steadily. That core strength helped to keep flat crude oil prices elevated close to the 70-line. Now also the Dubai curve has given in.

Brent crude oil forward curves

Total US commercial stocks now close to normal. Counter seasonal rise last week. Rest of year?

Total US crude and product stocks on a steady trend higher.

Analys
OPEC+ will likely unwind 500 kb/d of voluntary quotas in October. But a full unwind of 1.5 mb/d in one go could be in the cards
Down to mid-60ies as Iraq lifts production while Saudi may be tired of voluntary cut frugality. The Brent December contract dropped 1.6% yesterday to USD 66.03/b. This morning it is down another 0.3% to USD 65.8/b. The drop in the price came on the back of the combined news that Iraq has resumed 190 kb/d of production in Kurdistan with exports through Turkey while OPEC+ delegates send signals that the group will unwind the remaining 1.65 mb/d (less the 137 kb/d in October) of voluntary cuts at a pace of 500 kb/d per month pace.
Signals of accelerated unwind and Iraqi increase may be connected. Russia, Kazakhstan and Iraq were main offenders versus the voluntary quotas they had agreed to follow. Russia had a production ’debt’ (cumulative overproduction versus quota) of close to 90 mb in March this year while Kazakhstan had a ’debt’ of about 60 mb and the same for Iraq. This apparently made Saudi Arabia angry this spring. Why should Saudi Arabia hold back if the other voluntary cutters were just freeriding? Thus the sudden rapid unwinding of voluntary cuts. That is at least one angle of explanations for the accelerated unwinding.
If the offenders with production debts then refrained from lifting production as the voluntary cuts were rapidly unwinded, then they could ’pay back’ their ’debts’ as they would under-produce versus the new and steadily higher quotas.
Forget about Kazakhstan. Its production was just too far above the quotas with no hope that the country would hold back production due to cross-ownership of oil assets by international oil companies. But Russia and Iraq should be able to do it.
Iraqi cumulative overproduction versus quotas could reach 85-90 mb in October. Iraq has however steadily continued to overproduce by 3-5 mb per month. In July its new and gradually higher quota came close to equal with a cumulative overproduction of only 0.6 mb that month. In August again however its production had an overshoot of 100 kb/d or 3.1 mb for the month. Its cumulative production debt had then risen to close to 80 mb. We don’t know for September yet. But looking at October we now know that its production will likely average close to 4.5 mb/d due to the revival of 190 kb/d of production in Kurdistan. Its quota however will only be 4.24 mb/d. Its overproduction in October will thus likely be around 250 kb/d above its quota with its production debt rising another 7-8 mb to a total of close to 90 mb.
Again, why should Saudi Arabia be frugal while Iraq is freeriding. Better to get rid of the voluntary quotas as quickly as possible and then start all over with clean sheets.
Unwinding the remaining 1.513 mb/d in one go in October? If OPEC+ unwinds the remaining 1.513 mb/d of voluntary cuts in one big go in October, then Iraq’s quota will be around 4.4 mb/d for October versus its likely production of close to 4.5 mb/d for the coming month..
OPEC+ should thus unwind the remaining 1.513 mb/d (1.65 – 0.137 mb/d) in one go for October in order for the quota of Iraq to be able to keep track with Iraq’s actual production increase.
October 5 will show how it plays out. But a quota unwind of at least 500 kb/d for Oct seems likely. An overall increase of at least 500 kb/d in the voluntary quota for October looks likely. But it could be the whole 1.513 mb/d in one go. If the increase in the quota is ’only’ 500 kb/d then Iraqi cumulative production will still rise by 5.7 mb to a total of 85 mb in October.
Iraqi production debt versus quotas will likely rise by 5.7 mb in October if OPEC+ only lifts the overall quota by 500 kb/d in October. Here assuming historical production debt did not rise in September. That Iraq lifts its production by 190 kb/d in October to 4.47 mb/d (August level + 190 kb/d) and that OPEC+ unwinds 500 kb/d of the remining quotas in October when they decide on this on 5 October.

U.S. commercial crude inventories posted a marginal draw last week, falling by 0.6 million barrels to 414.8 million barrels. Inventories remain 4% below the five-year seasonal average, but the draw is far smaller than last week’s massive 9.3-million-barrel decline. Higher crude imports (+803,000 bl d WoW) and steady refinery runs (93% utilization) helped keep the crude balance relatively neutral.

Yet another drawdown indicates commercial crude inventories continue to trend below the 2015–2022 seasonal norm (~440 million barrels), though at 414.8 million barrels, levels are now almost exactly in line with both the 2023 and 2024 trajectory, suggesting stable YoY conditions (see page 3 attached).
Gasoline inventories dropped by 1.1 million barrels and are now 2% below the five-year average. The decline was broad-based, with both finished gasoline and blending components falling, indicating lower output and resilient end-user demand as we enter the shoulder season post-summer (see page 6 attached).
On the diesel side, distillate inventories declined by 1.7 million barrels, snapping a two-week streak of strong builds. At 125 million barrels, diesel inventories are once again 8% below the five-year average and trending near the low end of the historical range.
In total, commercial petroleum inventories (excl. SPR) slipped by 0.5 million barrels on the week to ish 1,281.5 million barrels. While essentially flat, this ends a two-week streak of meaningful builds, reflecting a return to a slightly tighter situation.
On the demand side, the DOE’s ‘products supplied’ metric (see page 6 attached), a proxy for implied consumption, softened slightly. Total demand for crude oil over the past four weeks averaged 20.5 million barrels per day, up just 0.9% YoY.
Summing up: This week’s report shows a re-tightening in diesel supply and modest draws across the board, while demand growth is beginning to flatten. Inventories remain structurally low, but the tone is less bullish than in recent weeks.


A sharp weakening at the core of the oil market: The Dubai curve

Guld nära 4000 USD och silver 50 USD, därför kan de fortsätta stiga
OPEC+ will likely unwind 500 kb/d of voluntary quotas in October. But a full unwind of 1.5 mb/d in one go could be in the cards

Blykalla och amerikanska Oklo inleder ett samarbete

Fortsatt stabilt elpris – men dubbelt så dyrt som i fjol

Eurobattery Minerals satsar på kritiska metaller för Europas självförsörjning

Mahvie Minerals i en guldtrend

Guldpriset kan närma sig 5000 USD om centralbankens oberoende skadas

OPEC signalerar att de inte bryr sig om oljepriset faller kommande månader
Volatile but going nowhere. Brent crude circles USD 66 as market weighs surplus vs risk
-
 Nyheter4 veckor sedan
Eurobattery Minerals satsar på kritiska metaller för Europas självförsörjning
-
 Nyheter3 veckor sedan
Mahvie Minerals i en guldtrend
-
 Nyheter4 veckor sedan
Guldpriset kan närma sig 5000 USD om centralbankens oberoende skadas
-
 Nyheter4 veckor sedan
OPEC signalerar att de inte bryr sig om oljepriset faller kommande månader
-
Analys3 veckor sedan
Volatile but going nowhere. Brent crude circles USD 66 as market weighs surplus vs risk
-

 Nyheter3 veckor sedan
Aktier i guldbolag laggar priset på guld
-

 Nyheter3 veckor sedan
Kinas elproduktion slog nytt rekord i augusti, vilket även kolkraft gjorde
-
 Nyheter2 veckor sedan
Tyskland har så höga elpriser att företag inte har råd att använda elektricitet